
By InvestMacro
Here are the latest charts and statistics for the Commitment of Traders (COT) reports data published by the Commodities Futures Trading Commission (CFTC).
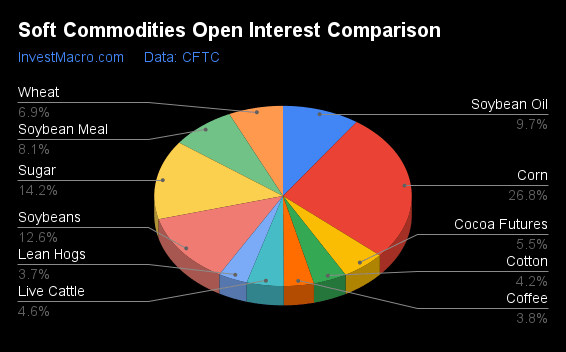
The latest COT data is updated through Tuesday January 30th and shows a quick view of how large traders (for-profit speculators and commercial entities) were positioned in the futures markets.
Weekly Speculator Changes led by Lean Hogs & Live Cattle
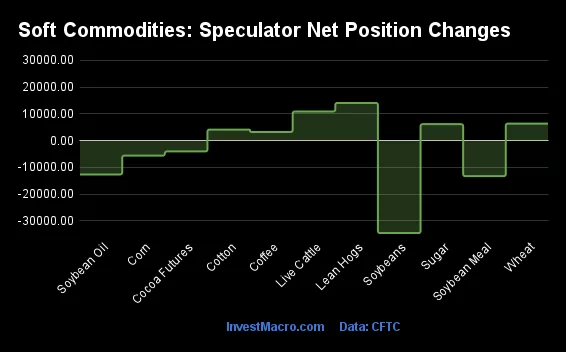
The COT soft commodities markets speculator bets were higher this week as six out of the eleven softs markets we cover had higher positioning while the other five markets had lower speculator contracts.
Free Reports:
 Get our Weekly Commitment of Traders Reports - See where the biggest traders (Hedge Funds and Commercial Hedgers) are positioned in the futures markets on a weekly basis.
 Sign Up for Our Stock Market Newsletter – Get updated on News, Charts & Rankings of Public Companies when you join our Stocks Newsletter
Leading the gains for the softs markets was Lean Hogs (14,068 contracts) with Live Cattle (10,882 contracts), Wheat (6,327 contracts), Sugar (6,129 contracts), Cotton (4,112 contracts) and Coffee (3,221 contracts) also showing positive weeks.
The markets with the declines in speculator bets this week were Soybeans (-34,583 contracts), Soybean Meal (-13,316 contracts), Soybean Oil (-12,677 contracts), Cocoa (-4,062 contracts) and with Corn (-5,632 contracts) also registering lower bets on the week.
Speculators Leaderboard
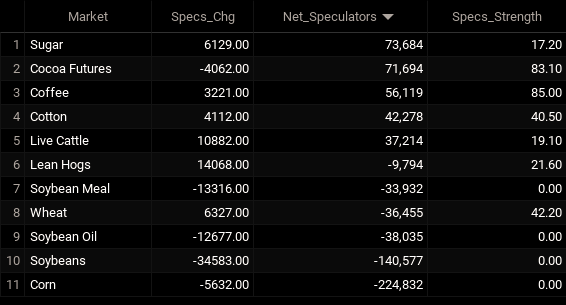
Legend: Weekly Speculators Change | Speculators Current Net Position | Speculators Strength Score compared to last 3-Years (0-100 range)
Strength Scores led by Coffee & Cocoa
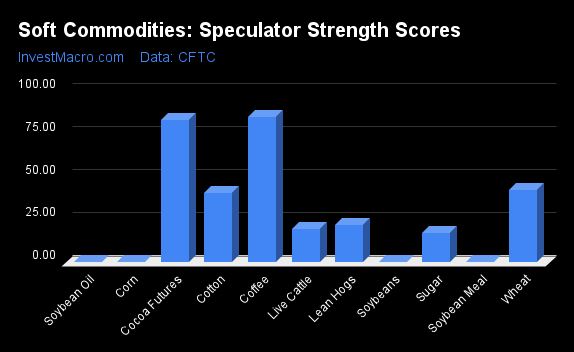
COT Strength Scores (a normalized measure of Speculator positions over a 3-Year range, from 0 to 100 where above 80 is Extreme-Bullish and below 20 is Extreme-Bearish) showed that Coffee (85 percent) and Cocoa (83 percent) lead the softs markets this week.
On the downside, Soybean Oil (0 percent), Soybean Meal (0 percent), Corn (0 percent), Soybeans (0 percent), Sugar (17 percent) and Live Cattle (19 percent) come in at the lowest strength levels currently and are all in Extreme-Bearish territory (below 20 percent).
Strength Statistics:
Corn (0.0 percent) vs Corn previous week (0.7 percent)
Sugar (17.2 percent) vs Sugar previous week (15.0 percent)
Coffee (85.0 percent) vs Coffee previous week (81.7 percent)
Soybeans (0.0 percent) vs Soybeans previous week (8.8 percent)
Soybean Oil (0.0 percent) vs Soybean Oil previous week (7.6 percent)
Soybean Meal (0.0 percent) vs Soybean Meal previous week (6.3 percent)
Live Cattle (19.1 percent) vs Live Cattle previous week (7.3 percent)
Lean Hogs (21.6 percent) vs Lean Hogs previous week (10.1 percent)
Cotton (40.5 percent) vs Cotton previous week (37.4 percent)
Cocoa (83.1 percent) vs Cocoa previous week (87.2 percent)
Wheat (42.2 percent) vs Wheat previous week (37.8 percent)
Cotton & Coffee top the 6-Week Strength Trends
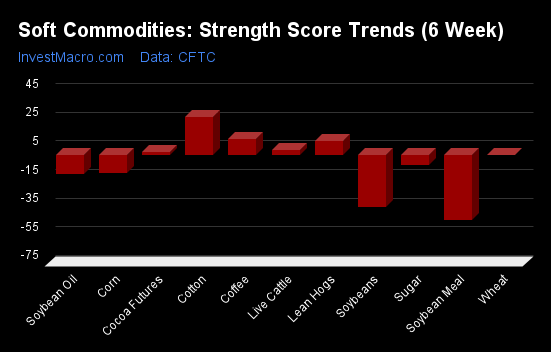
COT Strength Score Trends (or move index, calculates the 6-week changes in strength scores) showed that Cotton (27 percent) and Coffee (11 percent) lead the past six weeks trends for soft commodities. Lean Hogs (10 percent), Live Cattle (3 percent) and Cocoa (2 percent) are the next highest positive movers in the latest trends data.
Soybean Meal (-45 percent) leads the downside trend scores currently with Soybeans (-36 percent), Soybean Oil (-13 percent) and Corn (-13 percent) following next with lower trend scores.
Strength Trend Statistics:
Corn (-12.7 percent) vs Corn previous week (-15.4 percent)
Sugar (-6.9 percent) vs Sugar previous week (-14.4 percent)
Coffee (11.1 percent) vs Coffee previous week (16.7 percent)
Soybeans (-36.4 percent) vs Soybeans previous week (-31.6 percent)
Soybean Oil (-13.0 percent) vs Soybean Oil previous week (-11.7 percent)
Soybean Meal (-45.2 percent) vs Soybean Meal previous week (-50.0 percent)
Live Cattle (3.3 percent) vs Live Cattle previous week (-13.4 percent)
Lean Hogs (9.7 percent) vs Lean Hogs previous week (3.8 percent)
Cotton (26.9 percent) vs Cotton previous week (18.1 percent)
Cocoa (2.3 percent) vs Cocoa previous week (8.6 percent)
Wheat (0.4 percent) vs Wheat previous week (-1.9 percent)
Individual Soft Commodities Markets:
CORN Futures:
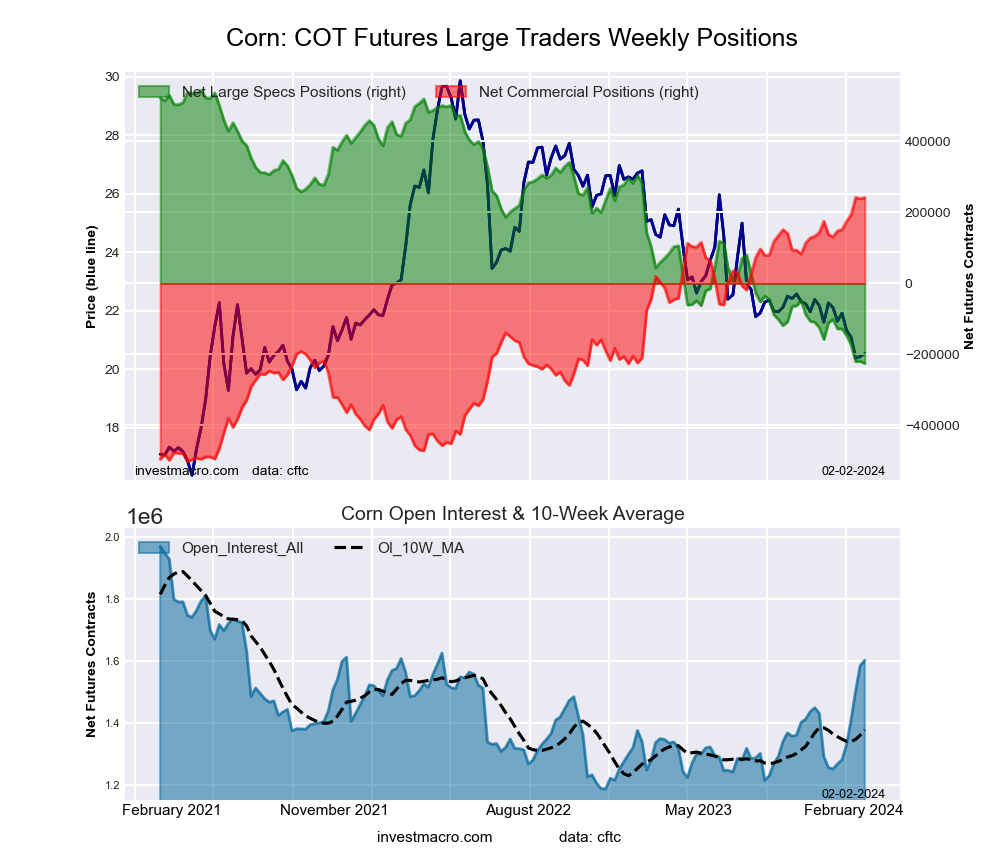 The CORN large speculator standing this week was a net position of -224,832 contracts in the data reported through Tuesday. This was a weekly reduction of -5,632 contracts from the previous week which had a total of -219,200 net contracts.
This week’s current strength score (the trader positioning range over the past three years, measured from 0 to 100) shows the speculators are currently Bearish-Extreme with a score of 0.0 percent. The commercials are Bullish-Extreme with a score of 99.9 percent and the small traders (not shown in chart) are Bullish-Extreme with a score of 100.0 percent.
Price Trend-Following Model: Strong Downtrend
Our weekly trend-following model classifies the current market price position as: Strong Downtrend. The current action for the model is considered to be: Hold – Maintain Short Position.
| CORN Futures Statistics | SPECULATORS | COMMERCIALS | SMALL TRADERS |
| – Percent of Open Interest Longs: | 16.6 | 46.5 | 9.6 |
| – Percent of Open Interest Shorts: | 30.7 | 31.4 | 10.7 |
| – Net Position: | -224,832 | 241,727 | -16,895 |
| – Gross Longs: | 266,671 | 745,348 | 154,099 |
| – Gross Shorts: | 491,503 | 503,621 | 170,994 |
| – Long to Short Ratio: | 0.5 to 1 | 1.5 to 1 | 0.9 to 1 |
| NET POSITION TREND: | |||
| – Strength Index Score (3 Year Range Pct): | 0.0 | 99.9 | 100.0 |
| – Strength Index Reading (3 Year Range): | Bearish-Extreme | Bullish-Extreme | Bullish-Extreme |
| NET POSITION MOVEMENT INDEX: | |||
| – 6-Week Change in Strength Index: | -12.7 | 12.6 | 5.4 |
SUGAR Futures:
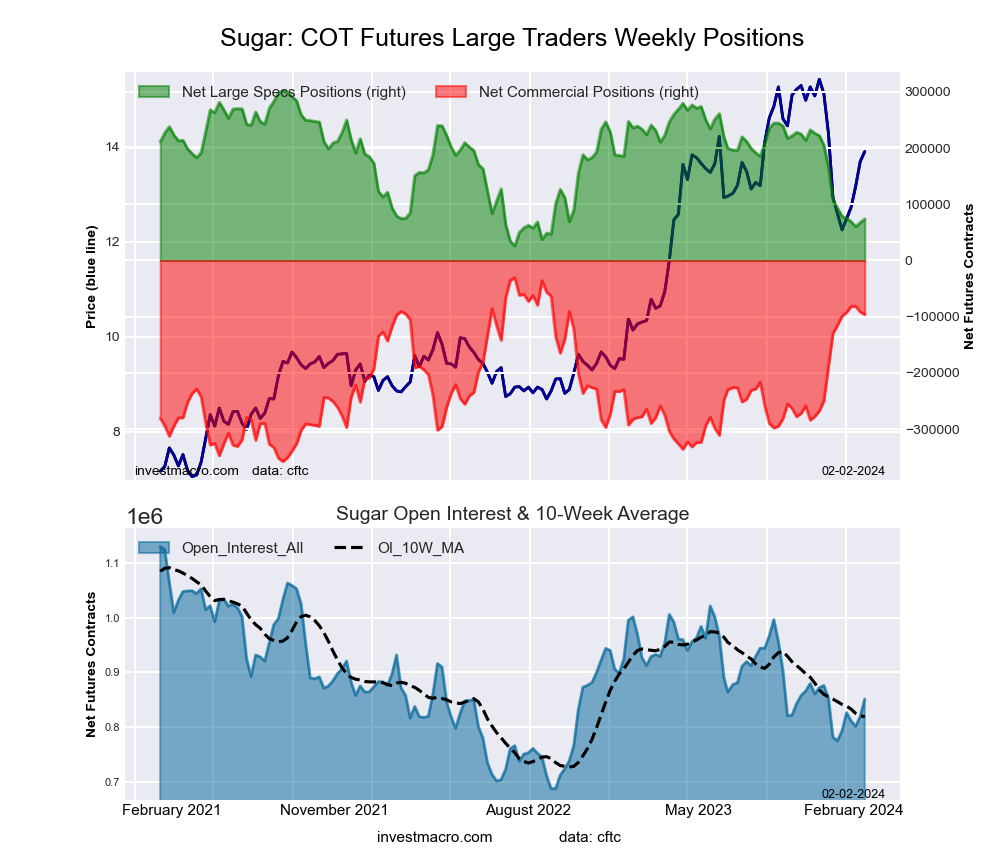 The SUGAR large speculator standing this week was a net position of 73,684 contracts in the data reported through Tuesday. This was a weekly boost of 6,129 contracts from the previous week which had a total of 67,555 net contracts.
This week’s current strength score (the trader positioning range over the past three years, measured from 0 to 100) shows the speculators are currently Bearish-Extreme with a score of 17.2 percent. The commercials are Bullish with a score of 80.0 percent and the small traders (not shown in chart) are Bearish with a score of 31.3 percent.
Price Trend-Following Model: Downtrend
Our weekly trend-following model classifies the current market price position as: Downtrend. The current action for the model is considered to be: Hold – Maintain Short Position.
| SUGAR Futures Statistics | SPECULATORS | COMMERCIALS | SMALL TRADERS |
| – Percent of Open Interest Longs: | 21.0 | 56.2 | 8.7 |
| – Percent of Open Interest Shorts: | 12.3 | 67.5 | 6.1 |
| – Net Position: | 73,684 | -96,000 | 22,316 |
| – Gross Longs: | 178,443 | 478,435 | 74,201 |
| – Gross Shorts: | 104,759 | 574,435 | 51,885 |
| – Long to Short Ratio: | 1.7 to 1 | 0.8 to 1 | 1.4 to 1 |
| NET POSITION TREND: | |||
| – Strength Index Score (3 Year Range Pct): | 17.2 | 80.0 | 31.3 |
| – Strength Index Reading (3 Year Range): | Bearish-Extreme | Bullish | Bearish |
| NET POSITION MOVEMENT INDEX: | |||
| – 6-Week Change in Strength Index: | -6.9 | 5.8 | 0.3 |
COFFEE Futures:
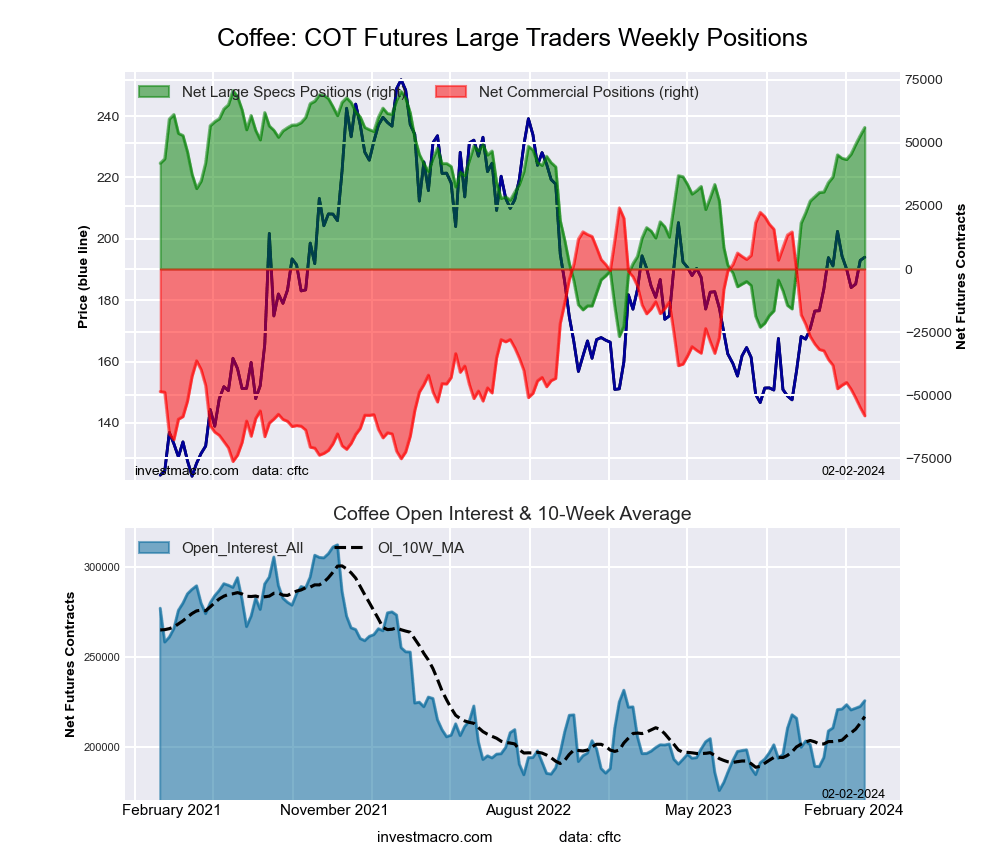 The COFFEE large speculator standing this week was a net position of 56,119 contracts in the data reported through Tuesday. This was a weekly advance of 3,221 contracts from the previous week which had a total of 52,898 net contracts.
This week’s current strength score (the trader positioning range over the past three years, measured from 0 to 100) shows the speculators are currently Bullish-Extreme with a score of 85.0 percent. The commercials are Bearish-Extreme with a score of 18.0 percent and the small traders (not shown in chart) are Bearish with a score of 40.7 percent.
Price Trend-Following Model: Uptrend
Our weekly trend-following model classifies the current market price position as: Uptrend. The current action for the model is considered to be: Hold – Maintain Long Position.
| COFFEE Futures Statistics | SPECULATORS | COMMERCIALS | SMALL TRADERS |
| – Percent of Open Interest Longs: | 35.9 | 35.1 | 4.3 |
| – Percent of Open Interest Shorts: | 11.1 | 61.0 | 3.4 |
| – Net Position: | 56,119 | -58,218 | 2,099 |
| – Gross Longs: | 81,054 | 79,239 | 9,784 |
| – Gross Shorts: | 24,935 | 137,457 | 7,685 |
| – Long to Short Ratio: | 3.3 to 1 | 0.6 to 1 | 1.3 to 1 |
| NET POSITION TREND: | |||
| – Strength Index Score (3 Year Range Pct): | 85.0 | 18.0 | 40.7 |
| – Strength Index Reading (3 Year Range): | Bullish-Extreme | Bearish-Extreme | Bearish |
| NET POSITION MOVEMENT INDEX: | |||
| – 6-Week Change in Strength Index: | 11.1 | -10.7 | -1.3 |
SOYBEANS Futures:
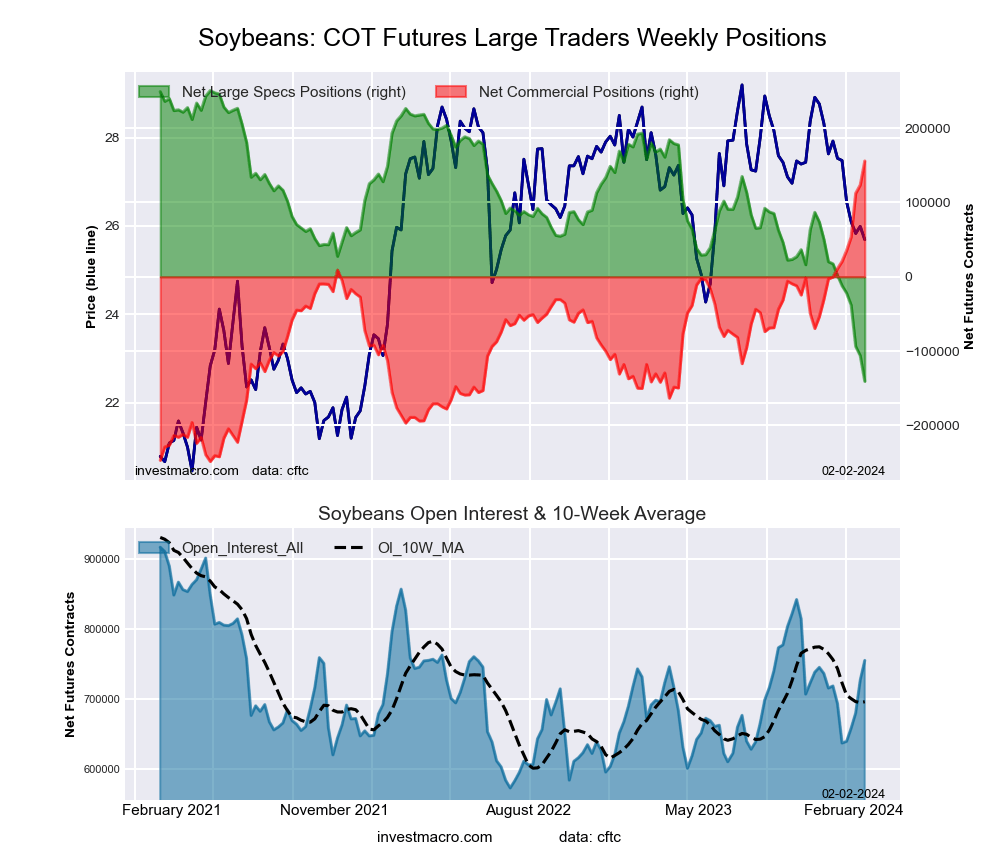 The SOYBEANS large speculator standing this week was a net position of -140,577 contracts in the data reported through Tuesday. This was a weekly decline of -34,583 contracts from the previous week which had a total of -105,994 net contracts.
This week’s current strength score (the trader positioning range over the past three years, measured from 0 to 100) shows the speculators are currently Bearish-Extreme with a score of 0.0 percent. The commercials are Bullish-Extreme with a score of 100.0 percent and the small traders (not shown in chart) are Bullish with a score of 68.1 percent.
Price Trend-Following Model: Strong Downtrend
Our weekly trend-following model classifies the current market price position as: Strong Downtrend. The current action for the model is considered to be: Hold – Maintain Short Position.
| SOYBEANS Futures Statistics | SPECULATORS | COMMERCIALS | SMALL TRADERS |
| – Percent of Open Interest Longs: | 10.3 | 60.1 | 6.5 |
| – Percent of Open Interest Shorts: | 28.9 | 39.4 | 8.5 |
| – Net Position: | -140,577 | 155,822 | -15,245 |
| – Gross Longs: | 77,880 | 453,583 | 49,226 |
| – Gross Shorts: | 218,457 | 297,761 | 64,471 |
| – Long to Short Ratio: | 0.4 to 1 | 1.5 to 1 | 0.8 to 1 |
| NET POSITION TREND: | |||
| – Strength Index Score (3 Year Range Pct): | 0.0 | 100.0 | 68.1 |
| – Strength Index Reading (3 Year Range): | Bearish-Extreme | Bullish-Extreme | Bullish |
| NET POSITION MOVEMENT INDEX: | |||
| – 6-Week Change in Strength Index: | -36.4 | 35.8 | -5.3 |
SOYBEAN OIL Futures:
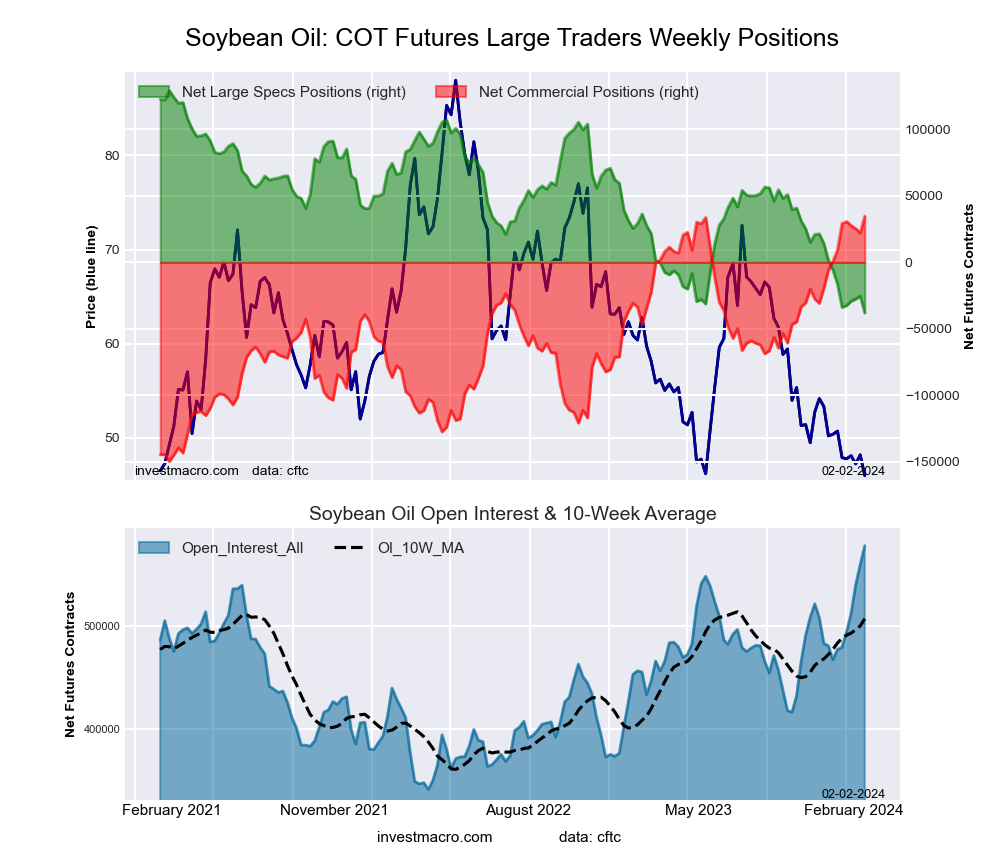 The SOYBEAN OIL large speculator standing this week was a net position of -38,035 contracts in the data reported through Tuesday. This was a weekly reduction of -12,677 contracts from the previous week which had a total of -25,358 net contracts.
This week’s current strength score (the trader positioning range over the past three years, measured from 0 to 100) shows the speculators are currently Bearish-Extreme with a score of 0.0 percent. The commercials are Bullish-Extreme with a score of 100.0 percent and the small traders (not shown in chart) are Bearish with a score of 26.1 percent.
Price Trend-Following Model: Downtrend
Our weekly trend-following model classifies the current market price position as: Downtrend. The current action for the model is considered to be: Hold – Maintain Short Position.
| SOYBEAN OIL Futures Statistics | SPECULATORS | COMMERCIALS | SMALL TRADERS |
| – Percent of Open Interest Longs: | 17.3 | 50.0 | 5.6 |
| – Percent of Open Interest Shorts: | 23.8 | 44.1 | 5.0 |
| – Net Position: | -38,035 | 34,664 | 3,371 |
| – Gross Longs: | 99,948 | 289,600 | 32,569 |
| – Gross Shorts: | 137,983 | 254,936 | 29,198 |
| – Long to Short Ratio: | 0.7 to 1 | 1.1 to 1 | 1.1 to 1 |
| NET POSITION TREND: | |||
| – Strength Index Score (3 Year Range Pct): | 0.0 | 100.0 | 26.1 |
| – Strength Index Reading (3 Year Range): | Bearish-Extreme | Bullish-Extreme | Bearish |
| NET POSITION MOVEMENT INDEX: | |||
| – 6-Week Change in Strength Index: | -13.0 | 13.8 | -14.3 |
SOYBEAN MEAL Futures:
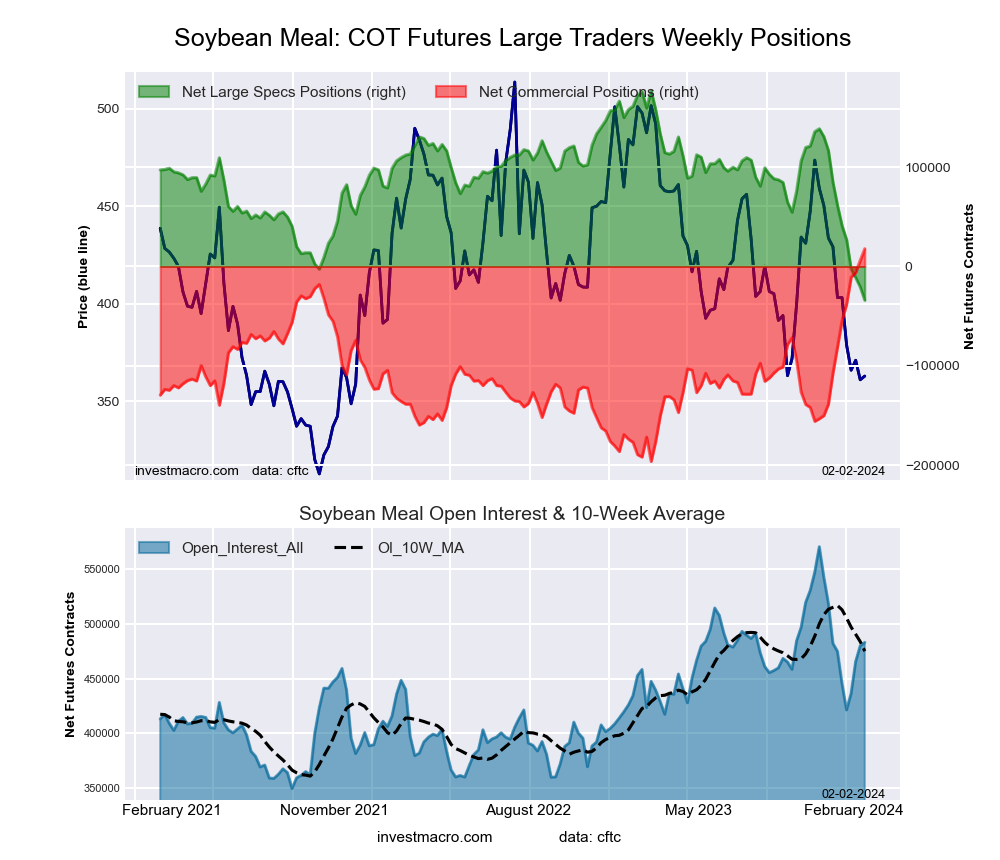 The SOYBEAN MEAL large speculator standing this week was a net position of -33,932 contracts in the data reported through Tuesday. This was a weekly fall of -13,316 contracts from the previous week which had a total of -20,616 net contracts.
This week’s current strength score (the trader positioning range over the past three years, measured from 0 to 100) shows the speculators are currently Bearish-Extreme with a score of 0.0 percent. The commercials are Bullish-Extreme with a score of 100.0 percent and the small traders (not shown in chart) are Bearish with a score of 27.5 percent.
Price Trend-Following Model: Strong Downtrend
Our weekly trend-following model classifies the current market price position as: Strong Downtrend. The current action for the model is considered to be: Hold – Maintain Short Position.
| SOYBEAN MEAL Futures Statistics | SPECULATORS | COMMERCIALS | SMALL TRADERS |
| – Percent of Open Interest Longs: | 15.0 | 51.2 | 10.1 |
| – Percent of Open Interest Shorts: | 22.0 | 47.5 | 6.8 |
| – Net Position: | -33,932 | 17,882 | 16,050 |
| – Gross Longs: | 72,409 | 247,263 | 48,670 |
| – Gross Shorts: | 106,341 | 229,381 | 32,620 |
| – Long to Short Ratio: | 0.7 to 1 | 1.1 to 1 | 1.5 to 1 |
| NET POSITION TREND: | |||
| – Strength Index Score (3 Year Range Pct): | 0.0 | 100.0 | 27.5 |
| – Strength Index Reading (3 Year Range): | Bearish-Extreme | Bullish-Extreme | Bearish |
| NET POSITION MOVEMENT INDEX: | |||
| – 6-Week Change in Strength Index: | -45.2 | 46.3 | -16.9 |
LIVE CATTLE Futures:
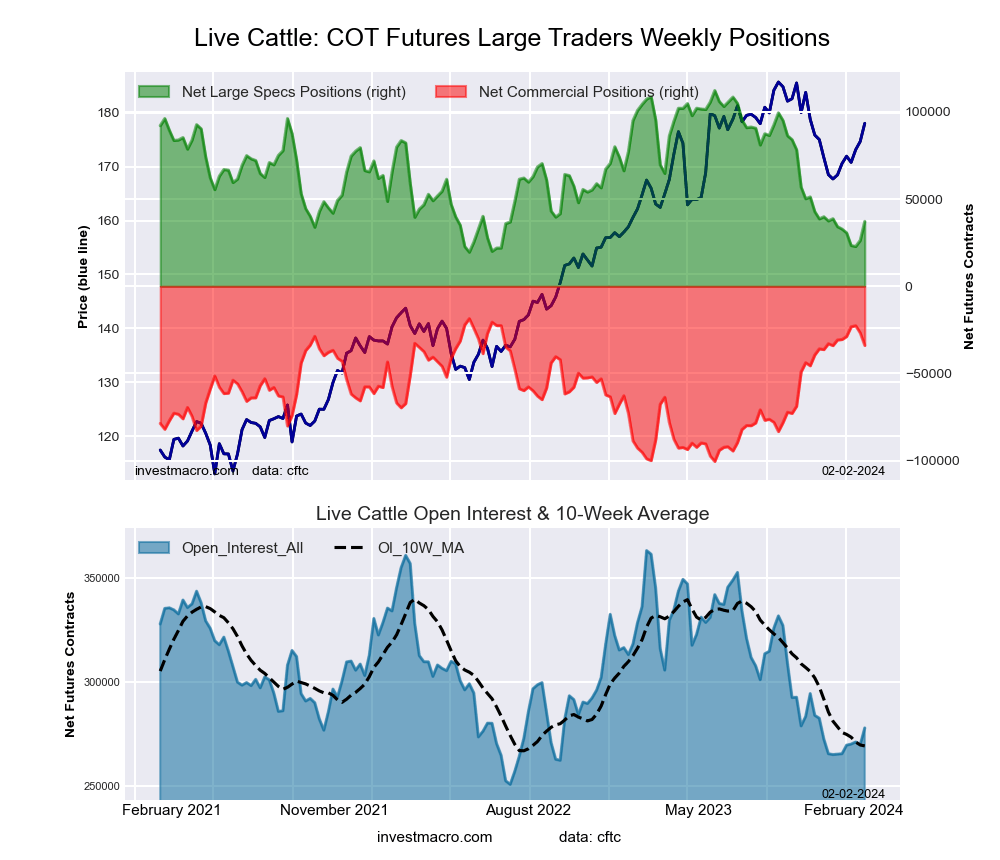 The LIVE CATTLE large speculator standing this week was a net position of 37,214 contracts in the data reported through Tuesday. This was a weekly gain of 10,882 contracts from the previous week which had a total of 26,332 net contracts.
This week’s current strength score (the trader positioning range over the past three years, measured from 0 to 100) shows the speculators are currently Bearish-Extreme with a score of 19.1 percent. The commercials are Bullish-Extreme with a score of 81.2 percent and the small traders (not shown in chart) are Bullish with a score of 72.3 percent.
Price Trend-Following Model: Weak Downtrend
Our weekly trend-following model classifies the current market price position as: Weak Downtrend. The current action for the model is considered to be: Hold – Maintain Short Position.
| LIVE CATTLE Futures Statistics | SPECULATORS | COMMERCIALS | SMALL TRADERS |
| – Percent of Open Interest Longs: | 30.4 | 38.8 | 11.2 |
| – Percent of Open Interest Shorts: | 17.0 | 51.0 | 12.4 |
| – Net Position: | 37,214 | -33,950 | -3,264 |
| – Gross Longs: | 84,392 | 107,858 | 31,065 |
| – Gross Shorts: | 47,178 | 141,808 | 34,329 |
| – Long to Short Ratio: | 1.8 to 1 | 0.8 to 1 | 0.9 to 1 |
| NET POSITION TREND: | |||
| – Strength Index Score (3 Year Range Pct): | 19.1 | 81.2 | 72.3 |
| – Strength Index Reading (3 Year Range): | Bearish-Extreme | Bullish-Extreme | Bullish |
| NET POSITION MOVEMENT INDEX: | |||
| – 6-Week Change in Strength Index: | 3.3 | -3.8 | 0.5 |
LEAN HOGS Futures:
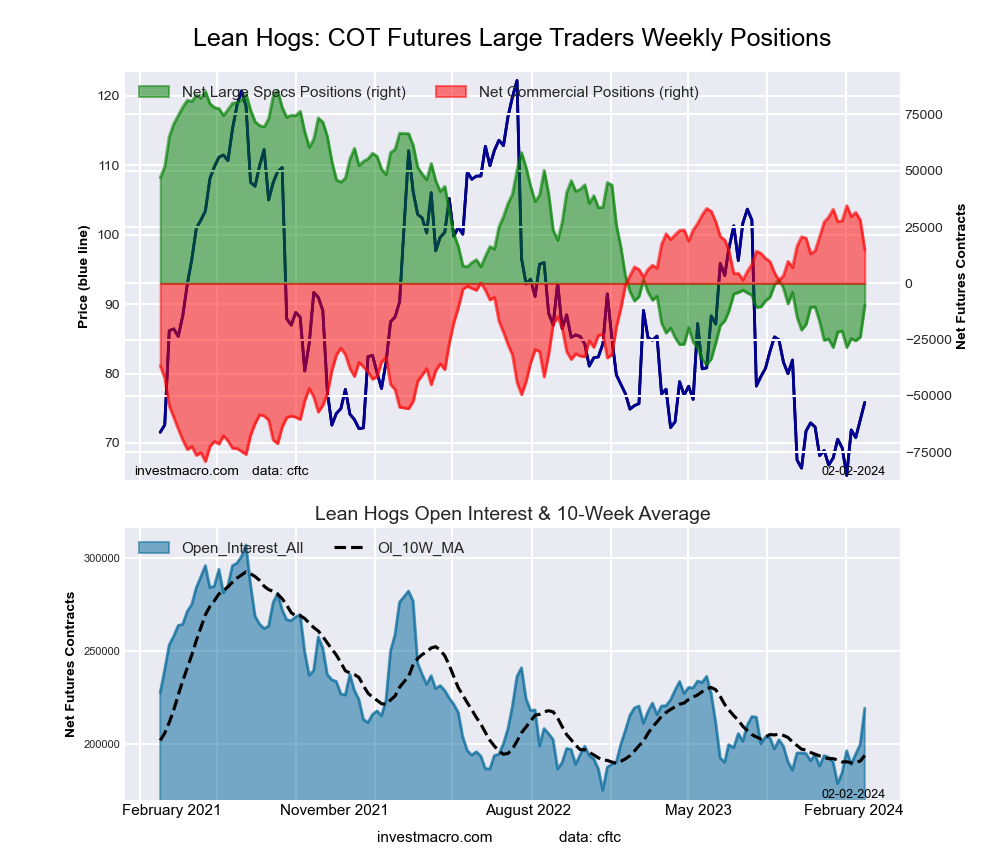 The LEAN HOGS large speculator standing this week was a net position of -9,794 contracts in the data reported through Tuesday. This was a weekly increase of 14,068 contracts from the previous week which had a total of -23,862 net contracts.
This week’s current strength score (the trader positioning range over the past three years, measured from 0 to 100) shows the speculators are currently Bearish with a score of 21.6 percent. The commercials are Bullish-Extreme with a score of 82.7 percent and the small traders (not shown in chart) are Bullish with a score of 60.9 percent.
Price Trend-Following Model: Weak Downtrend
Our weekly trend-following model classifies the current market price position as: Weak Downtrend. The current action for the model is considered to be: Hold – Maintain Short Position.
| LEAN HOGS Futures Statistics | SPECULATORS | COMMERCIALS | SMALL TRADERS |
| – Percent of Open Interest Longs: | 33.4 | 38.8 | 8.5 |
| – Percent of Open Interest Shorts: | 37.8 | 32.0 | 10.8 |
| – Net Position: | -9,794 | 14,796 | -5,002 |
| – Gross Longs: | 73,083 | 84,878 | 18,722 |
| – Gross Shorts: | 82,877 | 70,082 | 23,724 |
| – Long to Short Ratio: | 0.9 to 1 | 1.2 to 1 | 0.8 to 1 |
| NET POSITION TREND: | |||
| – Strength Index Score (3 Year Range Pct): | 21.6 | 82.7 | 60.9 |
| – Strength Index Reading (3 Year Range): | Bearish | Bullish-Extreme | Bullish |
| NET POSITION MOVEMENT INDEX: | |||
| – 6-Week Change in Strength Index: | 9.7 | -11.0 | 3.4 |
COTTON Futures:
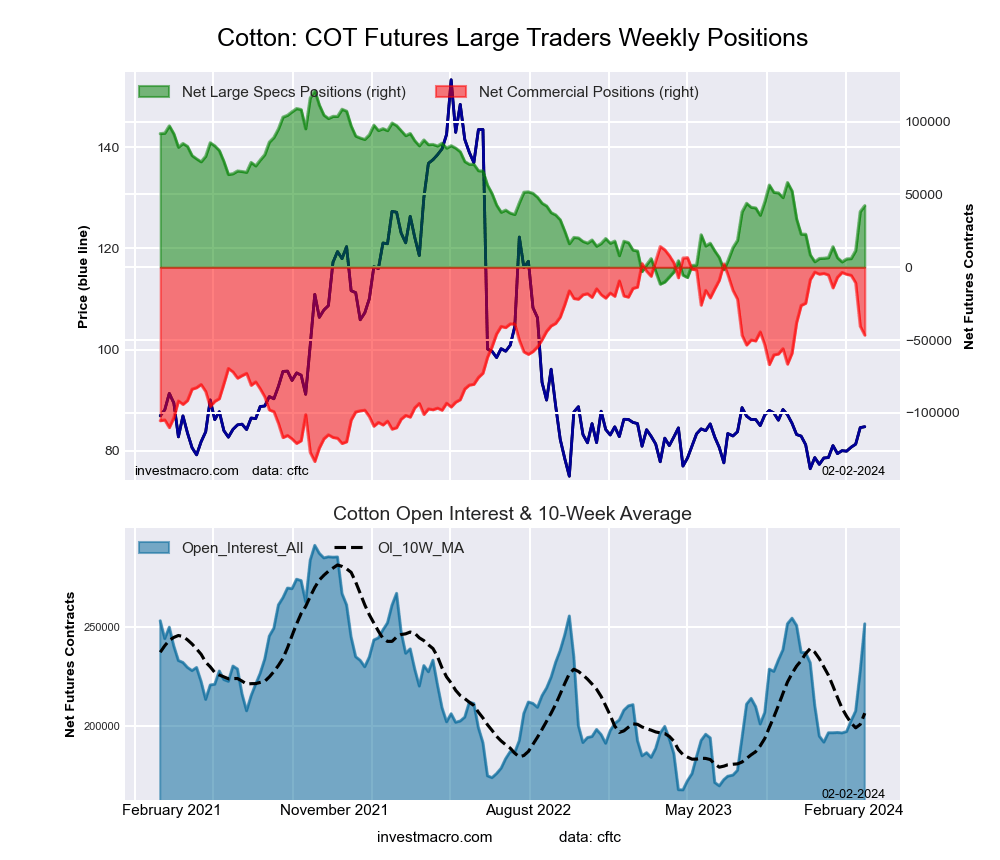 The COTTON large speculator standing this week was a net position of 42,278 contracts in the data reported through Tuesday. This was a weekly advance of 4,112 contracts from the previous week which had a total of 38,166 net contracts.
This week’s current strength score (the trader positioning range over the past three years, measured from 0 to 100) shows the speculators are currently Bearish with a score of 40.5 percent. The commercials are Bullish with a score of 58.8 percent and the small traders (not shown in chart) are Bearish with a score of 42.1 percent.
Price Trend-Following Model: Weak Downtrend
Our weekly trend-following model classifies the current market price position as: Weak Downtrend. The current action for the model is considered to be: Hold – Maintain Short Position.
| COTTON Futures Statistics | SPECULATORS | COMMERCIALS | SMALL TRADERS |
| – Percent of Open Interest Longs: | 28.8 | 45.6 | 6.4 |
| – Percent of Open Interest Shorts: | 12.0 | 64.1 | 4.7 |
| – Net Position: | 42,278 | -46,586 | 4,308 |
| – Gross Longs: | 72,535 | 114,657 | 16,124 |
| – Gross Shorts: | 30,257 | 161,243 | 11,816 |
| – Long to Short Ratio: | 2.4 to 1 | 0.7 to 1 | 1.4 to 1 |
| NET POSITION TREND: | |||
| – Strength Index Score (3 Year Range Pct): | 40.5 | 58.8 | 42.1 |
| – Strength Index Reading (3 Year Range): | Bearish | Bullish | Bearish |
| NET POSITION MOVEMENT INDEX: | |||
| – 6-Week Change in Strength Index: | 26.9 | -26.9 | 24.0 |
COCOA Futures:
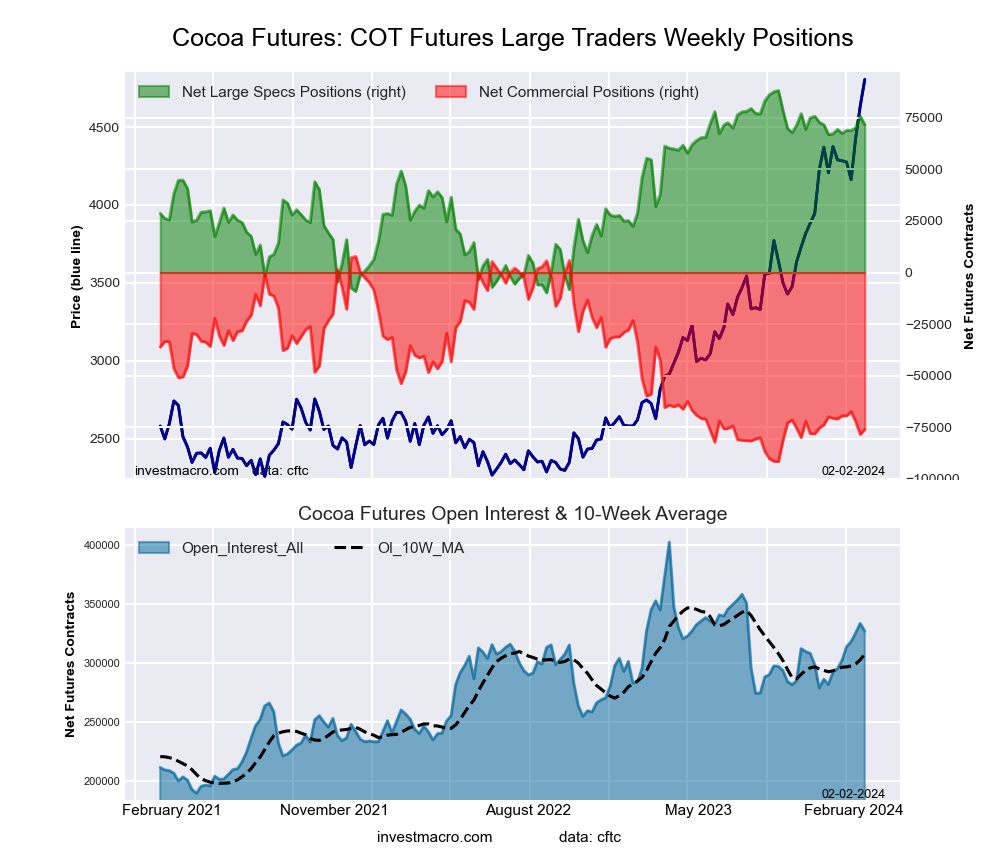 The COCOA large speculator standing this week was a net position of 71,694 contracts in the data reported through Tuesday. This was a weekly fall of -4,062 contracts from the previous week which had a total of 75,756 net contracts.
This week’s current strength score (the trader positioning range over the past three years, measured from 0 to 100) shows the speculators are currently Bullish-Extreme with a score of 83.1 percent. The commercials are Bearish-Extreme with a score of 15.7 percent and the small traders (not shown in chart) are Bearish with a score of 48.9 percent.
Price Trend-Following Model: Strong Uptrend
Our weekly trend-following model classifies the current market price position as: Strong Uptrend. The current action for the model is considered to be: Hold – Maintain Long Position.
| COCOA Futures Statistics | SPECULATORS | COMMERCIALS | SMALL TRADERS |
| – Percent of Open Interest Longs: | 38.7 | 26.0 | 5.4 |
| – Percent of Open Interest Shorts: | 16.8 | 49.2 | 4.1 |
| – Net Position: | 71,694 | -76,000 | 4,306 |
| – Gross Longs: | 126,534 | 84,962 | 17,615 |
| – Gross Shorts: | 54,840 | 160,962 | 13,309 |
| – Long to Short Ratio: | 2.3 to 1 | 0.5 to 1 | 1.3 to 1 |
| NET POSITION TREND: | |||
| – Strength Index Score (3 Year Range Pct): | 83.1 | 15.7 | 48.9 |
| – Strength Index Reading (3 Year Range): | Bullish-Extreme | Bearish-Extreme | Bearish |
| NET POSITION MOVEMENT INDEX: | |||
| – 6-Week Change in Strength Index: | 2.3 | -5.1 | 23.6 |
WHEAT Futures:
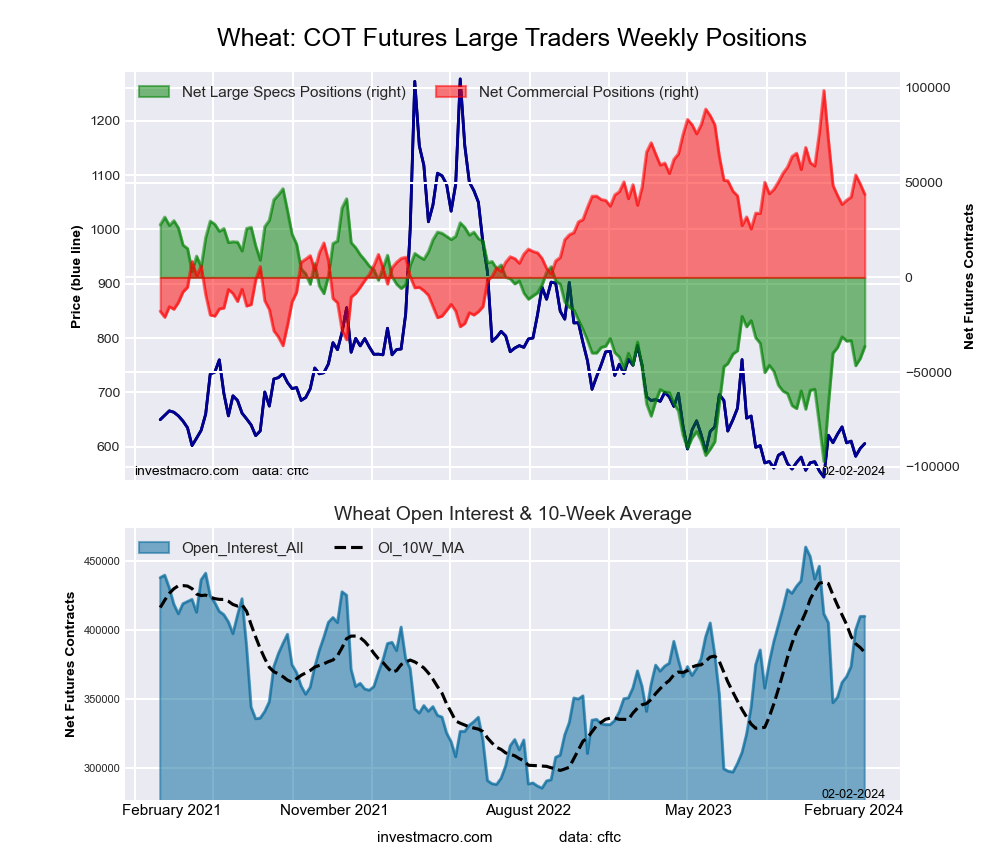 The WHEAT large speculator standing this week was a net position of -36,455 contracts in the data reported through Tuesday. This was a weekly gain of 6,327 contracts from the previous week which had a total of -42,782 net contracts.
This week’s current strength score (the trader positioning range over the past three years, measured from 0 to 100) shows the speculators are currently Bearish with a score of 42.2 percent. The commercials are Bullish with a score of 59.3 percent and the small traders (not shown in chart) are Bearish with a score of 34.0 percent.
Price Trend-Following Model: Uptrend
Our weekly trend-following model classifies the current market price position as: Uptrend. The current action for the model is considered to be: Hold – Maintain Long Position.
| WHEAT Futures Statistics | SPECULATORS | COMMERCIALS | SMALL TRADERS |
| – Percent of Open Interest Longs: | 28.8 | 36.5 | 7.5 |
| – Percent of Open Interest Shorts: | 37.7 | 25.8 | 9.3 |
| – Net Position: | -36,455 | 43,840 | -7,385 |
| – Gross Longs: | 118,028 | 149,787 | 30,571 |
| – Gross Shorts: | 154,483 | 105,947 | 37,956 |
| – Long to Short Ratio: | 0.8 to 1 | 1.4 to 1 | 0.8 to 1 |
| NET POSITION TREND: | |||
| – Strength Index Score (3 Year Range Pct): | 42.2 | 59.3 | 34.0 |
| – Strength Index Reading (3 Year Range): | Bearish | Bullish | Bearish |
| NET POSITION MOVEMENT INDEX: | |||
| – 6-Week Change in Strength Index: | 0.4 | 0.4 | -4.9 |
Article By InvestMacro – Receive our weekly COT Newsletter
*COT Report: The COT data, released weekly to the public each Friday, is updated through the most recent Tuesday (data is 3 days old) and shows a quick view of how large speculators or non-commercials (for-profit traders) were positioned in the futures markets.
The CFTC categorizes trader positions according to commercial hedgers (traders who use futures contracts for hedging as part of the business), non-commercials (large traders who speculate to realize trading profits) and nonreportable traders (usually small traders/speculators) as well as their open interest (contracts open in the market at time of reporting). See CFTC criteria here.

- COT Metals Charts: Weekly Speculator Bets led by Copper & Steel Jul 18, 2026
- COT Bonds Charts: Weekly Speculator Bets led by 2-Year, SOFR 3M & 5-Year Bonds Jul 18, 2026
- COT Energy Charts: Weekly Speculator Bets led by Brent Oil & Heating Oil Jul 18, 2026
- COT Soft Commodities Charts: Weekly Speculator Bets led by Wheat, Corn & Soybean Meal Jul 18, 2026
- The Bank of Canada kept its interest rate unchanged. Platinum prices reached a three‑week high Jul 16, 2026
- Stock indices rose after the release of US inflation data. China’s GDP slowed sharply Jul 15, 2026
- GBP/USD Awaits Political News: What Will Happen Next Jul 15, 2026
- USD/JPY Holds at Highs: Pressure Lingers on Yen Jul 14, 2026
- Oil prices jumped 4% amid a new wave of escalation between the US and Iran Jul 13, 2026
- EUR/USD: US Inflation Will Determine Everything Jul 13, 2026