
By InvestMacro
Here are the latest charts and statistics for the Commitment of Traders (COT) data published by the Commodities Futures Trading Commission (CFTC).
The latest COT data is updated through Tuesday February 13th and shows a quick view of how large traders (for-profit speculators and commercial entities) were positioned in the futures markets.
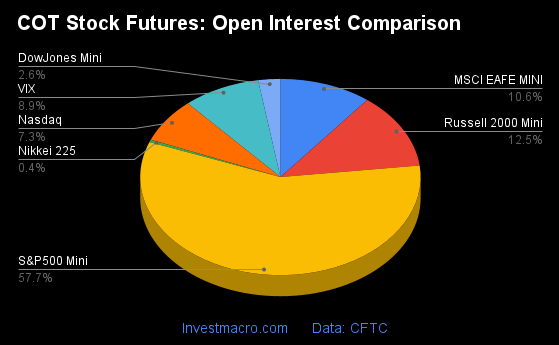
Weekly Speculator Changes led by S&P500-Mini & MSCI EAFE-Mini
The COT stock markets speculator bets were lower this week as three out of the seven stock markets we cover had higher positioning while the other five markets had lower speculator contracts.
Free Reports:
 Get our Weekly Commitment of Traders Reports - See where the biggest traders (Hedge Funds and Commercial Hedgers) are positioned in the futures markets on a weekly basis.
 Sign Up for Our Stock Market Newsletter – Get updated on News, Charts & Rankings of Public Companies when you join our Stocks Newsletter
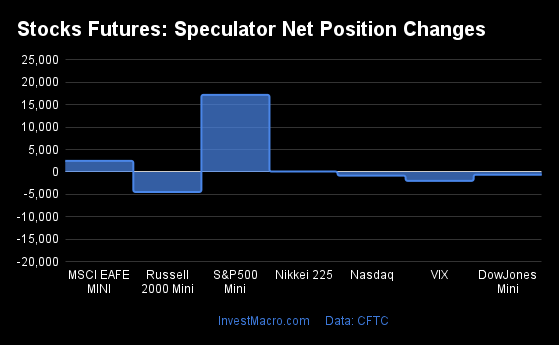
Leading the gains for the stock markets was the S&P500-Mini (17,184 contracts) with the MSCI EAFE-Mini (2,480 contracts) and the Nikkei 225 (92 contracts) also showing positive weeks.
The markets with the declines in speculator bets this week were the Russell-Mini (-4,458 contracts), the VIX (-1,979 contracts), the DowJones-Mini (-616 contracts) and the Nasdaq-Mini (-812 contracts) also registering lower bets on the week.
Speculators Leaderboard
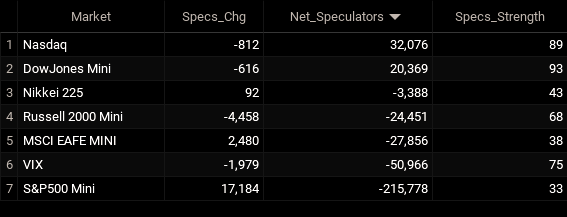
Legend: Weekly Speculators Change | Speculators Current Net Position | Speculators Strength Score compared to last 3-Years (0-100 range)
Strength Scores led by DowJones-Mini & Nasdaq-Mini
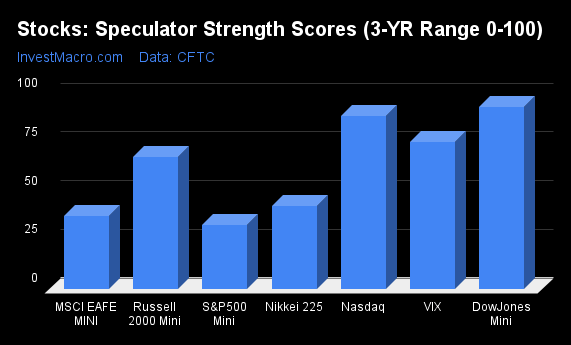
COT Strength Scores (a normalized measure of Speculator positions over a 3-Year range, from 0 to 100 where above 80 is Extreme-Bullish and below 20 is Extreme-Bearish) showed that the DowJones-Mini (93 percent) and the Nasdaq-Mini (89 percent) lead the stock markets this week. The VIX (75 percent) and Russell-Mini (68 percent) come in as the next highest in the weekly strength scores.
On the downside, the S&P500-Mini (33 percent) comes in at the lowest strength level currently with the next lowest strength score being the MSCI EAFE-Mini (38 percent).
Strength Statistics:
VIX (75.2 percent) vs VIX previous week (76.5 percent)
S&P500-Mini (32.6 percent) vs S&P500-Mini previous week (30.0 percent)
DowJones-Mini (93.4 percent) vs DowJones-Mini previous week (94.4 percent)
Nasdaq-Mini (88.9 percent) vs Nasdaq-Mini previous week (90.1 percent)
Russell2000-Mini (67.7 percent) vs Russell2000-Mini previous week (70.9 percent)
Nikkei USD (42.5 percent) vs Nikkei USD previous week (41.9 percent)
EAFE-Mini (37.6 percent) vs EAFE-Mini previous week (35.0 percent)
MSCI EAFE-Mini & DowJones-Mini top the 6-Week Strength Trends
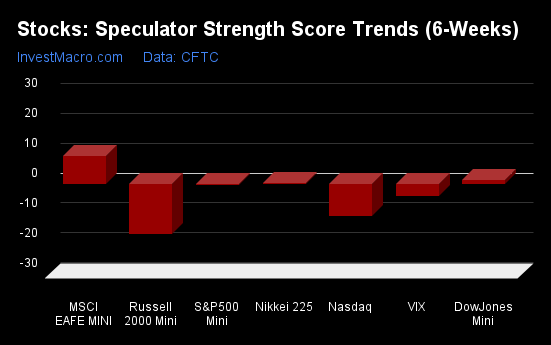
COT Strength Score Trends (or move index, calculates the 6-week changes in strength scores) showed that the MSCI EAFE-Mini (9 percent) leads the past six weeks trends for the stock markets.
The Russell-Mini (-17 percent) leads the downside trend scores currently with the Nasdaq-Mini (-11 percent) coming in as the next market with lower trend scores.
Strength Trend Statistics:
VIX (-4.0 percent) vs VIX previous week (4.8 percent)
S&P500-Mini (-0.3 percent) vs S&P500-Mini previous week (-6.0 percent)
DowJones-Mini (1.3 percent) vs DowJones-Mini previous week (16.0 percent)
Nasdaq-Mini (-10.8 percent) vs Nasdaq-Mini previous week (7.6 percent)
Russell2000-Mini (-16.7 percent) vs Russell2000-Mini previous week (-5.4 percent)
Nikkei USD (0.2 percent) vs Nikkei USD previous week (-4.6 percent)
EAFE-Mini (9.2 percent) vs EAFE-Mini previous week (12.5 percent)
Individual Stock Market Charts:
VIX Volatility Futures:
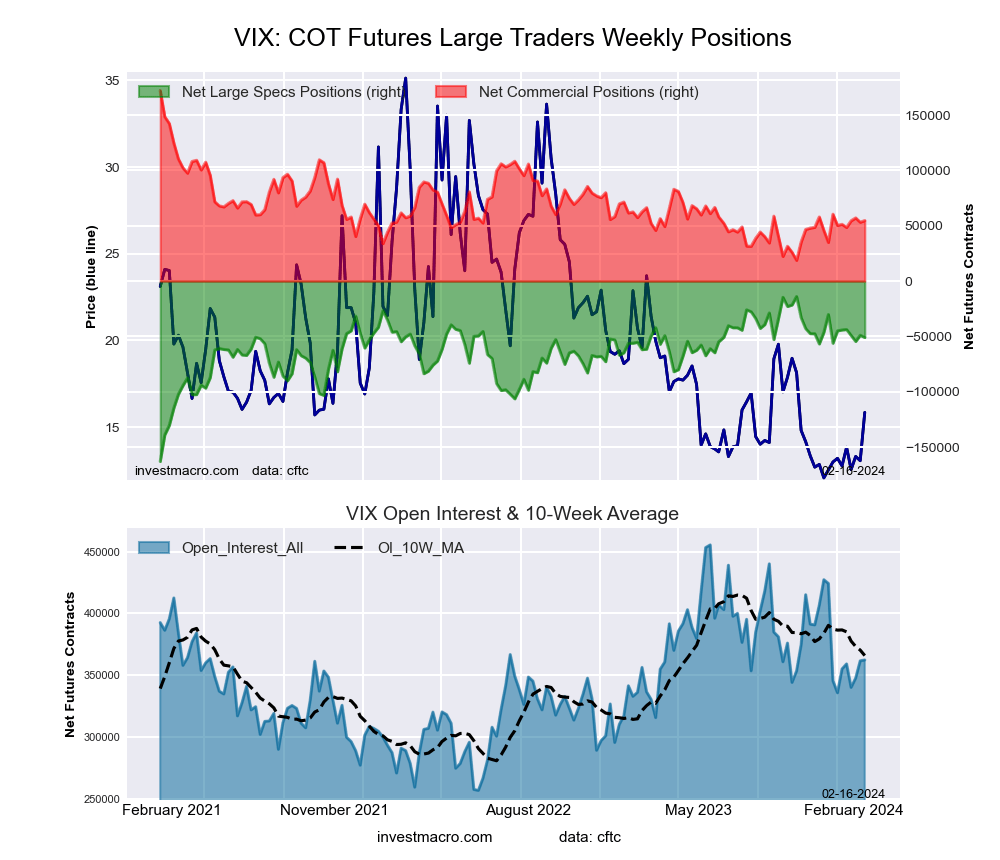 The VIX Volatility large speculator standing this week came in at a net position of -50,966 contracts in the data reported through Tuesday. This was a weekly lowering of -1,979 contracts from the previous week which had a total of -48,987 net contracts.
This week’s current strength score (the trader positioning range over the past three years, measured from 0 to 100) shows the speculators are currently Bullish with a score of 75.2 percent. The commercials are Bearish with a score of 23.4 percent and the small traders (not shown in chart) are Bullish with a score of 77.5 percent.
Price Trend-Following Model: Downtrend
Our weekly trend-following model classifies the current market price position as: Downtrend. The current action for the model is considered to be: Hold – Maintain Short Position.
| VIX Volatility Futures Statistics | SPECULATORS | COMMERCIALS | SMALL TRADERS |
| – Percent of Open Interest Longs: | 21.1 | 46.2 | 7.3 |
| – Percent of Open Interest Shorts: | 35.2 | 31.1 | 8.3 |
| – Net Position: | -50,966 | 54,671 | -3,705 |
| – Gross Longs: | 76,506 | 167,381 | 26,308 |
| – Gross Shorts: | 127,472 | 112,710 | 30,013 |
| – Long to Short Ratio: | 0.6 to 1 | 1.5 to 1 | 0.9 to 1 |
| NET POSITION TREND: | |||
| – Strength Index Score (3 Year Range Pct): | 75.2 | 23.4 | 77.5 |
| – Strength Index Reading (3 Year Range): | Bullish | Bearish | Bullish |
| NET POSITION MOVEMENT INDEX: | |||
| – 6-Week Change in Strength Index: | -4.0 | 2.9 | 8.0 |
S&P500 Mini Futures:
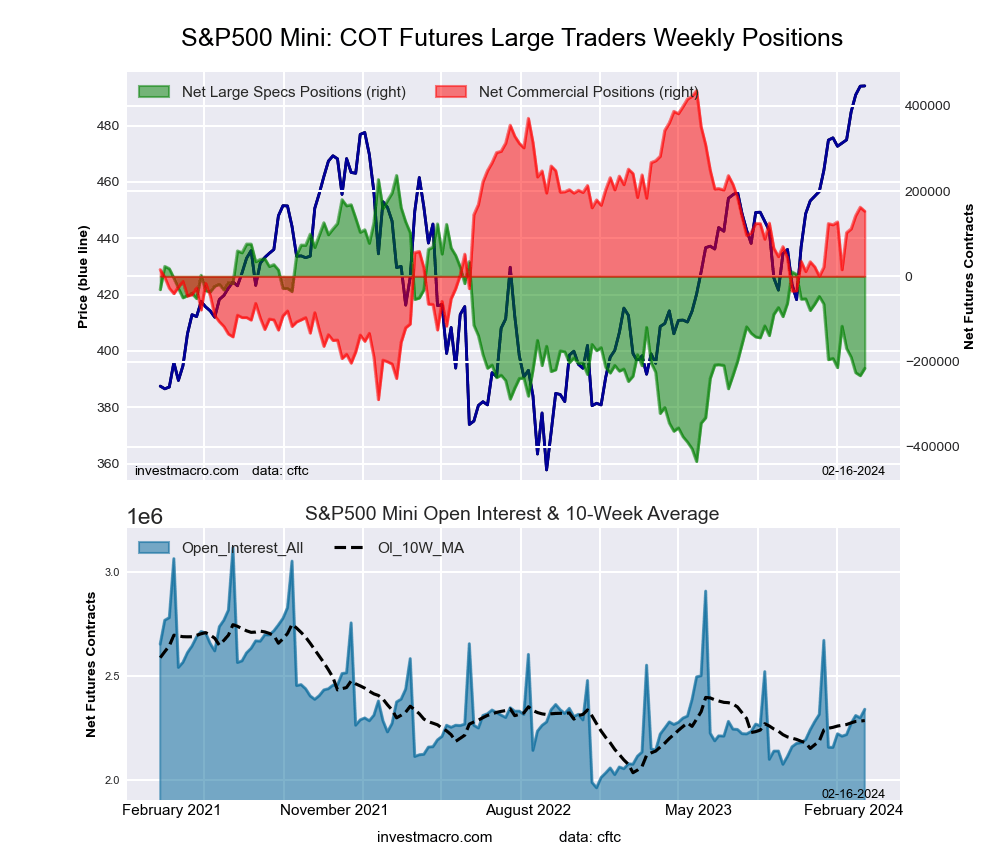 The S&P500 Mini large speculator standing this week came in at a net position of -215,778 contracts in the data reported through Tuesday. This was a weekly lift of 17,184 contracts from the previous week which had a total of -232,962 net contracts.
This week’s current strength score (the trader positioning range over the past three years, measured from 0 to 100) shows the speculators are currently Bearish with a score of 32.6 percent. The commercials are Bullish with a score of 60.9 percent and the small traders (not shown in chart) are Bullish with a score of 62.3 percent.
Price Trend-Following Model: Uptrend
Our weekly trend-following model classifies the current market price position as: Uptrend. The current action for the model is considered to be: Hold – Maintain Long Position.
| S&P500 Mini Futures Statistics | SPECULATORS | COMMERCIALS | SMALL TRADERS |
| – Percent of Open Interest Longs: | 12.5 | 74.3 | 10.9 |
| – Percent of Open Interest Shorts: | 21.7 | 67.8 | 8.2 |
| – Net Position: | -215,778 | 152,512 | 63,266 |
| – Gross Longs: | 292,466 | 1,738,023 | 254,739 |
| – Gross Shorts: | 508,244 | 1,585,511 | 191,473 |
| – Long to Short Ratio: | 0.6 to 1 | 1.1 to 1 | 1.3 to 1 |
| NET POSITION TREND: | |||
| – Strength Index Score (3 Year Range Pct): | 32.6 | 60.9 | 62.3 |
| – Strength Index Reading (3 Year Range): | Bearish | Bullish | Bullish |
| NET POSITION MOVEMENT INDEX: | |||
| – 6-Week Change in Strength Index: | -0.3 | 3.5 | -9.3 |
Dow Jones Mini Futures:
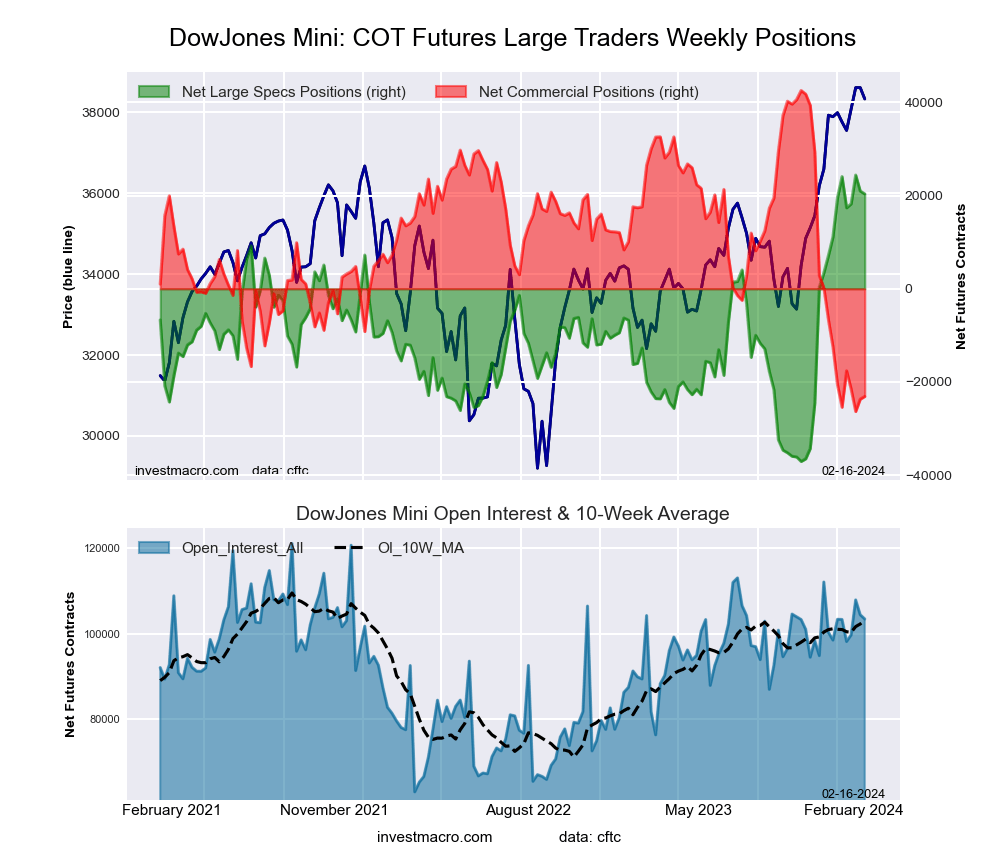 The Dow Jones Mini large speculator standing this week came in at a net position of 20,369 contracts in the data reported through Tuesday. This was a weekly decrease of -616 contracts from the previous week which had a total of 20,985 net contracts.
This week’s current strength score (the trader positioning range over the past three years, measured from 0 to 100) shows the speculators are currently Bullish-Extreme with a score of 93.4 percent. The commercials are Bearish-Extreme with a score of 4.7 percent and the small traders (not shown in chart) are Bullish with a score of 57.3 percent.
Price Trend-Following Model: Uptrend
Our weekly trend-following model classifies the current market price position as: Uptrend. The current action for the model is considered to be: Hold – Maintain Long Position.
| Dow Jones Mini Futures Statistics | SPECULATORS | COMMERCIALS | SMALL TRADERS |
| – Percent of Open Interest Longs: | 31.6 | 51.1 | 15.3 |
| – Percent of Open Interest Shorts: | 11.9 | 73.4 | 12.7 |
| – Net Position: | 20,369 | -23,116 | 2,747 |
| – Gross Longs: | 32,665 | 52,815 | 15,867 |
| – Gross Shorts: | 12,296 | 75,931 | 13,120 |
| – Long to Short Ratio: | 2.7 to 1 | 0.7 to 1 | 1.2 to 1 |
| NET POSITION TREND: | |||
| – Strength Index Score (3 Year Range Pct): | 93.4 | 4.7 | 57.3 |
| – Strength Index Reading (3 Year Range): | Bullish-Extreme | Bearish-Extreme | Bullish |
| NET POSITION MOVEMENT INDEX: | |||
| – 6-Week Change in Strength Index: | 1.3 | -3.7 | 8.3 |
Nasdaq Mini Futures:
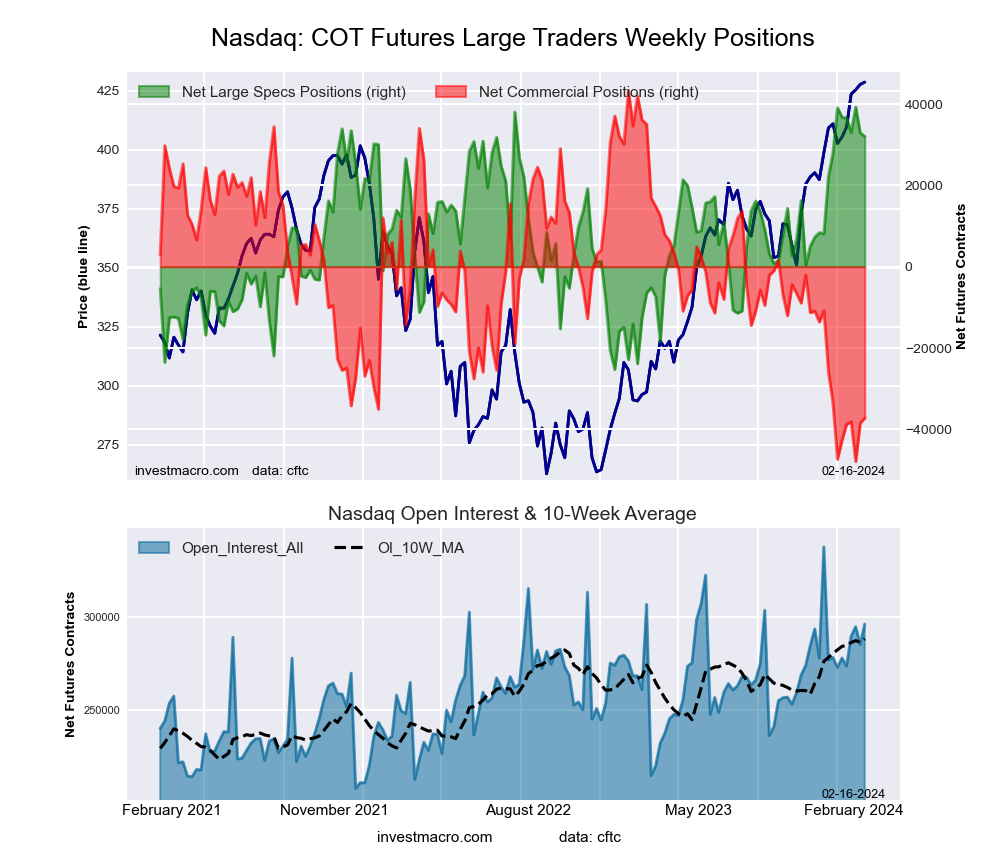 The Nasdaq Mini large speculator standing this week came in at a net position of 32,076 contracts in the data reported through Tuesday. This was a weekly decline of -812 contracts from the previous week which had a total of 32,888 net contracts.
This week’s current strength score (the trader positioning range over the past three years, measured from 0 to 100) shows the speculators are currently Bullish-Extreme with a score of 88.9 percent. The commercials are Bearish-Extreme with a score of 11.7 percent and the small traders (not shown in chart) are Bullish-Extreme with a score of 90.6 percent.
Price Trend-Following Model: Uptrend
Our weekly trend-following model classifies the current market price position as: Uptrend. The current action for the model is considered to be: Hold – Maintain Long Position.
| Nasdaq Mini Futures Statistics | SPECULATORS | COMMERCIALS | SMALL TRADERS |
| – Percent of Open Interest Longs: | 32.9 | 52.4 | 13.8 |
| – Percent of Open Interest Shorts: | 22.0 | 65.0 | 12.1 |
| – Net Position: | 32,076 | -37,213 | 5,137 |
| – Gross Longs: | 97,292 | 155,161 | 40,984 |
| – Gross Shorts: | 65,216 | 192,374 | 35,847 |
| – Long to Short Ratio: | 1.5 to 1 | 0.8 to 1 | 1.1 to 1 |
| NET POSITION TREND: | |||
| – Strength Index Score (3 Year Range Pct): | 88.9 | 11.7 | 90.6 |
| – Strength Index Reading (3 Year Range): | Bullish-Extreme | Bearish-Extreme | Bullish-Extreme |
| NET POSITION MOVEMENT INDEX: | |||
| – 6-Week Change in Strength Index: | -10.8 | 11.1 | -8.4 |
Russell 2000 Mini Futures:
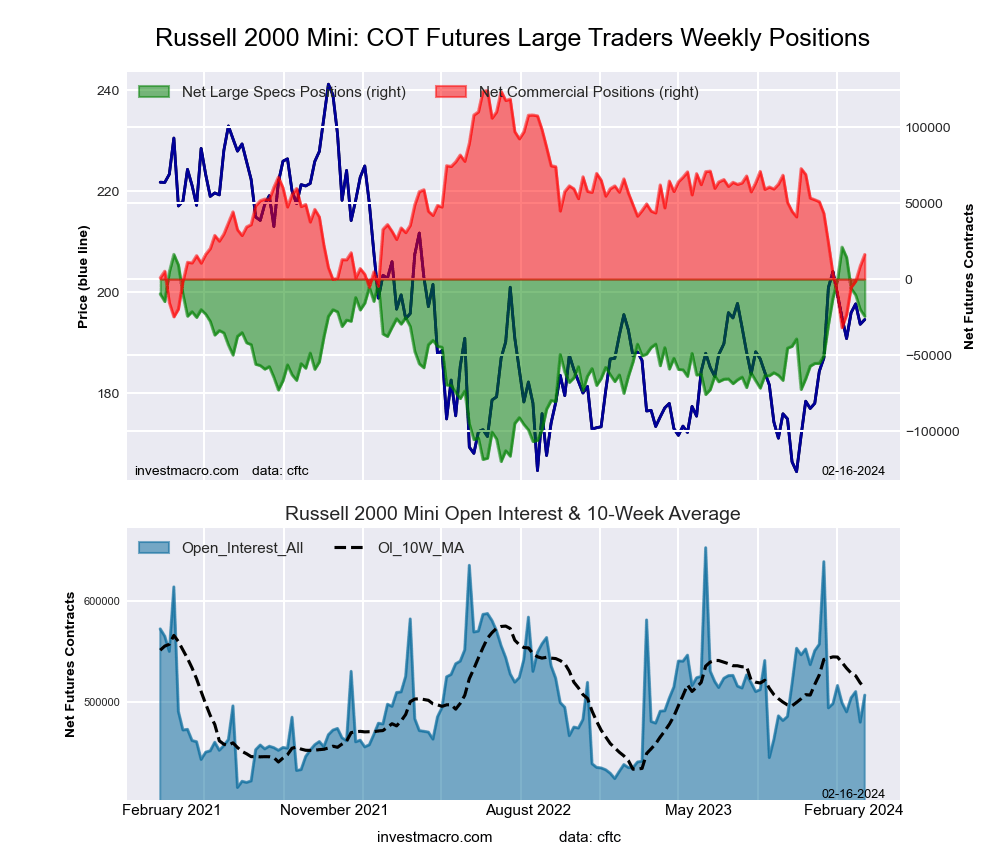 The Russell 2000 Mini large speculator standing this week came in at a net position of -24,451 contracts in the data reported through Tuesday. This was a weekly lowering of -4,458 contracts from the previous week which had a total of -19,993 net contracts.
This week’s current strength score (the trader positioning range over the past three years, measured from 0 to 100) shows the speculators are currently Bullish with a score of 67.7 percent. The commercials are Bearish with a score of 30.9 percent and the small traders (not shown in chart) are Bullish with a score of 56.9 percent.
Price Trend-Following Model: Uptrend
Our weekly trend-following model classifies the current market price position as: Uptrend. The current action for the model is considered to be: Hold – Maintain Long Position.
| Russell 2000 Mini Futures Statistics | SPECULATORS | COMMERCIALS | SMALL TRADERS |
| – Percent of Open Interest Longs: | 12.0 | 80.1 | 6.5 |
| – Percent of Open Interest Shorts: | 16.8 | 76.9 | 4.8 |
| – Net Position: | -24,451 | 16,168 | 8,283 |
| – Gross Longs: | 60,783 | 405,971 | 32,713 |
| – Gross Shorts: | 85,234 | 389,803 | 24,430 |
| – Long to Short Ratio: | 0.7 to 1 | 1.0 to 1 | 1.3 to 1 |
| NET POSITION TREND: | |||
| – Strength Index Score (3 Year Range Pct): | 67.7 | 30.9 | 56.9 |
| – Strength Index Reading (3 Year Range): | Bullish | Bearish | Bullish |
| NET POSITION MOVEMENT INDEX: | |||
| – 6-Week Change in Strength Index: | -16.7 | 16.8 | -9.2 |
Nikkei Stock Average (USD) Futures:
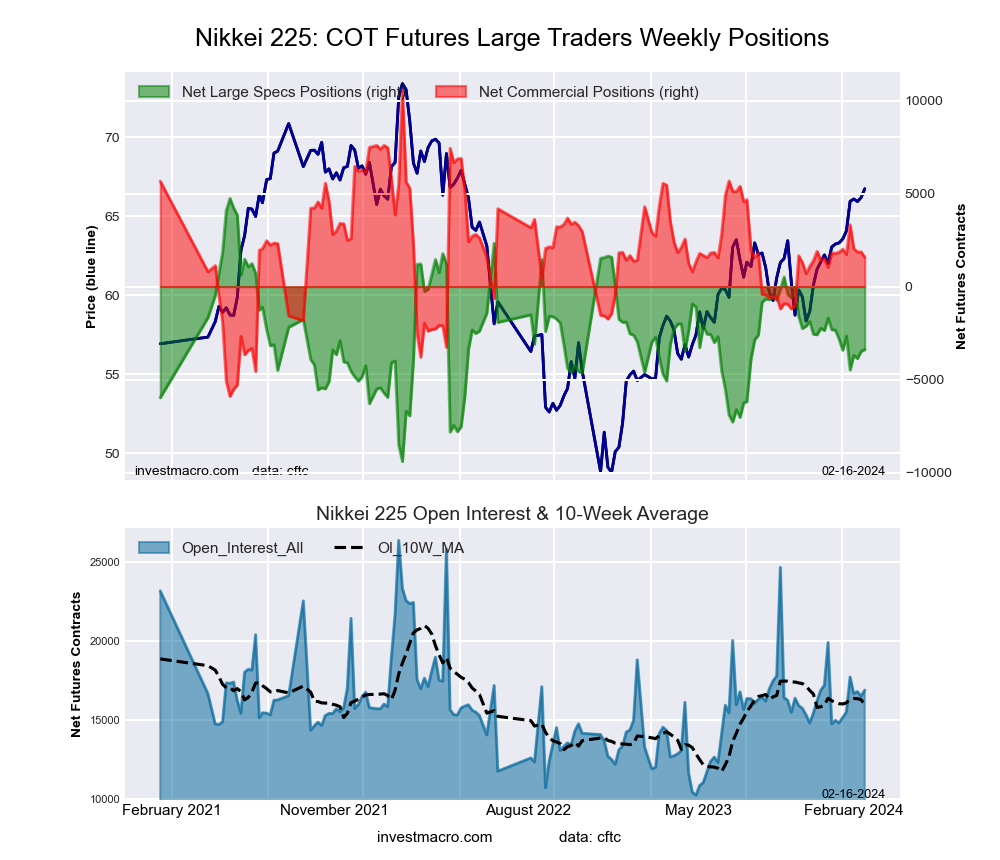 The Nikkei Stock Average (USD) large speculator standing this week came in at a net position of -3,388 contracts in the data reported through Tuesday. This was a weekly increase of 92 contracts from the previous week which had a total of -3,480 net contracts.
This week’s current strength score (the trader positioning range over the past three years, measured from 0 to 100) shows the speculators are currently Bearish with a score of 42.5 percent. The commercials are Bearish with a score of 45.5 percent and the small traders (not shown in chart) are Bullish with a score of 66.6 percent.
Price Trend-Following Model: Strong Uptrend
Our weekly trend-following model classifies the current market price position as: Strong Uptrend. The current action for the model is considered to be: Hold – Maintain Long Position.
| Nikkei Stock Average Futures Statistics | SPECULATORS | COMMERCIALS | SMALL TRADERS |
| – Percent of Open Interest Longs: | 10.8 | 64.2 | 25.0 |
| – Percent of Open Interest Shorts: | 30.9 | 54.9 | 14.3 |
| – Net Position: | -3,388 | 1,576 | 1,812 |
| – Gross Longs: | 1,829 | 10,843 | 4,222 |
| – Gross Shorts: | 5,217 | 9,267 | 2,410 |
| – Long to Short Ratio: | 0.4 to 1 | 1.2 to 1 | 1.8 to 1 |
| NET POSITION TREND: | |||
| – Strength Index Score (3 Year Range Pct): | 42.5 | 45.5 | 66.6 |
| – Strength Index Reading (3 Year Range): | Bearish | Bearish | Bullish |
| NET POSITION MOVEMENT INDEX: | |||
| – 6-Week Change in Strength Index: | 0.2 | -2.7 | 6.6 |
MSCI EAFE Mini Futures:
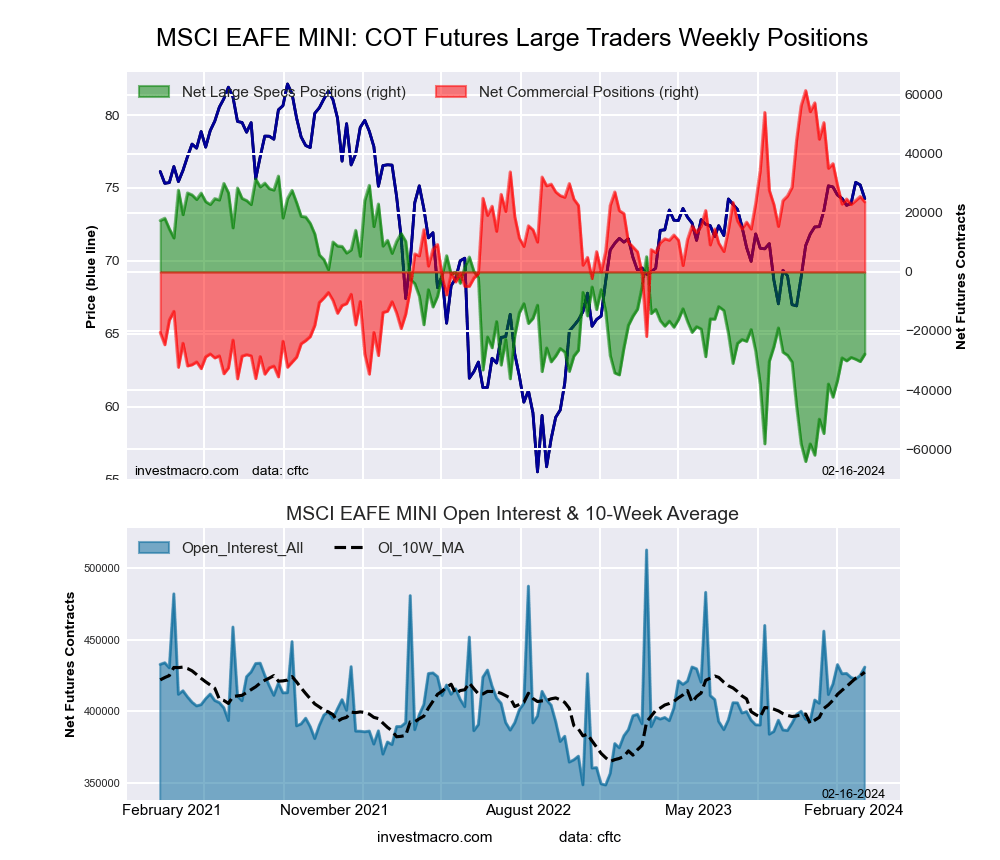 The MSCI EAFE Mini large speculator standing this week came in at a net position of -27,856 contracts in the data reported through Tuesday. This was a weekly boost of 2,480 contracts from the previous week which had a total of -30,336 net contracts.
This week’s current strength score (the trader positioning range over the past three years, measured from 0 to 100) shows the speculators are currently Bearish with a score of 37.6 percent. The commercials are Bullish with a score of 61.4 percent and the small traders (not shown in chart) are Bearish with a score of 37.7 percent.
Price Trend-Following Model: Uptrend
Our weekly trend-following model classifies the current market price position as: Uptrend. The current action for the model is considered to be: Hold – Maintain Long Position.
| MSCI EAFE Mini Futures Statistics | SPECULATORS | COMMERCIALS | SMALL TRADERS |
| – Percent of Open Interest Longs: | 7.9 | 88.8 | 3.2 |
| – Percent of Open Interest Shorts: | 14.3 | 83.3 | 2.2 |
| – Net Position: | -27,856 | 23,703 | 4,153 |
| – Gross Longs: | 33,926 | 382,513 | 13,677 |
| – Gross Shorts: | 61,782 | 358,810 | 9,524 |
| – Long to Short Ratio: | 0.5 to 1 | 1.1 to 1 | 1.4 to 1 |
| NET POSITION TREND: | |||
| – Strength Index Score (3 Year Range Pct): | 37.6 | 61.4 | 37.7 |
| – Strength Index Reading (3 Year Range): | Bearish | Bullish | Bearish |
| NET POSITION MOVEMENT INDEX: | |||
| – 6-Week Change in Strength Index: | 9.2 | -5.7 | -16.4 |
Article By InvestMacro – Receive our weekly COT Newsletter
*COT Report: The COT data, released weekly to the public each Friday, is updated through the most recent Tuesday (data is 3 days old) and shows a quick view of how large speculators or non-commercials (for-profit traders) were positioned in the futures markets.
The CFTC categorizes trader positions according to commercial hedgers (traders who use futures contracts for hedging as part of the business), non-commercials (large traders who speculate to realize trading profits) and nonreportable traders (usually small traders/speculators) as well as their open interest (contracts open in the market at time of reporting). See CFTC criteria here.

- Geopolitical and macroeconomic conditions continue to pressure market sentiment Jul 20, 2026
- USD/JPY Poised to Continue Gains as Expensive Oil and Lack of Support Weigh on Yen Jul 20, 2026
- COT Metals Charts: Weekly Speculator Bets led by Copper & Steel Jul 18, 2026
- COT Bonds Charts: Weekly Speculator Bets led by 2-Year, SOFR 3M & 5-Year Bonds Jul 18, 2026
- COT Energy Charts: Weekly Speculator Bets led by Brent Oil & Heating Oil Jul 18, 2026
- COT Soft Commodities Charts: Weekly Speculator Bets led by Wheat, Corn & Soybean Meal Jul 18, 2026
- The Bank of Canada kept its interest rate unchanged. Platinum prices reached a three‑week high Jul 16, 2026
- Stock indices rose after the release of US inflation data. China’s GDP slowed sharply Jul 15, 2026
- GBP/USD Awaits Political News: What Will Happen Next Jul 15, 2026
- USD/JPY Holds at Highs: Pressure Lingers on Yen Jul 14, 2026