By InvestMacro

Here are the latest charts and statistics for the Commitment of Traders (COT) data published by the Commodities Futures Trading Commission (CFTC).
The latest COT data is updated through Tuesday December 12th and shows a quick view of how large market participants (for-profit speculators and commercial traders) were positioned in the futures markets. All currency positions are in direct relation to the US dollar where, for example, a bet for the euro is a bet that the euro will rise versus the dollar while a bet against the euro will be a bet that the euro will decline versus the dollar.
Weekly Speculator Changes led by the Japanese Yen & British Pound
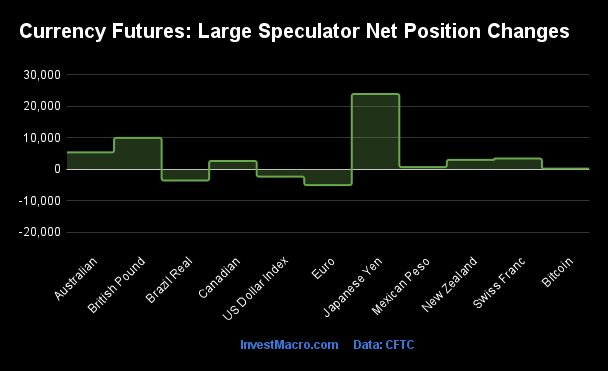
The COT currency market speculator bets were higher this week as eight out of the eleven currency markets we cover had higher positioning while the other three markets had lower speculator contracts.
Leading the gains for the currency markets was the Japanese Yen (23,825 contracts) with the British Pound (9,916 contracts), the Australian Dollar (5,341 contracts), the Swiss Franc (3,378 contracts), the New Zealand Dollar (2,962 contracts) and the Mexican Peso (669 contracts) Bitcoin (183 contracts) and the Canadian Dollar (2,603 contracts) also showing positive weeks.
The currencies seeing declines in speculator bets on the week were the EuroFX (-5,033 contracts), the Brazilian Real (-3,580 contracts) and the US Dollar Index (-2,343 contracts).
Japanese Yen Speculators reduce bearish bets to lowest since August
Highlighting the COT currency’s data this week was a sharp boost in sentiment for the Japanese yen speculators. Large speculative yen positions rose strongly this week by over +23,000 net contracts and gained for a second straight week as well as for the third time in four weeks. Over these past four weeks, the yen speculator bets now have improved by a total of +49,118 contracts.
This turn in sentiment has taken the overall bearish net positioning for speculators down to a current level of -81,131 contracts, marking the least bearish level since August.
The yen exchange rate continued to improve as well this week versus the US Dollar. The USDJPY currency pair fell for a fifth consecutive week this week (a lower USDJPY exchange rate means USD weakness and JPY strength) and closed at the 142.13 level. The USDJPY is off it’s most recent high in November by about 7 percent.
Helping the yen’s fortunes lately has been a general speculation that the Bank of Japan will look to end its negative interest rate policy sometime in the coming new year. Also, on the US Dollar side, this is combined with the US Federal Reserve’s dovish interest rate hold last week that has lent credence to the outlook that US interest rates will be on hold or even possibly be reduced over 2024.
| Dec-12-2023 | OI | OI-Index | Spec-Net | Spec-Index | Com-Net | COM-Index | Smalls-Net | Smalls-Index |
|---|
| USD Index | 41,345 | 38 | 17,601 | 54 | -18,032 | 47 | 431 | 15 |
| EUR | 792,149 | 84 | 147,327 | 83 | -182,357 | 21 | 35,030 | 35 |
| GBP | 243,677 | 63 | 21,581 | 71 | -20,101 | 34 | -1,480 | 55 |
| JPY | 257,581 | 80 | -81,131 | 27 | 79,527 | 74 | 1,604 | 57 |
| CHF | 65,186 | 100 | -14,474 | 17 | 19,313 | 75 | -4,839 | 44 |
| CAD | 213,873 | 71 | -55,245 | 13 | 61,193 | 90 | -5,948 | 10 |
| AUD | 208,927 | 64 | -52,340 | 41 | 54,868 | 58 | -2,528 | 46 |
| NZD | 58,308 | 77 | -13,488 | 20 | 13,109 | 75 | 379 | 54 |
| MXN | 269,074 | 62 | 74,125 | 84 | -79,064 | 14 | 4,939 | 43 |
| RUB | 20,930 | 4 | 7,543 | 31 | -7,150 | 69 | -393 | 24 |
| BRL | 68,646 | 54 | 46,664 | 95 | -48,955 | 5 | 2,291 | 56 |
| Bitcoin | 21,211 | 89 | -2,067 | 35 | 1,188 | 0 | 879 | 33 |
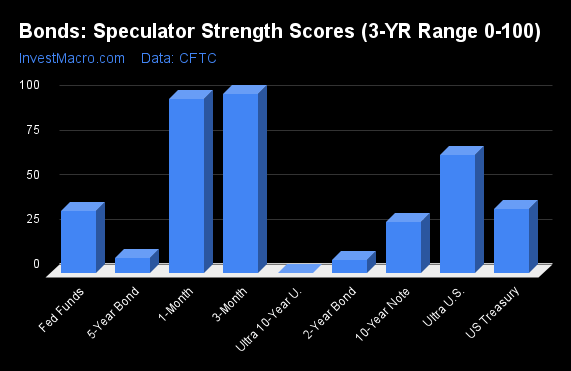
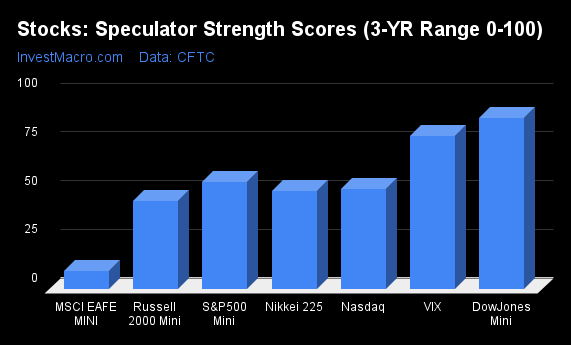
Strength Scores led by Brazilian Real & Mexican Peso
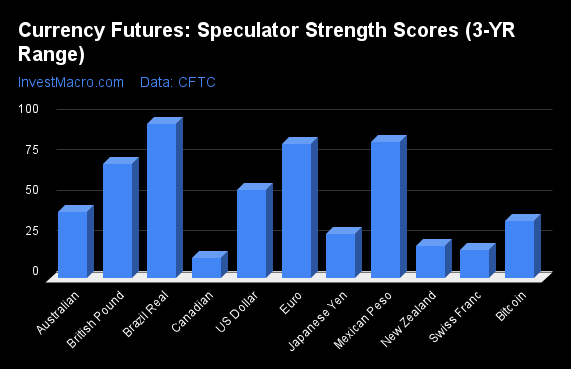
COT Strength Scores (a normalized measure of Speculator positions over a 3-Year range, from 0 to 100 where above 80 is Extreme-Bullish and below 20 is Extreme-Bearish) showed that the Brazilian Real (95 percent), the Mexican Peso (84 percent) and the EuroFX (83 percent) lead the currency markets this week.
On the downside, the Canadian Dollar (13 percent) and the Swiss Franc (17 percent) come in at the lowest strength levels currently and are in Extreme-Bearish territory (below 20 percent). The next lowest strength scores are the New Zealand Dollar (20 percent) and the Japanese Yen (27 percent).
Strength Statistics:
US Dollar Index (54.3 percent) vs US Dollar Index previous week (58.2 percent)
EuroFX (83.1 percent) vs EuroFX previous week (85.2 percent)
British Pound Sterling (70.8 percent) vs British Pound Sterling previous week (63.9 percent)
Japanese Yen (27.2 percent) vs Japanese Yen previous week (14.0 percent)
Swiss Franc (17.5 percent) vs Swiss Franc previous week (7.9 percent)
Canadian Dollar (12.7 percent) vs Canadian Dollar previous week (10.5 percent)
Australian Dollar (40.8 percent) vs Australian Dollar previous week (36.0 percent)
New Zealand Dollar (20.3 percent) vs New Zealand Dollar previous week (12.6 percent)
Mexican Peso (84.4 percent) vs Mexican Peso previous week (84.0 percent)
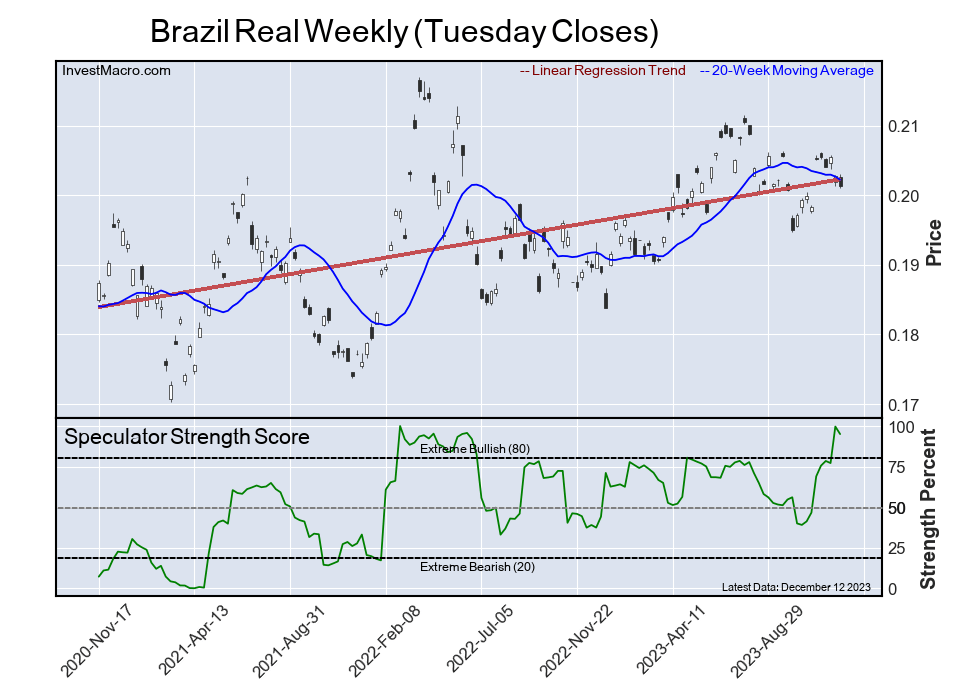
Brazilian Real (95.0 percent) vs Brazilian Real previous week (99.7 percent)
Bitcoin (35.3 percent) vs Bitcoin previous week (32.5 percent)
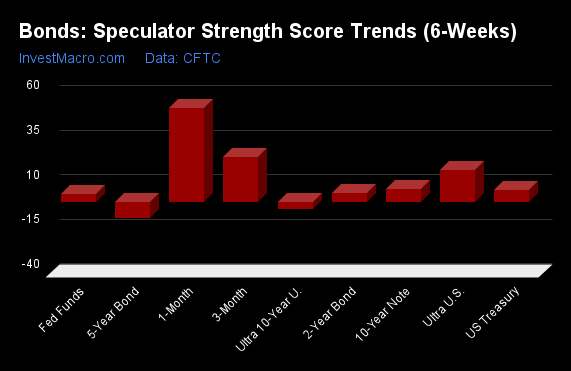
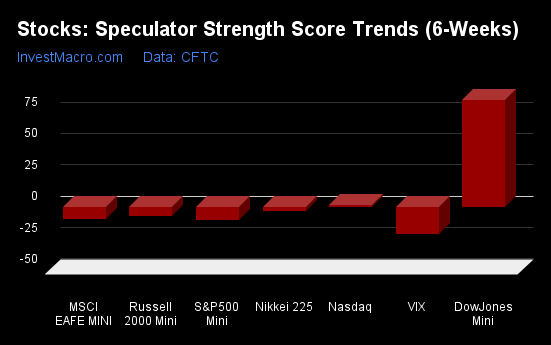
Brazilian Real & British Pound top the 6-Week Strength Trends

COT Strength Score Trends (or move index, calculates the 6-week changes in strength scores) showed that the Brazilian Real (48 percent) and the British Pound (29 percent) lead the past six weeks trends for the currencies. The EuroFX (26 percent), the Mexican Peso (26 percent) and the Australian Dollar (21 percent) are the next highest positive movers in the latest trends data.
The Canadian Dollar (-5 percent), Bitcoin (-5 percent), the US Dollar Index (-2 percent) and the New Zealand Dollar (-2 percent) lead the downside trend scores this week.
Strength Trend Statistics:
US Dollar Index (-2.3 percent) vs US Dollar Index previous week (0.5 percent)
EuroFX (26.4 percent) vs EuroFX previous week (28.6 percent)
British Pound Sterling (29.1 percent) vs British Pound Sterling previous week (21.0 percent)
Japanese Yen (12.6 percent) vs Japanese Yen previous week (-2.9 percent)
Swiss Franc (1.2 percent) vs Swiss Franc previous week (-7.8 percent)
Canadian Dollar (-5.0 percent) vs Canadian Dollar previous week (-7.7 percent)
Australian Dollar (20.8 percent) vs Australian Dollar previous week (23.3 percent)
New Zealand Dollar (-1.7 percent) vs New Zealand Dollar previous week (-9.4 percent)
Mexican Peso (26.1 percent) vs Mexican Peso previous week (21.7 percent)
Brazilian Real (48.4 percent) vs Brazilian Real previous week (58.5 percent)
Bitcoin (-4.8 percent) vs Bitcoin previous week (-27.0 percent)
Individual COT Forex Markets:
US Dollar Index Futures:
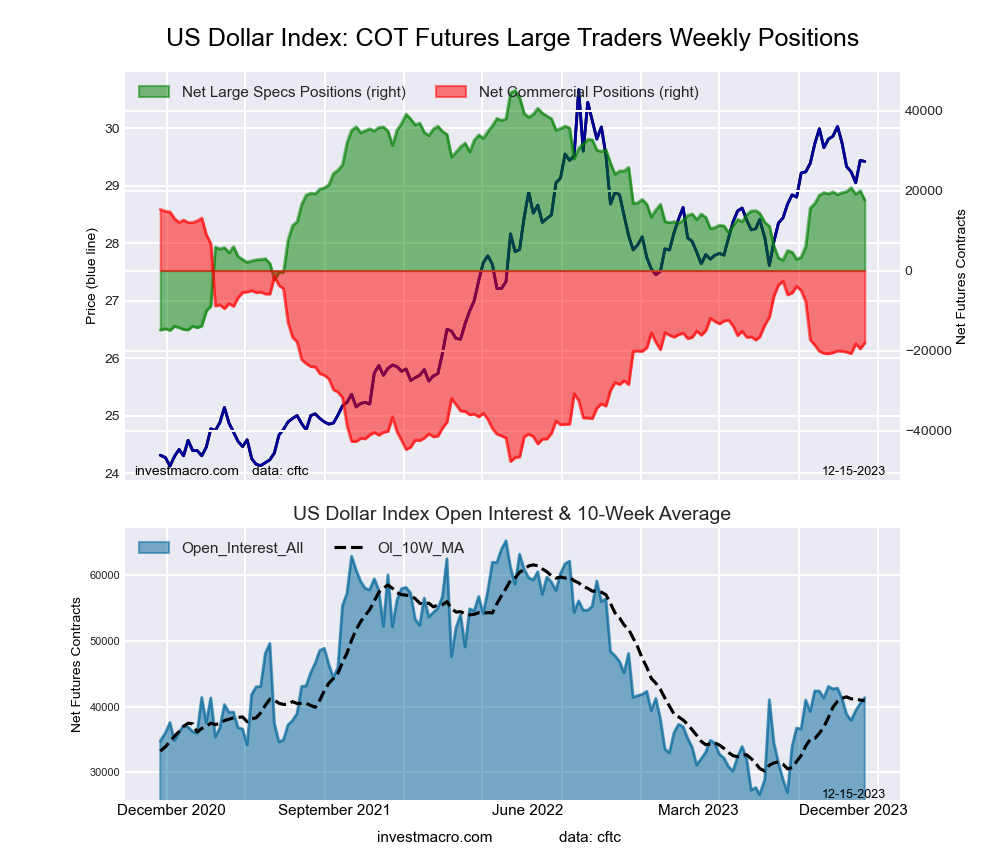 The US Dollar Index large speculator standing this week recorded a net position of 17,601 contracts in the data reported through Tuesday. This was a weekly fall of -2,343 contracts from the previous week which had a total of 19,944 net contracts.
This week’s current strength score (the trader positioning range over the past three years, measured from 0 to 100) shows the speculators are currently Bullish with a score of 54.3 percent. The commercials are Bearish with a score of 47.1 percent and the small traders (not shown in chart) are Bearish-Extreme with a score of 14.6 percent.
Price Trend-Following Model: Weak Uptrend (Possible Trend Change)
Our weekly trend-following model classifies the current market price position as: Weak Uptrend. The current action for the model is considered to be: Hold – Maintain Long Position.
| US DOLLAR INDEX Statistics | SPECULATORS | COMMERCIALS | SMALL TRADERS |
| – Percent of Open Interest Longs: | 68.0 | 18.6 | 7.5 |
| – Percent of Open Interest Shorts: | 25.4 | 62.2 | 6.5 |
| – Net Position: | 17,601 | -18,032 | 431 |
| – Gross Longs: | 28,100 | 7,677 | 3,116 |
| – Gross Shorts: | 10,499 | 25,709 | 2,685 |
| – Long to Short Ratio: | 2.7 to 1 | 0.3 to 1 | 1.2 to 1 |
| NET POSITION TREND: | | | |
| – Strength Index Score (3 Year Range Pct): | 54.3 | 47.1 | 14.6 |
| – Strength Index Reading (3 Year Range): | Bullish | Bearish | Bearish-Extreme |
| NET POSITION MOVEMENT INDEX: | | | |
| – 6-Week Change in Strength Index: | -2.3 | 3.3 | -8.1 |
Euro Currency Futures:
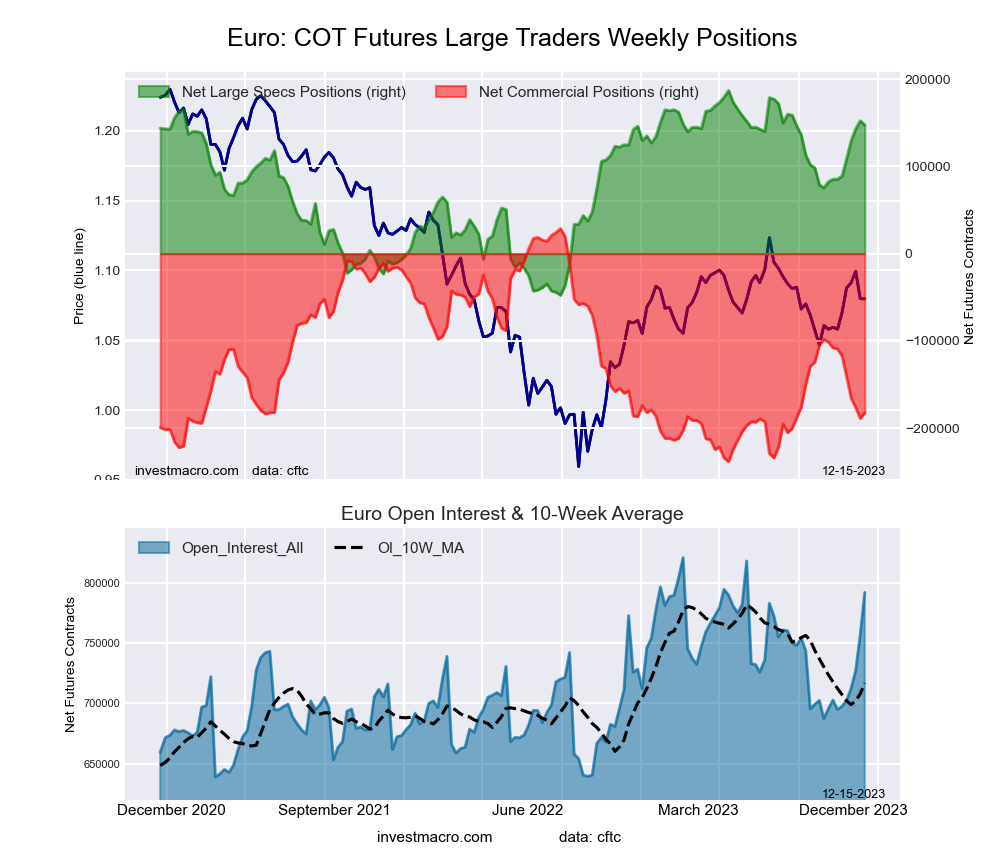 The Euro Currency large speculator standing this week recorded a net position of 147,327 contracts in the data reported through Tuesday. This was a weekly decline of -5,033 contracts from the previous week which had a total of 152,360 net contracts.
This week’s current strength score (the trader positioning range over the past three years, measured from 0 to 100) shows the speculators are currently Bullish-Extreme with a score of 83.1 percent. The commercials are Bearish with a score of 20.9 percent and the small traders (not shown in chart) are Bearish with a score of 34.9 percent.
Price Trend-Following Model: Weak Downtrend (Possible Trend Change)
Our weekly trend-following model classifies the current market price position as: Weak Downtrend. The current action for the model is considered to be: Hold – Maintain Short Position.
| EURO Currency Statistics | SPECULATORS | COMMERCIALS | SMALL TRADERS |
| – Percent of Open Interest Longs: | 29.3 | 54.7 | 12.7 |
| – Percent of Open Interest Shorts: | 10.7 | 77.7 | 8.2 |
| – Net Position: | 147,327 | -182,357 | 35,030 |
| – Gross Longs: | 231,837 | 433,209 | 100,250 |
| – Gross Shorts: | 84,510 | 615,566 | 65,220 |
| – Long to Short Ratio: | 2.7 to 1 | 0.7 to 1 | 1.5 to 1 |
| NET POSITION TREND: | | | |
| – Strength Index Score (3 Year Range Pct): | 83.1 | 20.9 | 34.9 |
| – Strength Index Reading (3 Year Range): | Bullish-Extreme | Bearish | Bearish |
| NET POSITION MOVEMENT INDEX: | | | |
| – 6-Week Change in Strength Index: | 26.4 | -27.4 | 18.2 |
British Pound Sterling Futures:
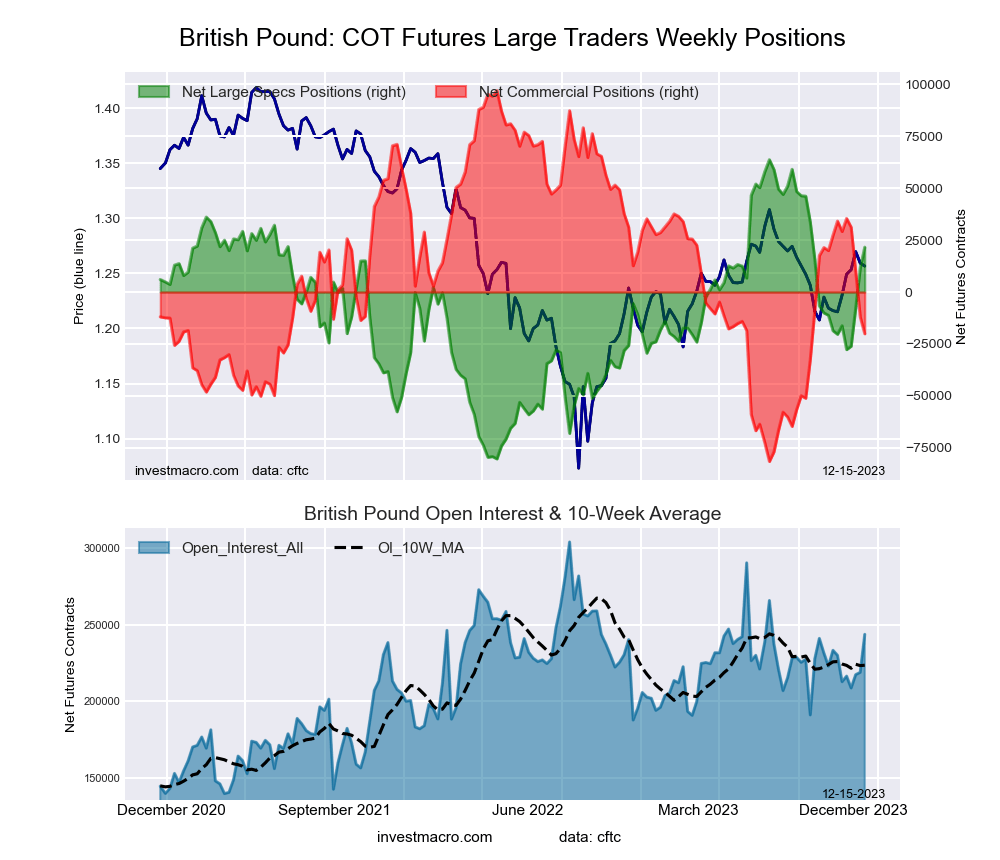 The British Pound Sterling large speculator standing this week recorded a net position of 21,581 contracts in the data reported through Tuesday. This was a weekly increase of 9,916 contracts from the previous week which had a total of 11,665 net contracts.
This week’s current strength score (the trader positioning range over the past three years, measured from 0 to 100) shows the speculators are currently Bullish with a score of 70.8 percent. The commercials are Bearish with a score of 34.4 percent and the small traders (not shown in chart) are Bullish with a score of 55.1 percent.
Price Trend-Following Model: Weak Downtrend (Possible Trend Change)
Our weekly trend-following model classifies the current market price position as: Weak Downtrend. The current action for the model is considered to be: Hold – Maintain Short Position.
| BRITISH POUND Statistics | SPECULATORS | COMMERCIALS | SMALL TRADERS |
| – Percent of Open Interest Longs: | 29.6 | 47.4 | 18.3 |
| – Percent of Open Interest Shorts: | 20.7 | 55.7 | 18.9 |
| – Net Position: | 21,581 | -20,101 | -1,480 |
| – Gross Longs: | 72,011 | 115,620 | 44,638 |
| – Gross Shorts: | 50,430 | 135,721 | 46,118 |
| – Long to Short Ratio: | 1.4 to 1 | 0.9 to 1 | 1.0 to 1 |
| NET POSITION TREND: | | | |
| – Strength Index Score (3 Year Range Pct): | 70.8 | 34.4 | 55.1 |
| – Strength Index Reading (3 Year Range): | Bullish | Bearish | Bullish |
| NET POSITION MOVEMENT INDEX: | | | |
| – 6-Week Change in Strength Index: | 29.1 | -30.4 | 24.1 |
Japanese Yen Futures:
 The Japanese Yen large speculator standing this week recorded a net position of -81,131 contracts in the data reported through Tuesday. This was a weekly gain of 23,825 contracts from the previous week which had a total of -104,956 net contracts.
This week’s current strength score (the trader positioning range over the past three years, measured from 0 to 100) shows the speculators are currently Bearish with a score of 27.2 percent. The commercials are Bullish with a score of 74.0 percent and the small traders (not shown in chart) are Bullish with a score of 56.7 percent.
Price Trend-Following Model: Weak Downtrend (Possible Trend Change)
Our weekly trend-following model classifies the current market price position as: Weak Downtrend. The current action for the model is considered to be: Hold – Maintain Short Position.
| JAPANESE YEN Statistics | SPECULATORS | COMMERCIALS | SMALL TRADERS |
| – Percent of Open Interest Longs: | 11.0 | 67.1 | 15.1 |
| – Percent of Open Interest Shorts: | 42.5 | 36.2 | 14.4 |
| – Net Position: | -81,131 | 79,527 | 1,604 |
| – Gross Longs: | 28,226 | 172,756 | 38,804 |
| – Gross Shorts: | 109,357 | 93,229 | 37,200 |
| – Long to Short Ratio: | 0.3 to 1 | 1.9 to 1 | 1.0 to 1 |
| NET POSITION TREND: | | | |
| – Strength Index Score (3 Year Range Pct): | 27.2 | 74.0 | 56.7 |
| – Strength Index Reading (3 Year Range): | Bearish | Bullish | Bullish |
| NET POSITION MOVEMENT INDEX: | | | |
| – 6-Week Change in Strength Index: | 12.6 | -13.6 | 10.8 |
Swiss Franc Futures:
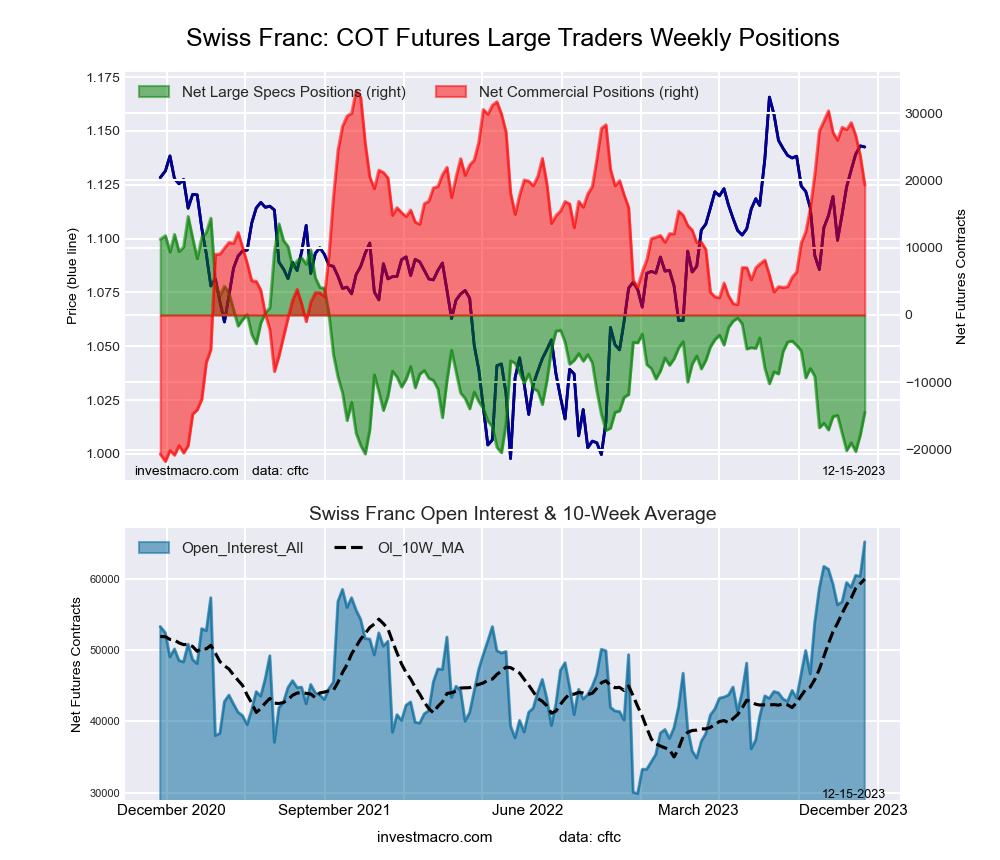 The Swiss Franc large speculator standing this week recorded a net position of -14,474 contracts in the data reported through Tuesday. This was a weekly rise of 3,378 contracts from the previous week which had a total of -17,852 net contracts.
This week’s current strength score (the trader positioning range over the past three years, measured from 0 to 100) shows the speculators are currently Bearish-Extreme with a score of 17.5 percent. The commercials are Bullish with a score of 74.5 percent and the small traders (not shown in chart) are Bearish with a score of 43.8 percent.
Price Trend-Following Model: Weak Downtrend (Possible Trend Change)
Our weekly trend-following model classifies the current market price position as: Weak Downtrend. The current action for the model is considered to be: Hold – Maintain Short Position.
| SWISS FRANC Statistics | SPECULATORS | COMMERCIALS | SMALL TRADERS |
| – Percent of Open Interest Longs: | 6.1 | 65.2 | 19.6 |
| – Percent of Open Interest Shorts: | 28.3 | 35.6 | 27.0 |
| – Net Position: | -14,474 | 19,313 | -4,839 |
| – Gross Longs: | 3,970 | 42,489 | 12,788 |
| – Gross Shorts: | 18,444 | 23,176 | 17,627 |
| – Long to Short Ratio: | 0.2 to 1 | 1.8 to 1 | 0.7 to 1 |
| NET POSITION TREND: | | | |
| – Strength Index Score (3 Year Range Pct): | 17.5 | 74.5 | 43.8 |
| – Strength Index Reading (3 Year Range): | Bearish-Extreme | Bullish | Bearish |
| NET POSITION MOVEMENT INDEX: | | | |
| – 6-Week Change in Strength Index: | 1.2 | -12.1 | 22.4 |
Canadian Dollar Futures:
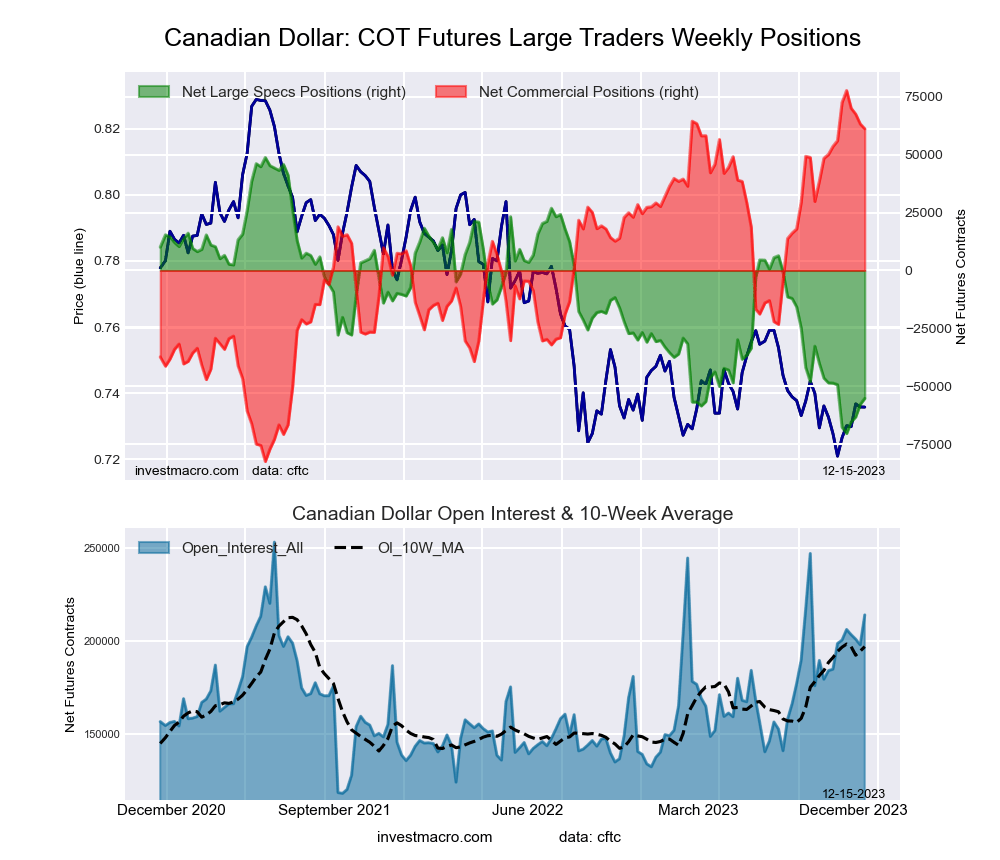 The Canadian Dollar large speculator standing this week recorded a net position of -55,245 contracts in the data reported through Tuesday. This was a weekly lift of 2,603 contracts from the previous week which had a total of -57,848 net contracts.
This week’s current strength score (the trader positioning range over the past three years, measured from 0 to 100) shows the speculators are currently Bearish-Extreme with a score of 12.7 percent. The commercials are Bullish-Extreme with a score of 89.7 percent and the small traders (not shown in chart) are Bearish-Extreme with a score of 9.6 percent.
Price Trend-Following Model: Weak Downtrend (Possible Trend Change)
Our weekly trend-following model classifies the current market price position as: Weak Downtrend. The current action for the model is considered to be: Hold – Maintain Short Position.
| CANADIAN DOLLAR Statistics | SPECULATORS | COMMERCIALS | SMALL TRADERS |
| – Percent of Open Interest Longs: | 9.1 | 71.9 | 13.3 |
| – Percent of Open Interest Shorts: | 34.9 | 43.2 | 16.1 |
| – Net Position: | -55,245 | 61,193 | -5,948 |
| – Gross Longs: | 19,457 | 153,678 | 28,390 |
| – Gross Shorts: | 74,702 | 92,485 | 34,338 |
| – Long to Short Ratio: | 0.3 to 1 | 1.7 to 1 | 0.8 to 1 |
| NET POSITION TREND: | | | |
| – Strength Index Score (3 Year Range Pct): | 12.7 | 89.7 | 9.6 |
| – Strength Index Reading (3 Year Range): | Bearish-Extreme | Bullish-Extreme | Bearish-Extreme |
| NET POSITION MOVEMENT INDEX: | | | |
| – 6-Week Change in Strength Index: | -5.0 | 3.2 | 1.7 |
Australian Dollar Futures:
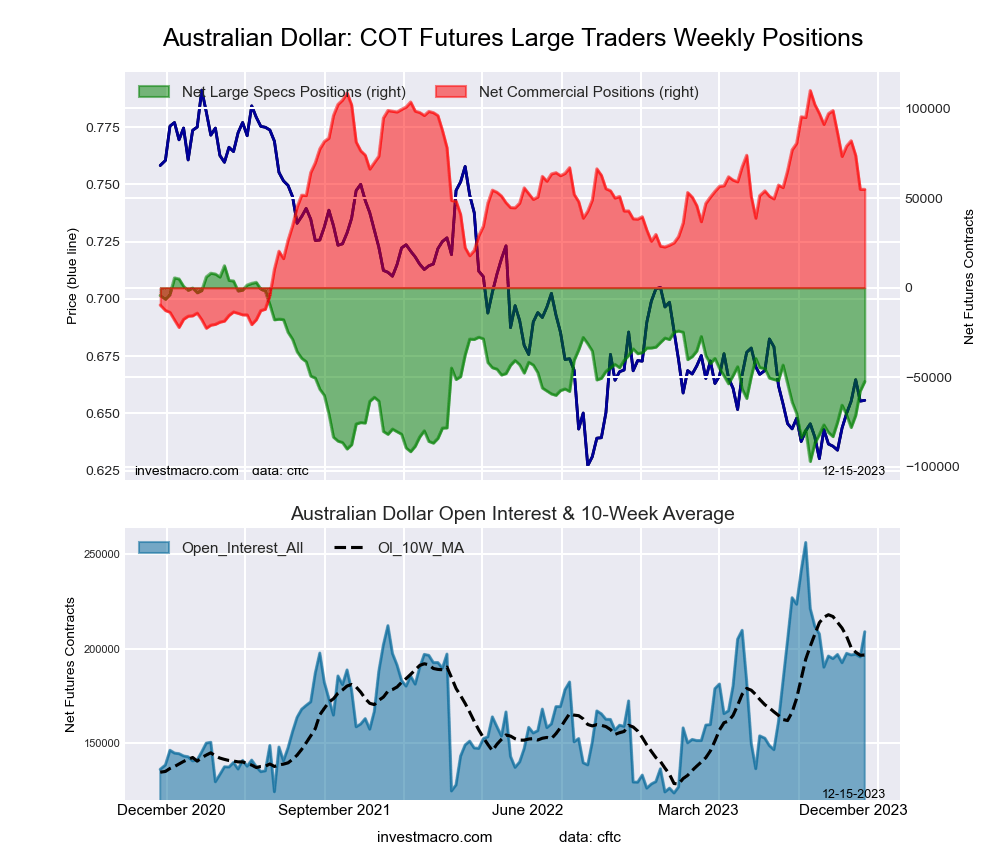 The Australian Dollar large speculator standing this week recorded a net position of -52,340 contracts in the data reported through Tuesday. This was a weekly gain of 5,341 contracts from the previous week which had a total of -57,681 net contracts.
This week’s current strength score (the trader positioning range over the past three years, measured from 0 to 100) shows the speculators are currently Bearish with a score of 40.8 percent. The commercials are Bullish with a score of 58.4 percent and the small traders (not shown in chart) are Bearish with a score of 46.3 percent.
Price Trend-Following Model: Strong Uptrend
Our weekly trend-following model classifies the current market price position as: Strong Uptrend. The current action for the model is considered to be: New Buy – Long Position.
| AUSTRALIAN DOLLAR Statistics | SPECULATORS | COMMERCIALS | SMALL TRADERS |
| – Percent of Open Interest Longs: | 14.8 | 67.1 | 10.7 |
| – Percent of Open Interest Shorts: | 39.9 | 40.8 | 11.9 |
| – Net Position: | -52,340 | 54,868 | -2,528 |
| – Gross Longs: | 30,967 | 140,172 | 22,411 |
| – Gross Shorts: | 83,307 | 85,304 | 24,939 |
| – Long to Short Ratio: | 0.4 to 1 | 1.6 to 1 | 0.9 to 1 |
| NET POSITION TREND: | | | |
| – Strength Index Score (3 Year Range Pct): | 40.8 | 58.4 | 46.3 |
| – Strength Index Reading (3 Year Range): | Bearish | Bullish | Bearish |
| NET POSITION MOVEMENT INDEX: | | | |
| – 6-Week Change in Strength Index: | 20.8 | -23.8 | 21.4 |
New Zealand Dollar Futures:
 The New Zealand Dollar large speculator standing this week recorded a net position of -13,488 contracts in the data reported through Tuesday. This was a weekly increase of 2,962 contracts from the previous week which had a total of -16,450 net contracts.
This week’s current strength score (the trader positioning range over the past three years, measured from 0 to 100) shows the speculators are currently Bearish with a score of 20.3 percent. The commercials are Bullish with a score of 74.6 percent and the small traders (not shown in chart) are Bullish with a score of 54.5 percent.
Price Trend-Following Model: Strong Uptrend
Our weekly trend-following model classifies the current market price position as: Strong Uptrend. The current action for the model is considered to be: New Buy – Long Position.
| NEW ZEALAND DOLLAR Statistics | SPECULATORS | COMMERCIALS | SMALL TRADERS |
| – Percent of Open Interest Longs: | 22.8 | 59.3 | 7.7 |
| – Percent of Open Interest Shorts: | 45.9 | 36.8 | 7.1 |
| – Net Position: | -13,488 | 13,109 | 379 |
| – Gross Longs: | 13,273 | 34,588 | 4,515 |
| – Gross Shorts: | 26,761 | 21,479 | 4,136 |
| – Long to Short Ratio: | 0.5 to 1 | 1.6 to 1 | 1.1 to 1 |
| NET POSITION TREND: | | | |
| – Strength Index Score (3 Year Range Pct): | 20.3 | 74.6 | 54.5 |
| – Strength Index Reading (3 Year Range): | Bearish | Bullish | Bullish |
| NET POSITION MOVEMENT INDEX: | | | |
| – 6-Week Change in Strength Index: | -1.7 | -7.1 | 45.2 |
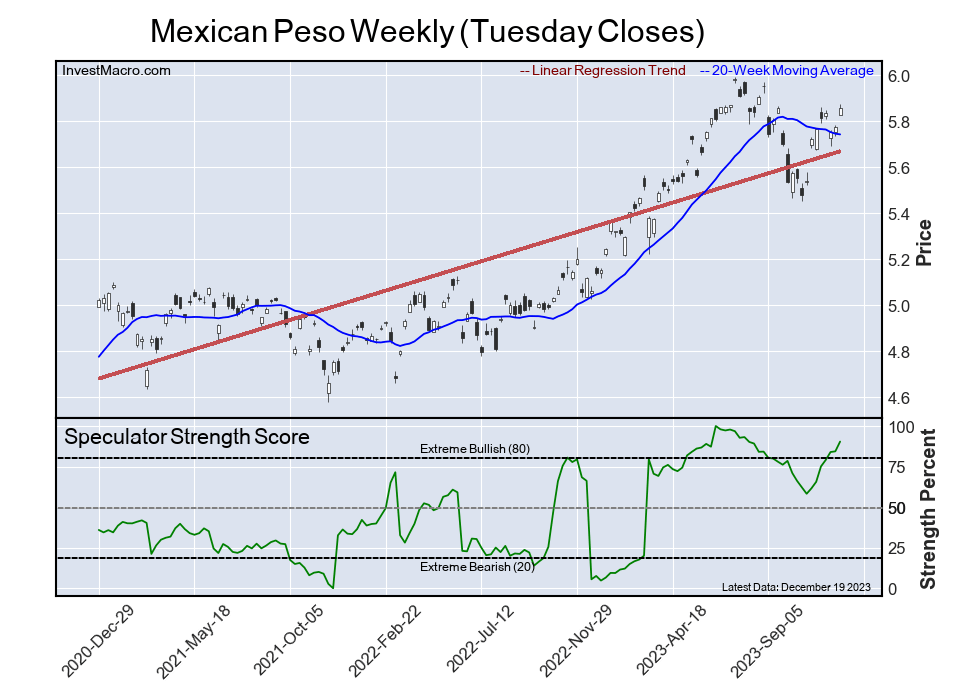
Mexican Peso Futures:
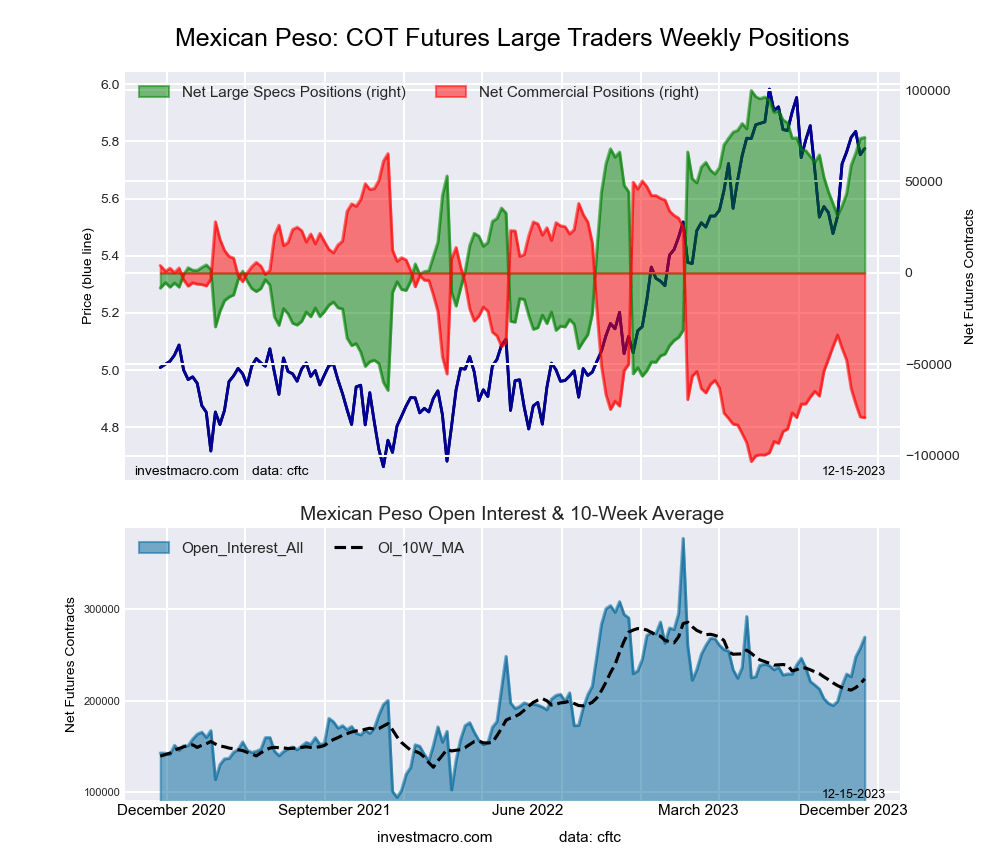 The Mexican Peso large speculator standing this week recorded a net position of 74,125 contracts in the data reported through Tuesday. This was a weekly increase of 669 contracts from the previous week which had a total of 73,456 net contracts.
This week’s current strength score (the trader positioning range over the past three years, measured from 0 to 100) shows the speculators are currently Bullish-Extreme with a score of 84.4 percent. The commercials are Bearish-Extreme with a score of 14.2 percent and the small traders (not shown in chart) are Bearish with a score of 42.7 percent.
Price Trend-Following Model: Weak Downtrend (Possible Trend Change)
Our weekly trend-following model classifies the current market price position as: Weak Downtrend. The current action for the model is considered to be: Hold – Maintain Short Position.
| MEXICAN PESO Statistics | SPECULATORS | COMMERCIALS | SMALL TRADERS |
| – Percent of Open Interest Longs: | 42.5 | 49.7 | 2.6 |
| – Percent of Open Interest Shorts: | 15.0 | 79.1 | 0.7 |
| – Net Position: | 74,125 | -79,064 | 4,939 |
| – Gross Longs: | 114,396 | 133,847 | 6,875 |
| – Gross Shorts: | 40,271 | 212,911 | 1,936 |
| – Long to Short Ratio: | 2.8 to 1 | 0.6 to 1 | 3.6 to 1 |
| NET POSITION TREND: | | | |
| – Strength Index Score (3 Year Range Pct): | 84.4 | 14.2 | 42.7 |
| – Strength Index Reading (3 Year Range): | Bullish-Extreme | Bearish-Extreme | Bearish |
| NET POSITION MOVEMENT INDEX: | | | |
| – 6-Week Change in Strength Index: | 26.1 | -26.8 | 15.0 |
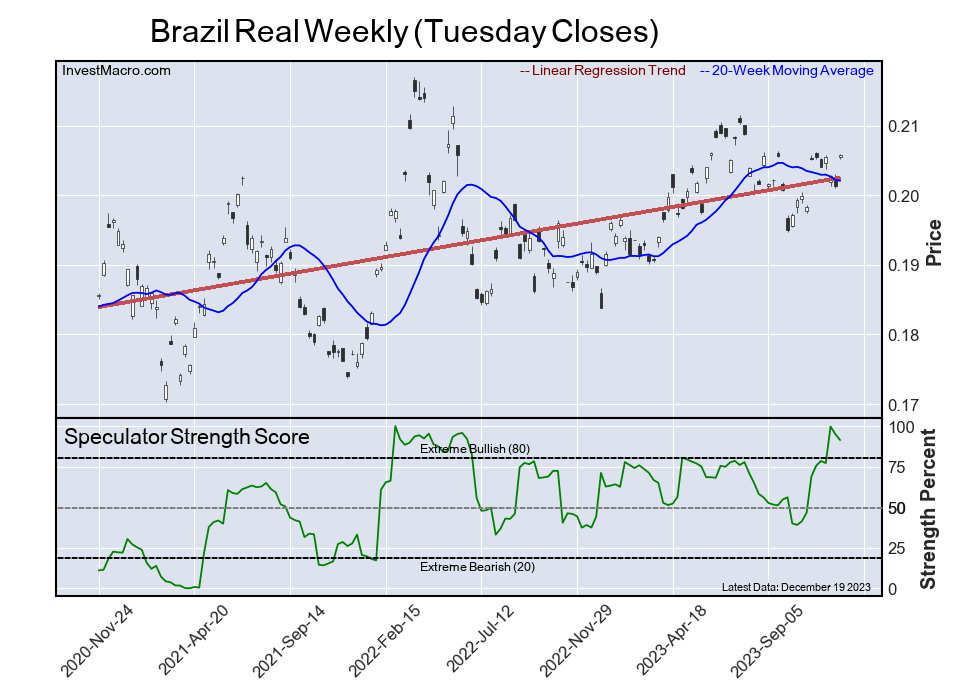
Brazilian Real Futures:
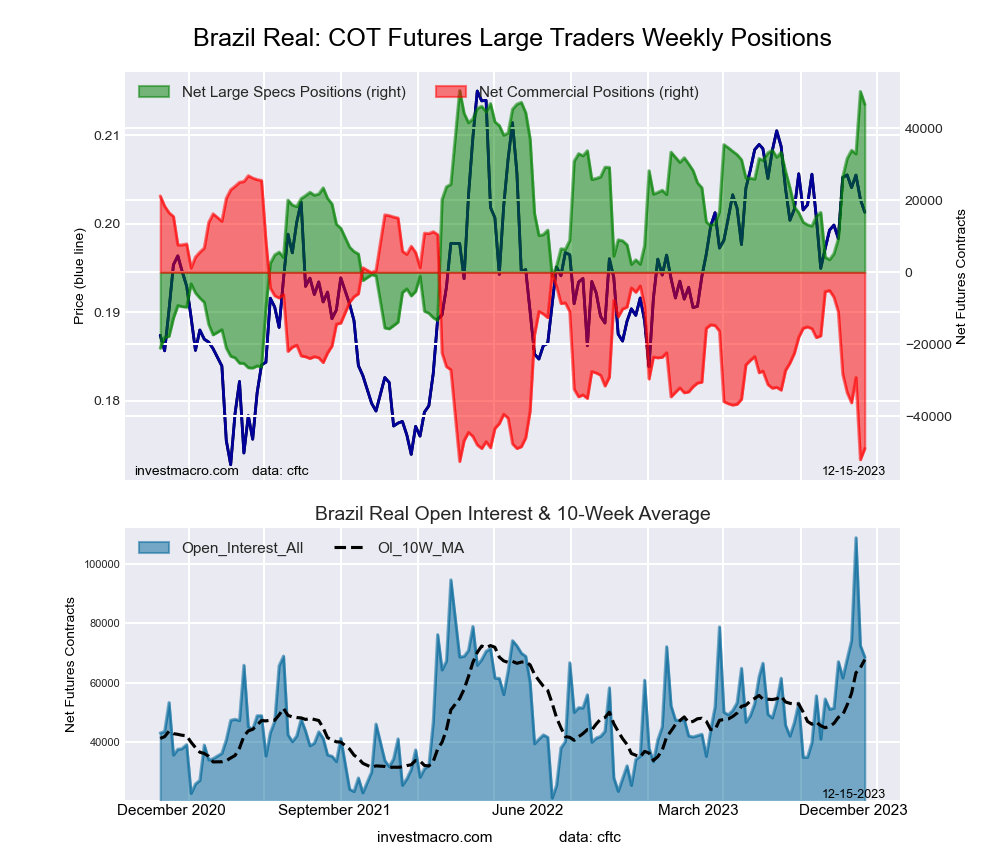 The Brazilian Real large speculator standing this week recorded a net position of 46,664 contracts in the data reported through Tuesday. This was a weekly decrease of -3,580 contracts from the previous week which had a total of 50,244 net contracts.
This week’s current strength score (the trader positioning range over the past three years, measured from 0 to 100) shows the speculators are currently Bullish-Extreme with a score of 95.0 percent. The commercials are Bearish-Extreme with a score of 4.5 percent and the small traders (not shown in chart) are Bullish with a score of 55.8 percent.
Price Trend-Following Model: Weak Downtrend (Possible Trend Change)
Our weekly trend-following model classifies the current market price position as: Weak Downtrend. The current action for the model is considered to be: Hold – Maintain Short Position.
| BRAZIL REAL Statistics | SPECULATORS | COMMERCIALS | SMALL TRADERS |
| – Percent of Open Interest Longs: | 73.3 | 20.9 | 5.5 |
| – Percent of Open Interest Shorts: | 5.3 | 92.3 | 2.2 |
| – Net Position: | 46,664 | -48,955 | 2,291 |
| – Gross Longs: | 50,305 | 14,375 | 3,767 |
| – Gross Shorts: | 3,641 | 63,330 | 1,476 |
| – Long to Short Ratio: | 13.8 to 1 | 0.2 to 1 | 2.6 to 1 |
| NET POSITION TREND: | | | |
| – Strength Index Score (3 Year Range Pct): | 95.0 | 4.5 | 55.8 |
| – Strength Index Reading (3 Year Range): | Bullish-Extreme | Bearish-Extreme | Bullish |
| NET POSITION MOVEMENT INDEX: | | | |
| – 6-Week Change in Strength Index: | 48.4 | -47.8 | 5.7 |
Bitcoin Futures:
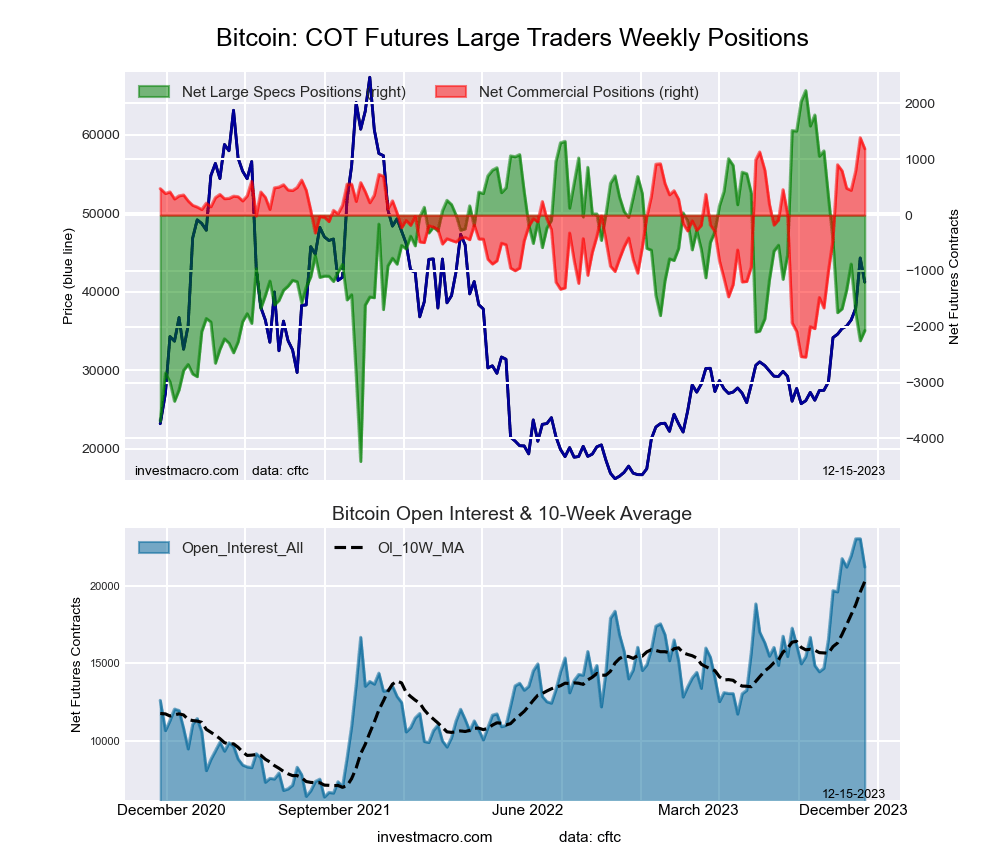 The Bitcoin large speculator standing this week recorded a net position of -2,067 contracts in the data reported through Tuesday. This was a weekly increase of 183 contracts from the previous week which had a total of -2,250 net contracts.
This week’s current strength score (the trader positioning range over the past three years, measured from 0 to 100) shows the speculators are currently Bearish with a score of 35.3 percent. The commercials are Bullish-Extreme with a score of 94.9 percent and the small traders (not shown in chart) are Bearish with a score of 32.9 percent.
Price Trend-Following Model: Strong Uptrend
Our weekly trend-following model classifies the current market price position as: Strong Uptrend. The current action for the model is considered to be: Hold – Maintain Long Position.
| BITCOIN Statistics | SPECULATORS | COMMERCIALS | SMALL TRADERS |
| – Percent of Open Interest Longs: | 74.1 | 7.9 | 7.8 |
| – Percent of Open Interest Shorts: | 83.8 | 2.3 | 3.7 |
| – Net Position: | -2,067 | 1,188 | 879 |
| – Gross Longs: | 15,714 | 1,684 | 1,654 |
| – Gross Shorts: | 17,781 | 496 | 775 |
| – Long to Short Ratio: | 0.9 to 1 | 3.4 to 1 | 2.1 to 1 |
| NET POSITION TREND: | | | |
| – Strength Index Score (3 Year Range Pct): | 35.3 | 94.9 | 32.9 |
| – Strength Index Reading (3 Year Range): | Bearish | Bullish-Extreme | Bearish |
| NET POSITION MOVEMENT INDEX: | | | |
| – 6-Week Change in Strength Index: | -4.8 | 7.3 | 0.8 |
Article By InvestMacro – Receive our weekly COT Newsletter
*COT Report: The COT data, released weekly to the public each Friday, is updated through the most recent Tuesday (data is 3 days old) and shows a quick view of how large speculators or non-commercials (for-profit traders) were positioned in the futures markets.
The CFTC categorizes trader positions according to commercial hedgers (traders who use futures contracts for hedging as part of the business), non-commercials (large traders who speculate to realize trading profits) and nonreportable traders (usually small traders/speculators) as well as their open interest (contracts open in the market at time of reporting). See CFTC criteria here.


