By InvestMacro
Here are the latest charts and statistics for the Commitment of Traders (COT) data published by the Commodities Futures Trading Commission (CFTC).
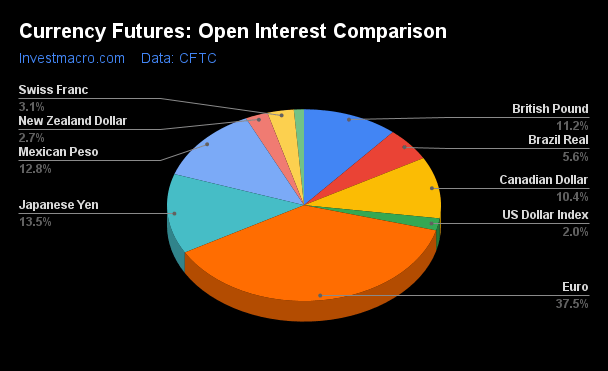
The latest COT data is updated through Tuesday November 28th and shows a quick view of how large market participants (for-profit speculators and commercial traders) were positioned in the futures markets. All currency positions are in direct relation to the US dollar where, for example, a bet for the euro is a bet that the euro will rise versus the dollar while a bet against the euro will be a bet that the euro will decline versus the dollar.
Weekly Speculator Changes led by British Pound & EuroFX
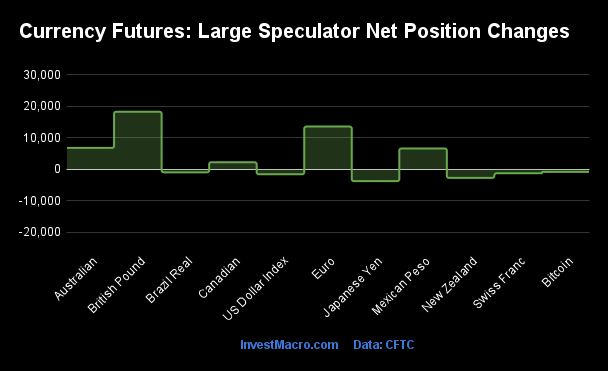
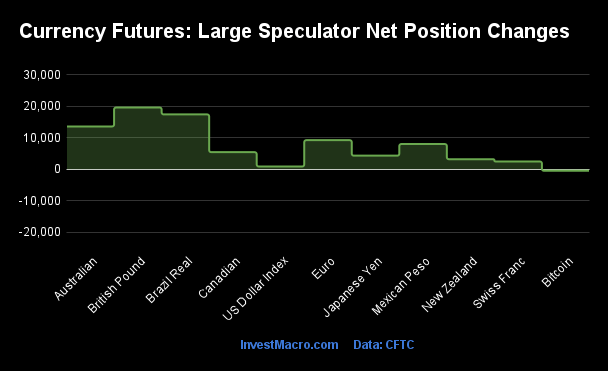
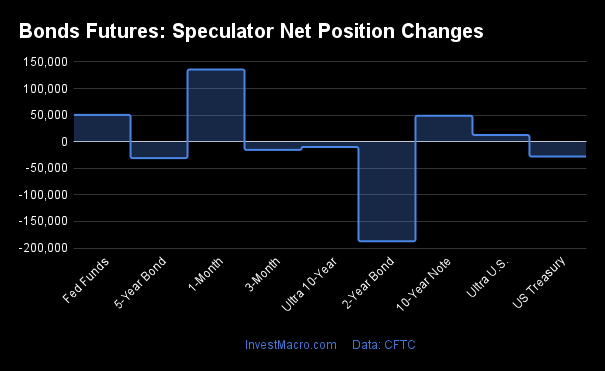
The COT currency market speculator bets were slightly lower this week as five out of the eleven currency markets we cover had higher positioning while the other six markets had lower speculator contracts.
Leading the weekly gains for the currency markets was the British Pound (18,203 contracts) with the EuroFX (13,511 contracts) also rising by more than 10,000 contracts followed by the Australian Dollar (6,751 contracts), Mexican Peso (6,554 contracts) and the Canadian Dollar (2,198 contracts).
The currencies seeing declines in speculator bets on the week were the Japanese Yen (-3,783 contracts), US Dollar Index (-1,610 contracts), Brazilian Real (-1,001 contracts), New Zealand Dollar (-2,755 contracts), Swiss Franc (-1,295 contracts) and Bitcoin (-869 contracts) also registering lower bets on the week.
Currency Speculators push British Pound and Euro bets higher
Highlighting the COT currency’s data is this week’s boost in the speculator positioning for the British Pound Sterling and the Euro. Both of these currencies saw speculator positions rise by over +10,000 weekly contracts. Helping out both the Sterling and the Euro positioning has been a dent in the outlook for the US Dollar.
The US inflation numbers continue to moderate and market watchers are expecting the US Federal Reserve to hold their interest rates steady. According to the Fed Watch tool, expectations are currently 98 percent for a rate hold at the December meeting and when looking out over the next year, investors are starting to expect rate decreases in 2024.
The Pound Sterling speculative positioning rose this week by over +18,000 contracts and has gained in three out of the past four weeks. The GBP speculative level has now improved to the least bearish level of the past eight weeks at a total of -7,895 contracts. The GBPUSD exchange rate has been following suit with a price close this week at the highest level since August. The GBPUSD has bounced off the 1.2100 major support in recent months and has accelerated higher (+5% in November) with a close over the 1.2700 to end the week.
The Euro speculator position, meanwhile, jumped by over +13,000 contracts this week as well and has now risen for seven consecutive weeks. The Euro position has gained by a total of +67,633 contracts over this past 7-week period to reach a 13-week high point at +143,165 contracts. The Euro (EURUSD) exchange rate to the US Dollar has also had a strong couple of months with the EURUSD currency pair bouncing off the 1.5500 major support to challenge the 1.1000 level. This week the EURUSD was rejected at the 1.1000 level and closed at 1.0879.
| Nov-28-2023 | OI | OI-Index | Spec-Net | Spec-Index | Com-Net | COM-Index | Smalls-Net | Smalls-Index |
|---|
| USD Index | 39,359 | 33 | 19,087 | 57 | -18,292 | 47 | -795 | 0 |
| EUR | 727,138 | 48 | 143,165 | 81 | -176,315 | 23 | 33,150 | 32 |
| GBP | 217,372 | 47 | -7,895 | 50 | 10,064 | 51 | -2,169 | 54 |
| JPY | 260,781 | 82 | -109,237 | 12 | 103,692 | 86 | 5,545 | 65 |
| CHF | 60,479 | 96 | -20,289 | 1 | 26,691 | 88 | -6,402 | 38 |
| CAD | 200,864 | 61 | -63,242 | 6 | 67,537 | 94 | -4,295 | 13 |
| AUD | 197,053 | 55 | -71,219 | 24 | 73,789 | 73 | -2,570 | 46 |
| NZD | 51,460 | 60 | -19,609 | 4 | 20,208 | 91 | -599 | 43 |
| MXN | 247,503 | 54 | 65,485 | 79 | -71,441 | 19 | 5,956 | 49 |
| RUB | 20,930 | 4 | 7,543 | 31 | -7,150 | 69 | -393 | 24 |
| BRL | 108,749 | 100 | 32,881 | 77 | -29,230 | 29 | -3,651 | 0 |
| Bitcoin | 23,027 | 100 | -1,745 | 40 | 792 | 0 | 953 | 35 |
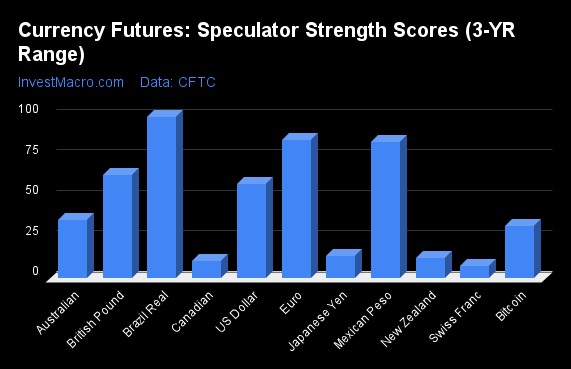
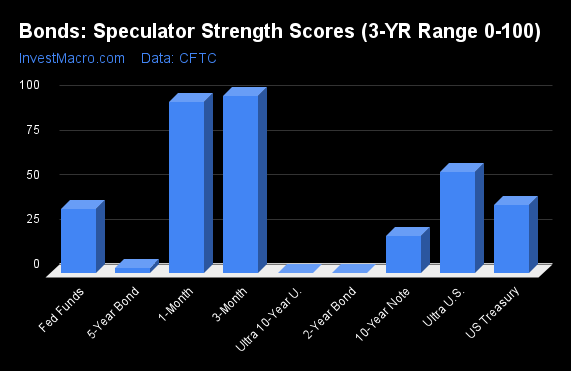
Strength Scores led by EuroFX & Mexican Peso

COT Strength Scores (a normalized measure of Speculator positions over a 3-Year range, from 0 to 100 where above 80 is Extreme-Bullish and below 20 is Extreme-Bearish) showed that the EuroFX (81 percent) and the Mexican Peso (79 percent) were leading the currency markets this week. The Brazilian Real (77 percent), US Dollar Index (57 percent) and the British Pound (50 percent) come in as the next highest in the weekly strength scores.
On the downside, the Swiss Franc (1 percent), the New Zealand Dollar (4 percent), the Canadian Dollar (6 percent) and the Japanese Yen (12 percent) come in at the lowest strength levels currently and are all in Extreme-Bearish territory (below 20 percent).
Strength Statistics:
US Dollar Index (56.8 percent) vs US Dollar Index previous week (59.5 percent)
EuroFX (81.3 percent) vs EuroFX previous week (75.5 percent)
British Pound Sterling (50.3 percent) vs British Pound Sterling previous week (37.7 percent)
Japanese Yen (11.6 percent) vs Japanese Yen previous week (13.7 percent)
Swiss Franc (1.0 percent) vs Swiss Franc previous week (4.7 percent)
Canadian Dollar (6.0 percent) vs Canadian Dollar previous week (4.2 percent)
Australian Dollar (23.6 percent) vs Australian Dollar previous week (17.4 percent)
New Zealand Dollar (4.3 percent) vs New Zealand Dollar previous week (11.5 percent)
Mexican Peso (79.1 percent) vs Mexican Peso previous week (75.1 percent)
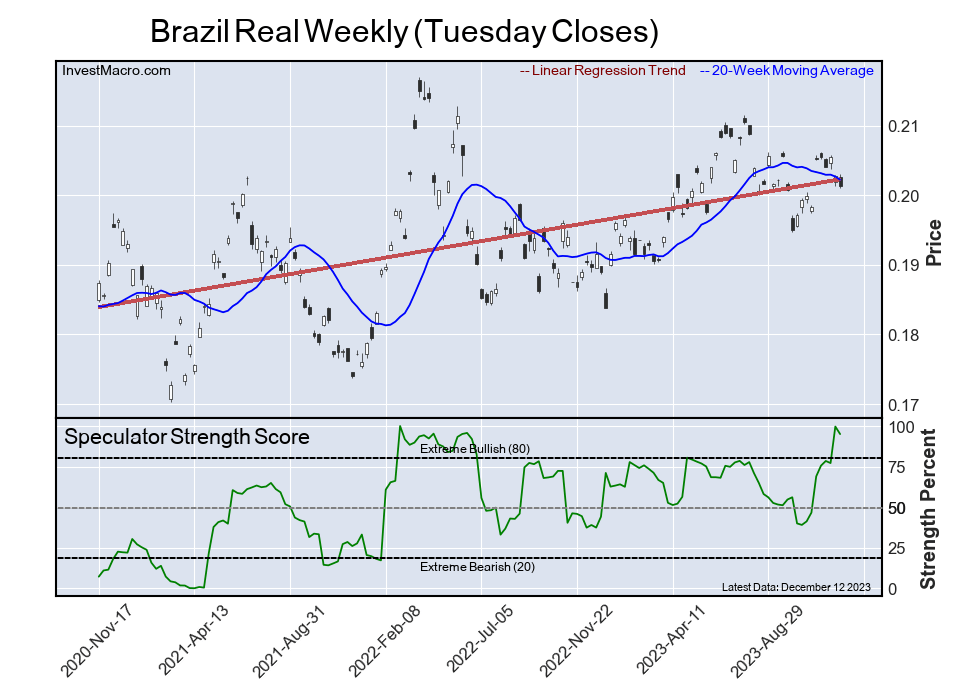
Brazilian Real (77.1 percent) vs Brazilian Real previous week (78.4 percent)
Bitcoin (40.1 percent) vs Bitcoin previous week (53.2 percent)
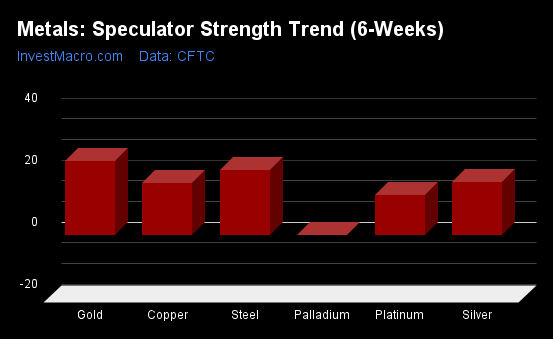
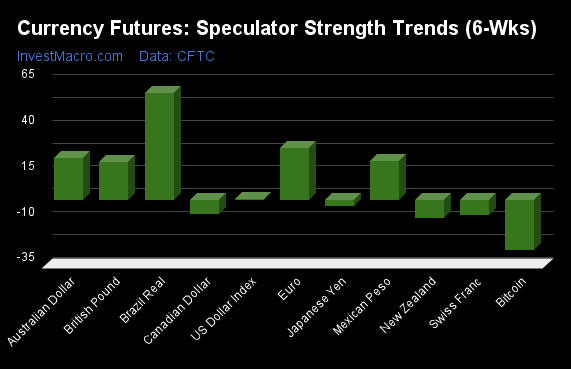
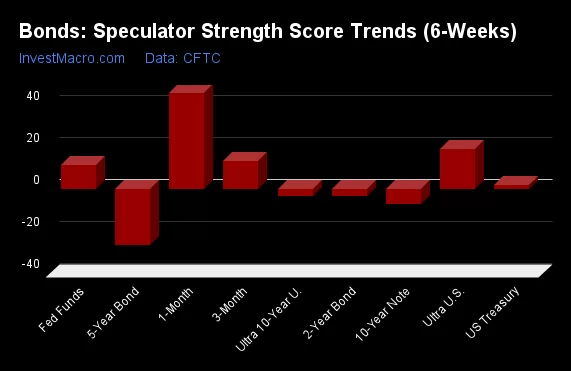
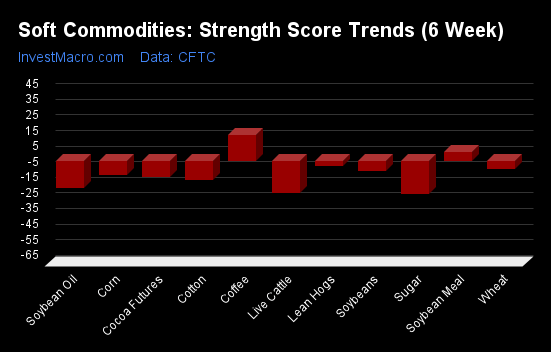
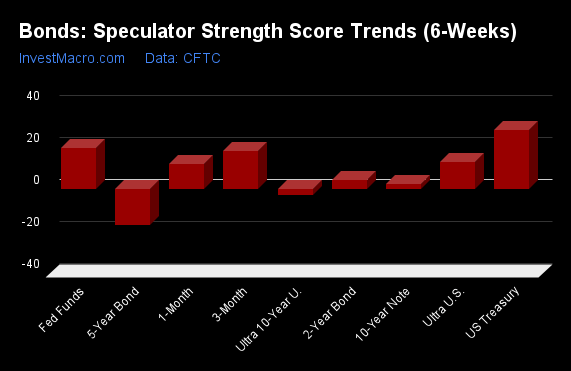
Brazilian Real & EuroFX top the 6-Week Strength Trends
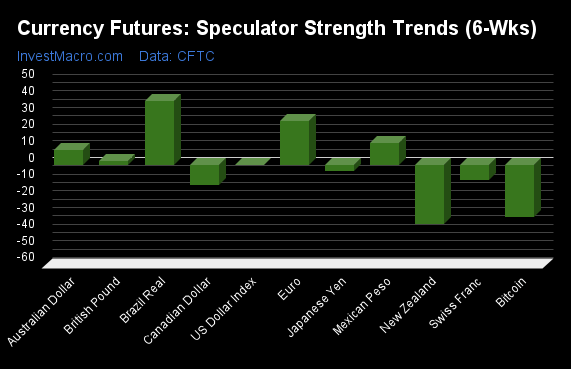
COT Strength Score Trends (or move index, calculates the 6-week changes in strength scores) showed that the Brazilian Real (38 percent) and the EuroFX (26 percent) lead the past six weeks trends for the currencies. The Mexican Peso (13 percent), the Australian Dollar (9 percent) and the British Pound (2 percent) are the next highest positive movers in the latest trends data.
The New Zealand Dollar (-36 percent) leads the downside trend scores currently with Bitcoin (-31 percent), the Canadian Dollar (-12 percent) and the Swiss Franc (-9 percent) following next with lower trend scores.
Strength Trend Statistics:
US Dollar Index (-0.1 percent) vs US Dollar Index previous week (2.0 percent)
EuroFX (25.9 percent) vs EuroFX previous week (23.1 percent)
British Pound Sterling (2.3 percent) vs British Pound Sterling previous week (-11.1 percent)
Japanese Yen (-3.6 percent) vs Japanese Yen previous week (-3.3 percent)
Swiss Franc (-9.1 percent) vs Swiss Franc previous week (-8.3 percent)
Canadian Dollar (-12.3 percent) vs Canadian Dollar previous week (-15.9 percent)
Australian Dollar (8.7 percent) vs Australian Dollar previous week (-1.3 percent)
New Zealand Dollar (-35.7 percent) vs New Zealand Dollar previous week (-33.2 percent)
Mexican Peso (12.9 percent) vs Mexican Peso previous week (4.1 percent)
Brazilian Real (38.1 percent) vs Brazilian Real previous week (38.5 percent)
Bitcoin (-31.2 percent) vs Bitcoin previous week (-30.5 percent)
Individual COT Forex Markets:
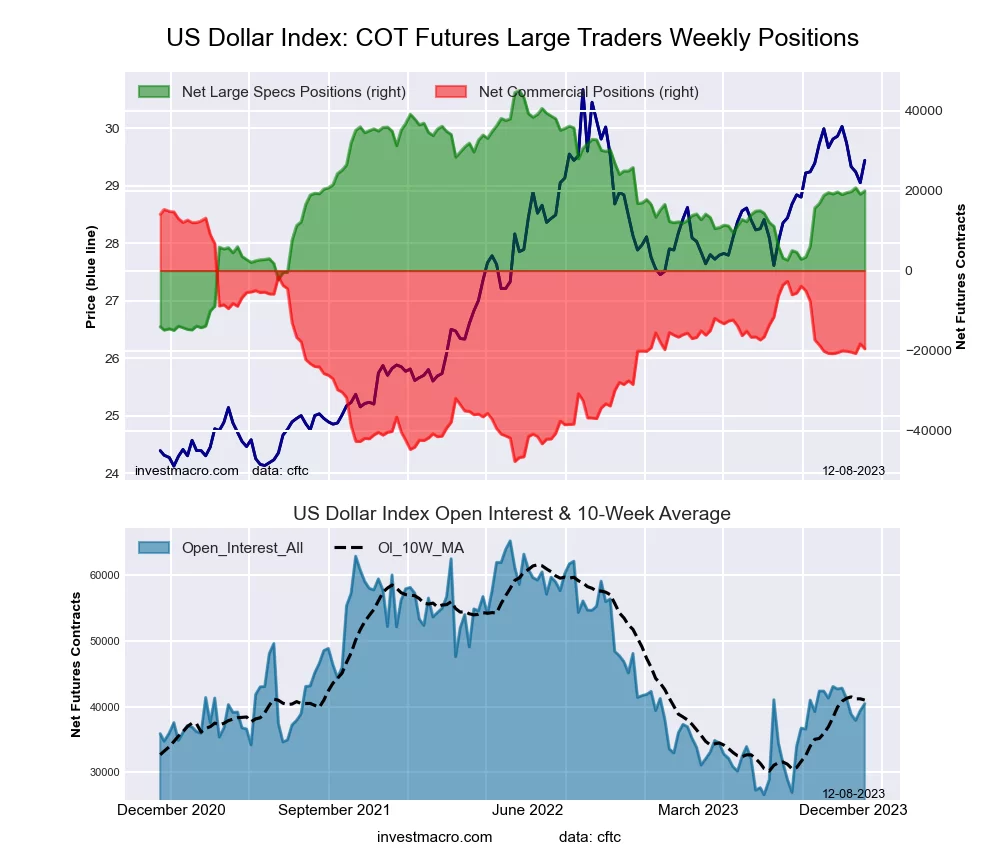
US Dollar Index Futures:
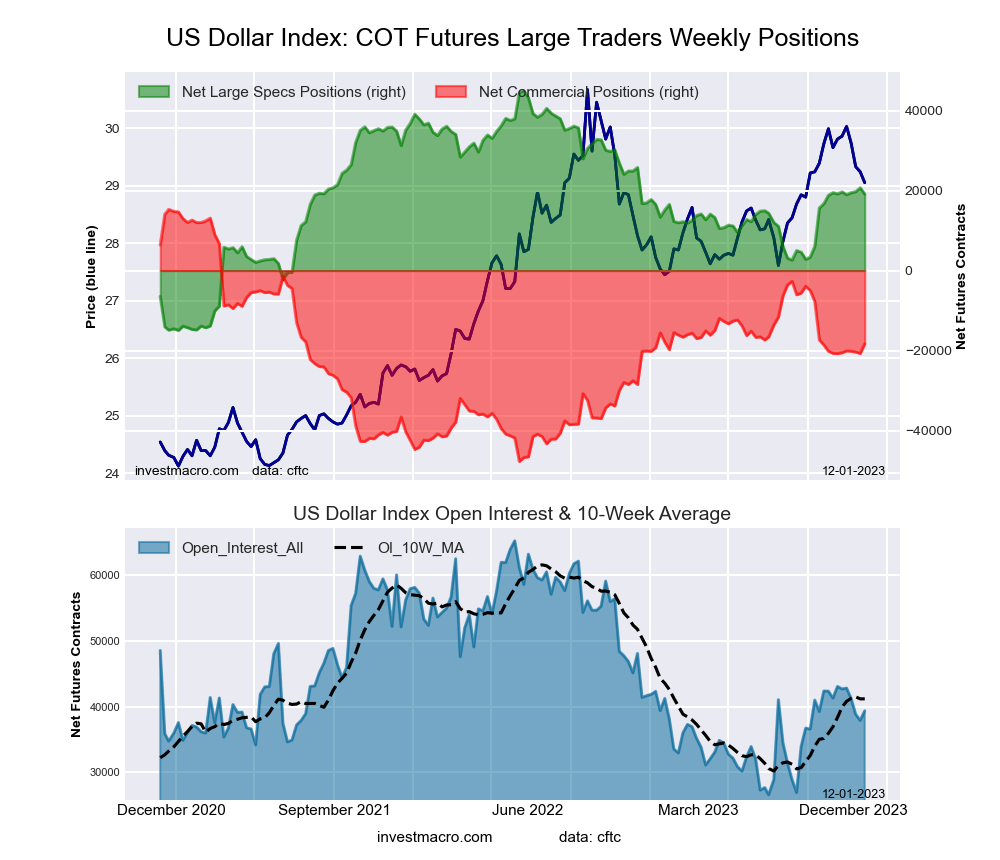 The US Dollar Index large speculator standing this week came in at a net position of 19,087 contracts in the data reported through Tuesday. This was a weekly fall of -1,610 contracts from the previous week which had a total of 20,697 net contracts.
This week’s current strength score (the trader positioning range over the past three years, measured from 0 to 100) shows the speculators are currently Bullish with a score of 56.8 percent. The commercials are Bearish with a score of 46.7 percent and the small traders (not shown in chart) are Bearish-Extreme with a score of 0.0 percent.
Price Trend-Following Model: Uptrend
Our weekly trend-following model classifies the current market price position as: Uptrend. The current action for the model is considered to be: Hold – Maintain Long Position.
| US DOLLAR INDEX Statistics | SPECULATORS | COMMERCIALS | SMALL TRADERS |
| – Percent of Open Interest Longs: | 73.2 | 17.1 | 6.9 |
| – Percent of Open Interest Shorts: | 24.7 | 63.6 | 9.0 |
| – Net Position: | 19,087 | -18,292 | -795 |
| – Gross Longs: | 28,798 | 6,746 | 2,735 |
| – Gross Shorts: | 9,711 | 25,038 | 3,530 |
| – Long to Short Ratio: | 3.0 to 1 | 0.3 to 1 | 0.8 to 1 |
| NET POSITION TREND: | | | |
| – Strength Index Score (3 Year Range Pct): | 56.8 | 46.7 | 0.0 |
| – Strength Index Reading (3 Year Range): | Bullish | Bearish | Bearish-Extreme |
| NET POSITION MOVEMENT INDEX: | | | |
| – 6-Week Change in Strength Index: | -0.1 | 3.9 | -28.5 |
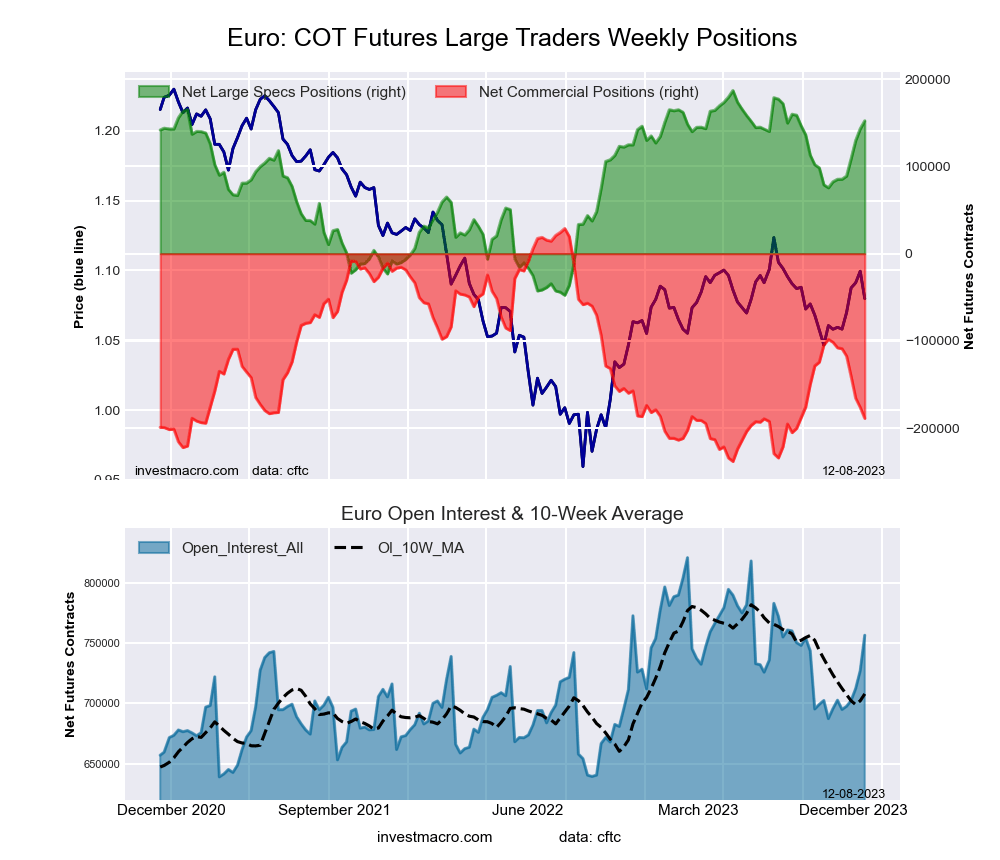
Euro Currency Futures:
 The Euro Currency large speculator standing this week came in at a net position of 143,165 contracts in the data reported through Tuesday. This was a weekly gain of 13,511 contracts from the previous week which had a total of 129,654 net contracts.
This week’s current strength score (the trader positioning range over the past three years, measured from 0 to 100) shows the speculators are currently Bullish-Extreme with a score of 81.3 percent. The commercials are Bearish with a score of 23.2 percent and the small traders (not shown in chart) are Bearish with a score of 31.9 percent.
Price Trend-Following Model: Weak Downtrend (Possible Trend Change)
Our weekly trend-following model classifies the current market price position as: Weak Downtrend. The current action for the model is considered to be: Hold – Maintain Short Position.
| EURO Currency Statistics | SPECULATORS | COMMERCIALS | SMALL TRADERS |
| – Percent of Open Interest Longs: | 32.1 | 53.5 | 11.4 |
| – Percent of Open Interest Shorts: | 12.4 | 77.7 | 6.8 |
| – Net Position: | 143,165 | -176,315 | 33,150 |
| – Gross Longs: | 233,454 | 388,784 | 82,613 |
| – Gross Shorts: | 90,289 | 565,099 | 49,463 |
| – Long to Short Ratio: | 2.6 to 1 | 0.7 to 1 | 1.7 to 1 |
| NET POSITION TREND: | | | |
| – Strength Index Score (3 Year Range Pct): | 81.3 | 23.2 | 31.9 |
| – Strength Index Reading (3 Year Range): | Bullish-Extreme | Bearish | Bearish |
| NET POSITION MOVEMENT INDEX: | | | |
| – 6-Week Change in Strength Index: | 25.9 | -28.0 | 22.2 |
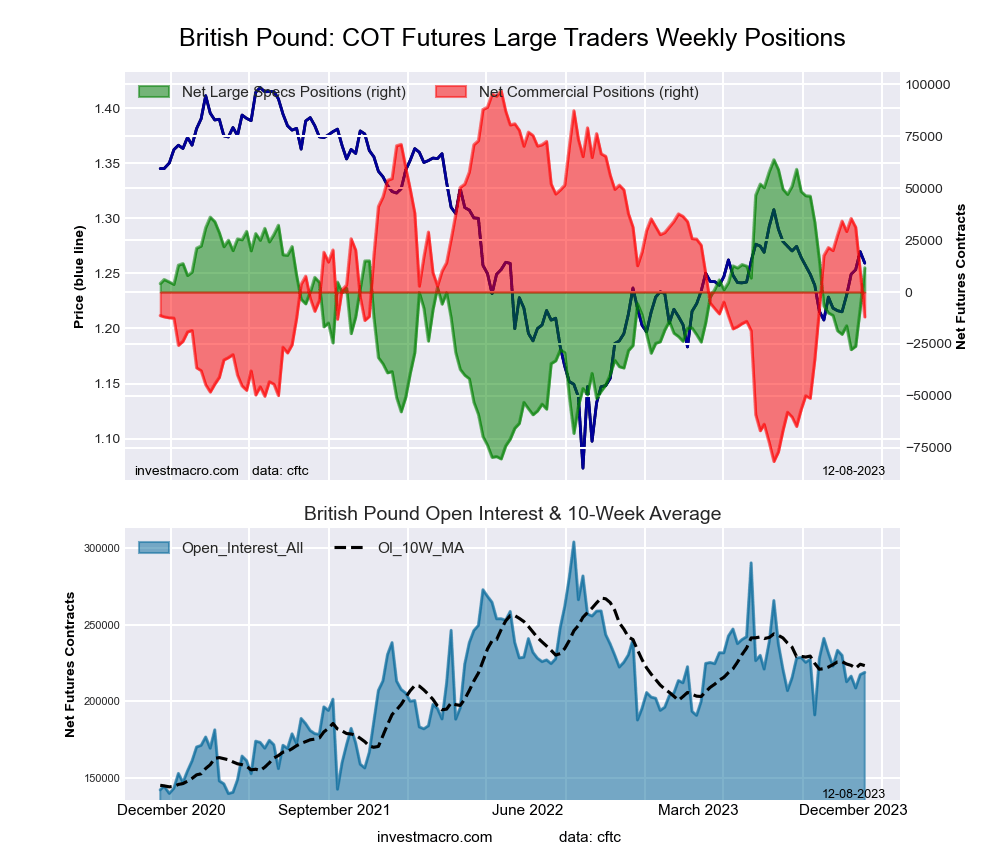
British Pound Sterling Futures:
 The British Pound Sterling large speculator standing this week came in at a net position of -7,895 contracts in the data reported through Tuesday. This was a weekly advance of 18,203 contracts from the previous week which had a total of -26,098 net contracts.
This week’s current strength score (the trader positioning range over the past three years, measured from 0 to 100) shows the speculators are currently Bullish with a score of 50.3 percent. The commercials are Bullish with a score of 51.3 percent and the small traders (not shown in chart) are Bullish with a score of 53.8 percent.
Price Trend-Following Model: Weak Downtrend (Possible Trend Change)
Our weekly trend-following model classifies the current market price position as: Weak Downtrend. The current action for the model is considered to be: Hold – Maintain Short Position.
| BRITISH POUND Statistics | SPECULATORS | COMMERCIALS | SMALL TRADERS |
| – Percent of Open Interest Longs: | 28.2 | 54.4 | 12.0 |
| – Percent of Open Interest Shorts: | 31.8 | 49.8 | 13.0 |
| – Net Position: | -7,895 | 10,064 | -2,169 |
| – Gross Longs: | 61,296 | 118,253 | 26,067 |
| – Gross Shorts: | 69,191 | 108,189 | 28,236 |
| – Long to Short Ratio: | 0.9 to 1 | 1.1 to 1 | 0.9 to 1 |
| NET POSITION TREND: | | | |
| – Strength Index Score (3 Year Range Pct): | 50.3 | 51.3 | 53.8 |
| – Strength Index Reading (3 Year Range): | Bullish | Bullish | Bullish |
| NET POSITION MOVEMENT INDEX: | | | |
| – 6-Week Change in Strength Index: | 2.3 | -5.5 | 12.9 |
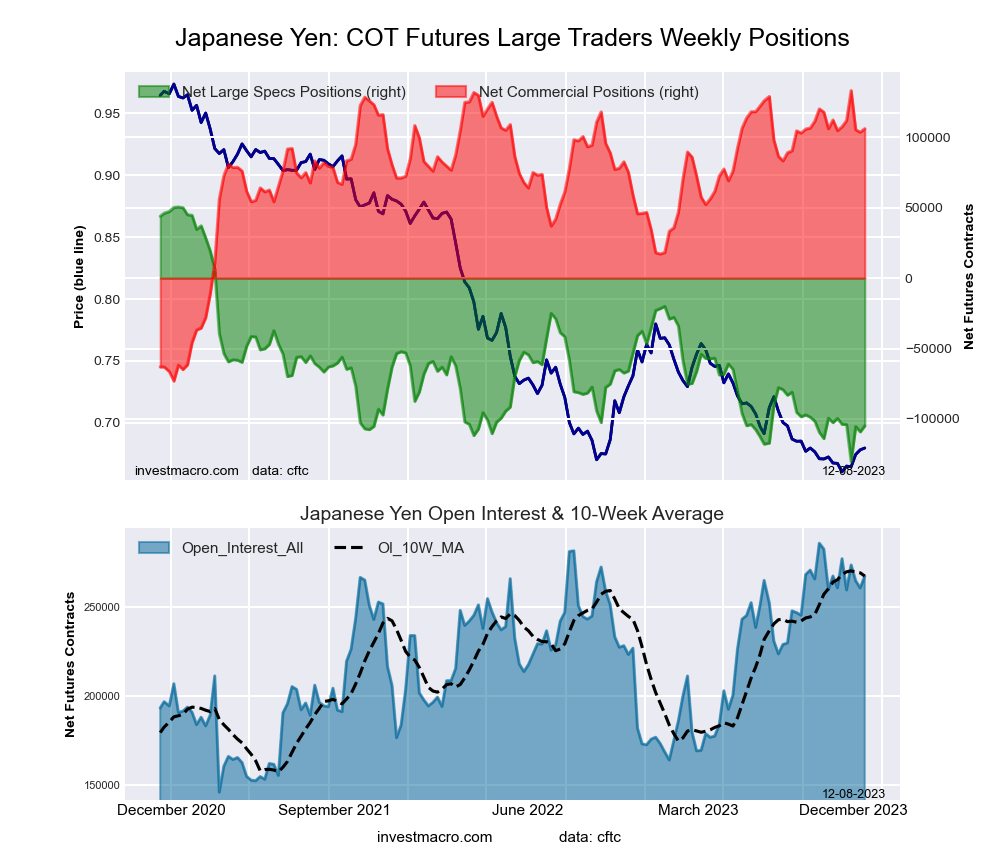
Japanese Yen Futures:
 The Japanese Yen large speculator standing this week came in at a net position of -109,237 contracts in the data reported through Tuesday. This was a weekly reduction of -3,783 contracts from the previous week which had a total of -105,454 net contracts.
This week’s current strength score (the trader positioning range over the past three years, measured from 0 to 100) shows the speculators are currently Bearish-Extreme with a score of 11.6 percent. The commercials are Bullish-Extreme with a score of 85.7 percent and the small traders (not shown in chart) are Bullish with a score of 64.7 percent.
Price Trend-Following Model: Weak Downtrend (Possible Trend Change)
Our weekly trend-following model classifies the current market price position as: Weak Downtrend. The current action for the model is considered to be: Hold – Maintain Short Position.
| JAPANESE YEN Statistics | SPECULATORS | COMMERCIALS | SMALL TRADERS |
| – Percent of Open Interest Longs: | 11.7 | 69.1 | 17.0 |
| – Percent of Open Interest Shorts: | 53.6 | 29.3 | 14.9 |
| – Net Position: | -109,237 | 103,692 | 5,545 |
| – Gross Longs: | 30,461 | 180,134 | 44,382 |
| – Gross Shorts: | 139,698 | 76,442 | 38,837 |
| – Long to Short Ratio: | 0.2 to 1 | 2.4 to 1 | 1.1 to 1 |
| NET POSITION TREND: | | | |
| – Strength Index Score (3 Year Range Pct): | 11.6 | 85.7 | 64.7 |
| – Strength Index Reading (3 Year Range): | Bearish-Extreme | Bullish-Extreme | Bullish |
| NET POSITION MOVEMENT INDEX: | | | |
| – 6-Week Change in Strength Index: | -3.6 | -4.2 | 31.0 |
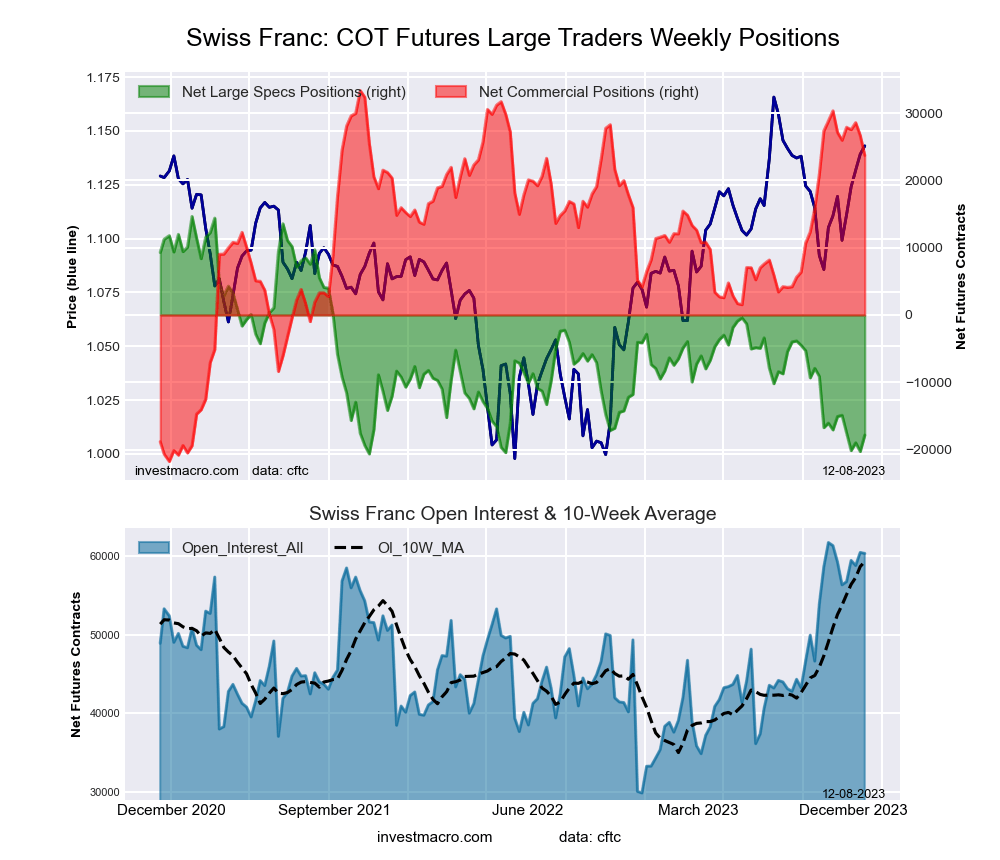
Swiss Franc Futures:
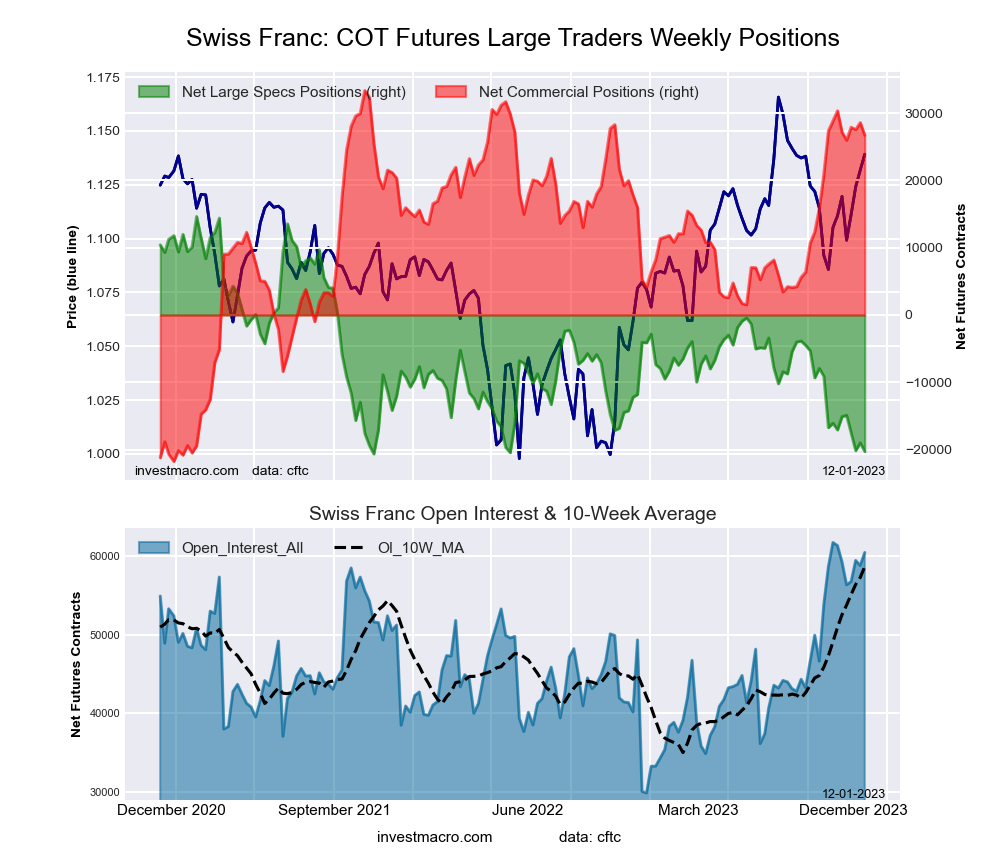 The Swiss Franc large speculator standing this week came in at a net position of -20,289 contracts in the data reported through Tuesday. This was a weekly lowering of -1,295 contracts from the previous week which had a total of -18,994 net contracts.
This week’s current strength score (the trader positioning range over the past three years, measured from 0 to 100) shows the speculators are currently Bearish-Extreme with a score of 1.0 percent. The commercials are Bullish-Extreme with a score of 87.9 percent and the small traders (not shown in chart) are Bearish with a score of 38.1 percent.
Price Trend-Following Model: Weak Downtrend (Possible Trend Change)
Our weekly trend-following model classifies the current market price position as: Weak Downtrend. The current action for the model is considered to be: Hold – Maintain Short Position.
| SWISS FRANC Statistics | SPECULATORS | COMMERCIALS | SMALL TRADERS |
| – Percent of Open Interest Longs: | 7.1 | 73.0 | 19.4 |
| – Percent of Open Interest Shorts: | 40.7 | 28.9 | 30.0 |
| – Net Position: | -20,289 | 26,691 | -6,402 |
| – Gross Longs: | 4,300 | 44,145 | 11,754 |
| – Gross Shorts: | 24,589 | 17,454 | 18,156 |
| – Long to Short Ratio: | 0.2 to 1 | 2.5 to 1 | 0.6 to 1 |
| NET POSITION TREND: | | | |
| – Strength Index Score (3 Year Range Pct): | 1.0 | 87.9 | 38.1 |
| – Strength Index Reading (3 Year Range): | Bearish-Extreme | Bullish-Extreme | Bearish |
| NET POSITION MOVEMENT INDEX: | | | |
| – 6-Week Change in Strength Index: | -9.1 | -6.6 | 24.7 |
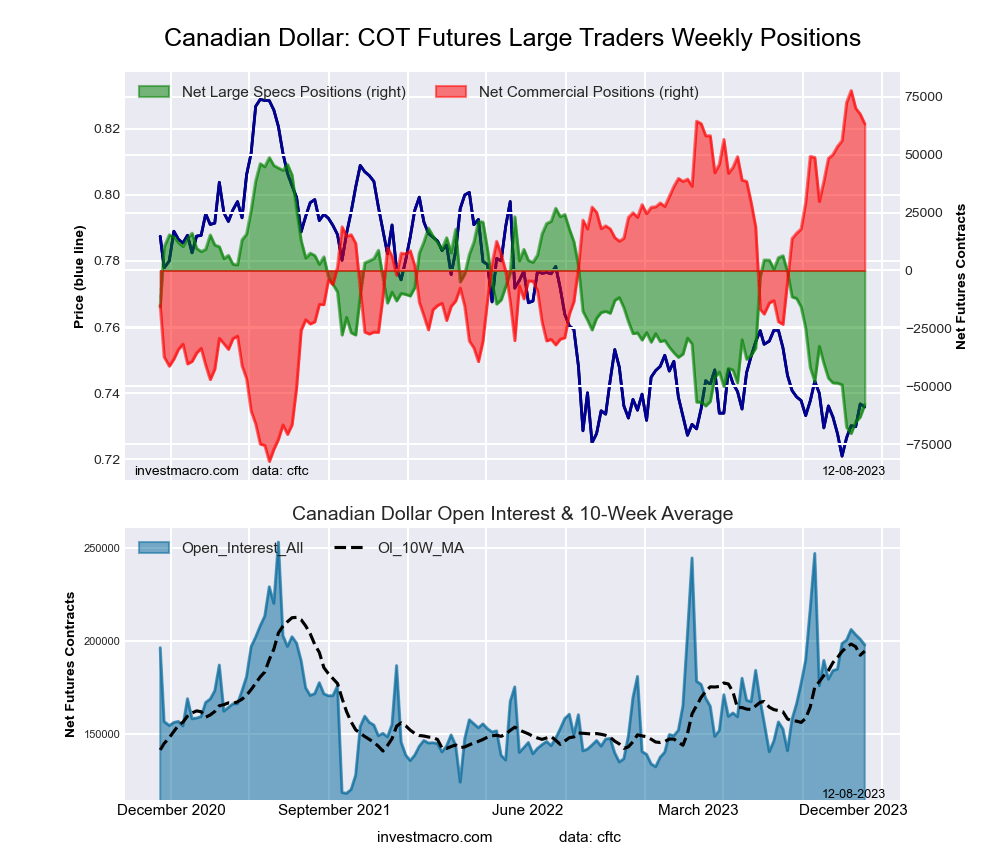
Canadian Dollar Futures:
 The Canadian Dollar large speculator standing this week came in at a net position of -63,242 contracts in the data reported through Tuesday. This was a weekly boost of 2,198 contracts from the previous week which had a total of -65,440 net contracts.
This week’s current strength score (the trader positioning range over the past three years, measured from 0 to 100) shows the speculators are currently Bearish-Extreme with a score of 6.0 percent. The commercials are Bullish-Extreme with a score of 93.7 percent and the small traders (not shown in chart) are Bearish-Extreme with a score of 13.3 percent.
Price Trend-Following Model: Weak Downtrend (Possible Trend Change)
Our weekly trend-following model classifies the current market price position as: Weak Downtrend. The current action for the model is considered to be: Hold – Maintain Short Position.
| CANADIAN DOLLAR Statistics | SPECULATORS | COMMERCIALS | SMALL TRADERS |
| – Percent of Open Interest Longs: | 9.5 | 71.4 | 15.2 |
| – Percent of Open Interest Shorts: | 40.9 | 37.8 | 17.3 |
| – Net Position: | -63,242 | 67,537 | -4,295 |
| – Gross Longs: | 18,991 | 143,464 | 30,505 |
| – Gross Shorts: | 82,233 | 75,927 | 34,800 |
| – Long to Short Ratio: | 0.2 to 1 | 1.9 to 1 | 0.9 to 1 |
| NET POSITION TREND: | | | |
| – Strength Index Score (3 Year Range Pct): | 6.0 | 93.7 | 13.3 |
| – Strength Index Reading (3 Year Range): | Bearish-Extreme | Bullish-Extreme | Bearish-Extreme |
| NET POSITION MOVEMENT INDEX: | | | |
| – 6-Week Change in Strength Index: | -12.3 | 10.9 | -6.1 |
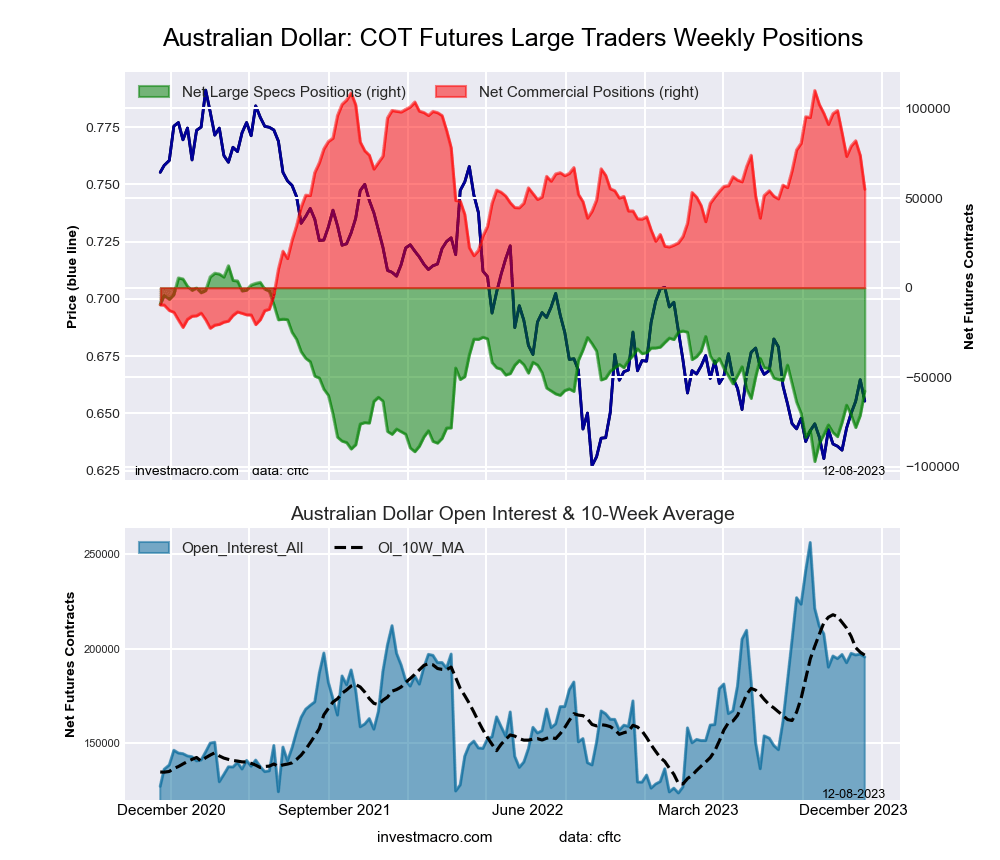
Australian Dollar Futures:
 The Australian Dollar large speculator standing this week came in at a net position of -71,219 contracts in the data reported through Tuesday. This was a weekly advance of 6,751 contracts from the previous week which had a total of -77,970 net contracts.
This week’s current strength score (the trader positioning range over the past three years, measured from 0 to 100) shows the speculators are currently Bearish with a score of 23.6 percent. The commercials are Bullish with a score of 72.7 percent and the small traders (not shown in chart) are Bearish with a score of 46.2 percent.
Price Trend-Following Model: Weak Downtrend (Possible Trend Change)
Our weekly trend-following model classifies the current market price position as: Weak Downtrend. The current action for the model is considered to be: Hold – Maintain Short Position.
| AUSTRALIAN DOLLAR Statistics | SPECULATORS | COMMERCIALS | SMALL TRADERS |
| – Percent of Open Interest Longs: | 14.8 | 66.6 | 12.4 |
| – Percent of Open Interest Shorts: | 51.0 | 29.1 | 13.7 |
| – Net Position: | -71,219 | 73,789 | -2,570 |
| – Gross Longs: | 29,203 | 131,213 | 24,361 |
| – Gross Shorts: | 100,422 | 57,424 | 26,931 |
| – Long to Short Ratio: | 0.3 to 1 | 2.3 to 1 | 0.9 to 1 |
| NET POSITION TREND: | | | |
| – Strength Index Score (3 Year Range Pct): | 23.6 | 72.7 | 46.2 |
| – Strength Index Reading (3 Year Range): | Bearish | Bullish | Bearish |
| NET POSITION MOVEMENT INDEX: | | | |
| – 6-Week Change in Strength Index: | 8.7 | -17.6 | 33.7 |
New Zealand Dollar Futures:
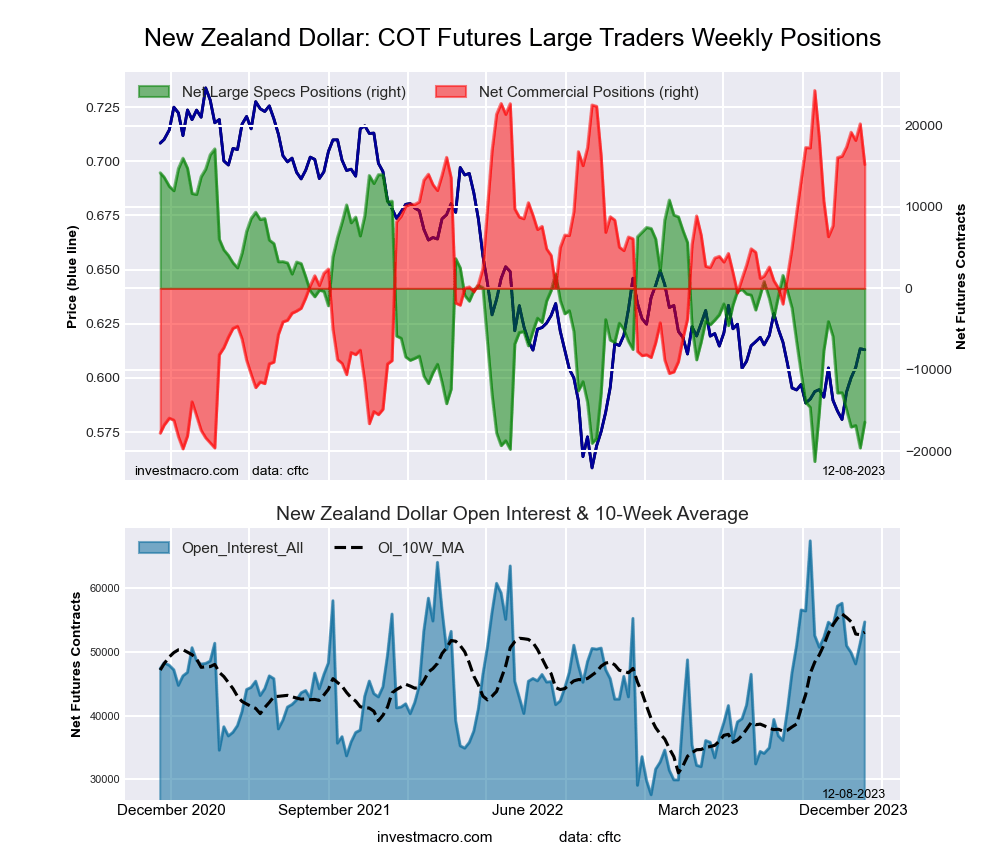
 The New Zealand Dollar large speculator standing this week came in at a net position of -19,609 contracts in the data reported through Tuesday. This was a weekly fall of -2,755 contracts from the previous week which had a total of -16,854 net contracts.
This week’s current strength score (the trader positioning range over the past three years, measured from 0 to 100) shows the speculators are currently Bearish-Extreme with a score of 4.3 percent. The commercials are Bullish-Extreme with a score of 90.7 percent and the small traders (not shown in chart) are Bearish with a score of 42.9 percent.
Price Trend-Following Model: Weak Downtrend (Possible Trend Change)
Our weekly trend-following model classifies the current market price position as: Weak Downtrend. The current action for the model is considered to be: Hold – Maintain Short Position.
| NEW ZEALAND DOLLAR Statistics | SPECULATORS | COMMERCIALS | SMALL TRADERS |
| – Percent of Open Interest Longs: | 19.6 | 71.7 | 7.2 |
| – Percent of Open Interest Shorts: | 57.7 | 32.4 | 8.4 |
| – Net Position: | -19,609 | 20,208 | -599 |
| – Gross Longs: | 10,104 | 36,898 | 3,703 |
| – Gross Shorts: | 29,713 | 16,690 | 4,302 |
| – Long to Short Ratio: | 0.3 to 1 | 2.2 to 1 | 0.9 to 1 |
| NET POSITION TREND: | | | |
| – Strength Index Score (3 Year Range Pct): | 4.3 | 90.7 | 42.9 |
| – Strength Index Reading (3 Year Range): | Bearish-Extreme | Bullish-Extreme | Bearish |
| NET POSITION MOVEMENT INDEX: | | | |
| – 6-Week Change in Strength Index: | -35.7 | 28.5 | 13.8 |
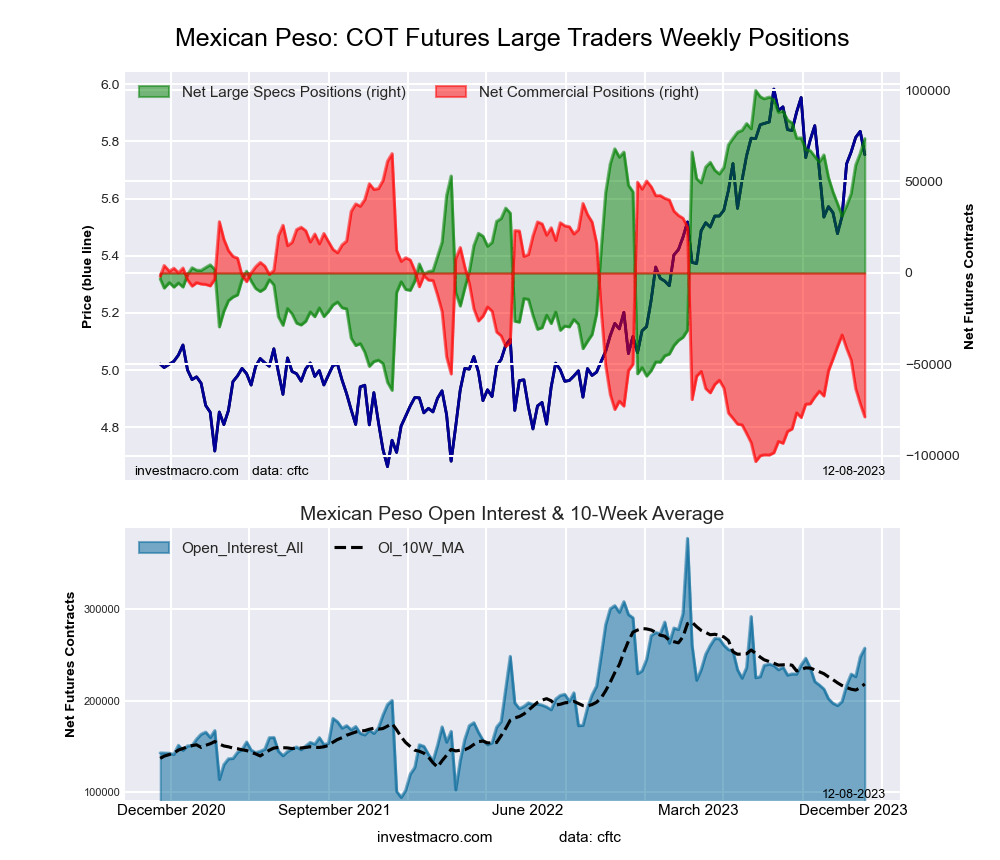
Mexican Peso Futures:
 The Mexican Peso large speculator standing this week came in at a net position of 65,485 contracts in the data reported through Tuesday. This was a weekly boost of 6,554 contracts from the previous week which had a total of 58,931 net contracts.
This week’s current strength score (the trader positioning range over the past three years, measured from 0 to 100) shows the speculators are currently Bullish with a score of 79.1 percent. The commercials are Bearish-Extreme with a score of 18.8 percent and the small traders (not shown in chart) are Bearish with a score of 49.2 percent.
Price Trend-Following Model: Weak Downtrend (Possible Trend Change)
Our weekly trend-following model classifies the current market price position as: Weak Downtrend. The current action for the model is considered to be: Hold – Maintain Short Position.
| MEXICAN PESO Statistics | SPECULATORS | COMMERCIALS | SMALL TRADERS |
| – Percent of Open Interest Longs: | 42.8 | 53.1 | 3.2 |
| – Percent of Open Interest Shorts: | 16.3 | 82.0 | 0.8 |
| – Net Position: | 65,485 | -71,441 | 5,956 |
| – Gross Longs: | 105,838 | 131,543 | 7,840 |
| – Gross Shorts: | 40,353 | 202,984 | 1,884 |
| – Long to Short Ratio: | 2.6 to 1 | 0.6 to 1 | 4.2 to 1 |
| NET POSITION TREND: | | | |
| – Strength Index Score (3 Year Range Pct): | 79.1 | 18.8 | 49.2 |
| – Strength Index Reading (3 Year Range): | Bullish | Bearish-Extreme | Bearish |
| NET POSITION MOVEMENT INDEX: | | | |
| – 6-Week Change in Strength Index: | 12.9 | -14.5 | 20.8 |
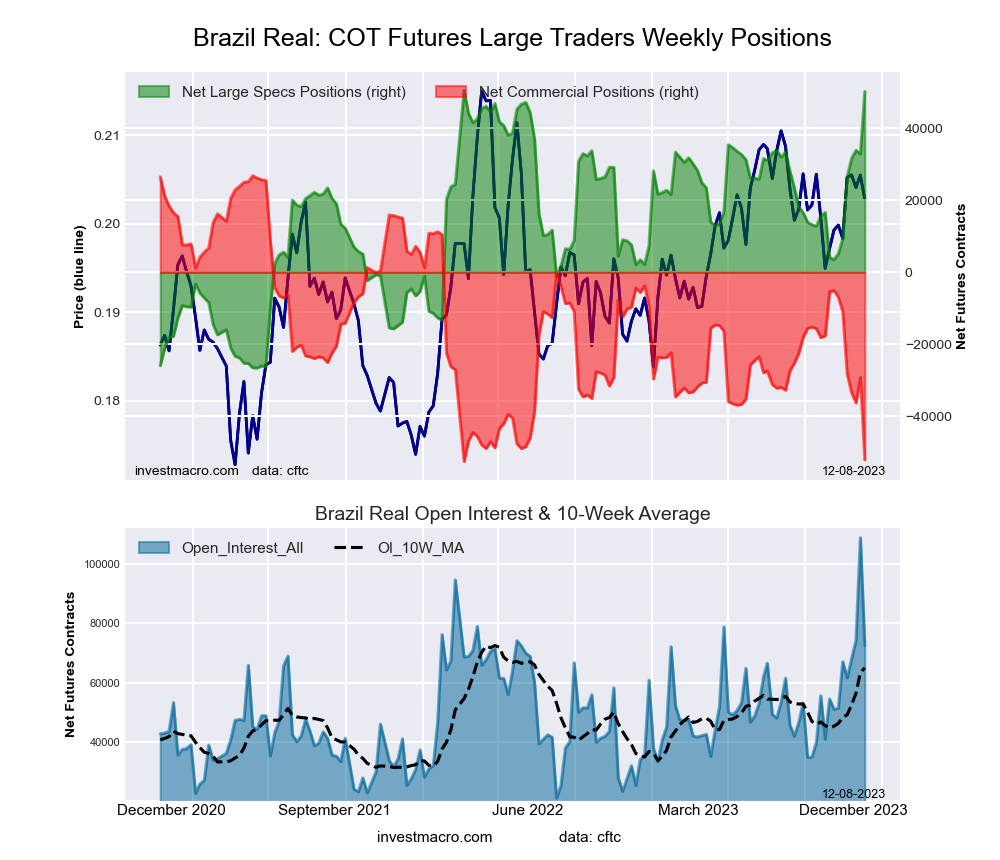
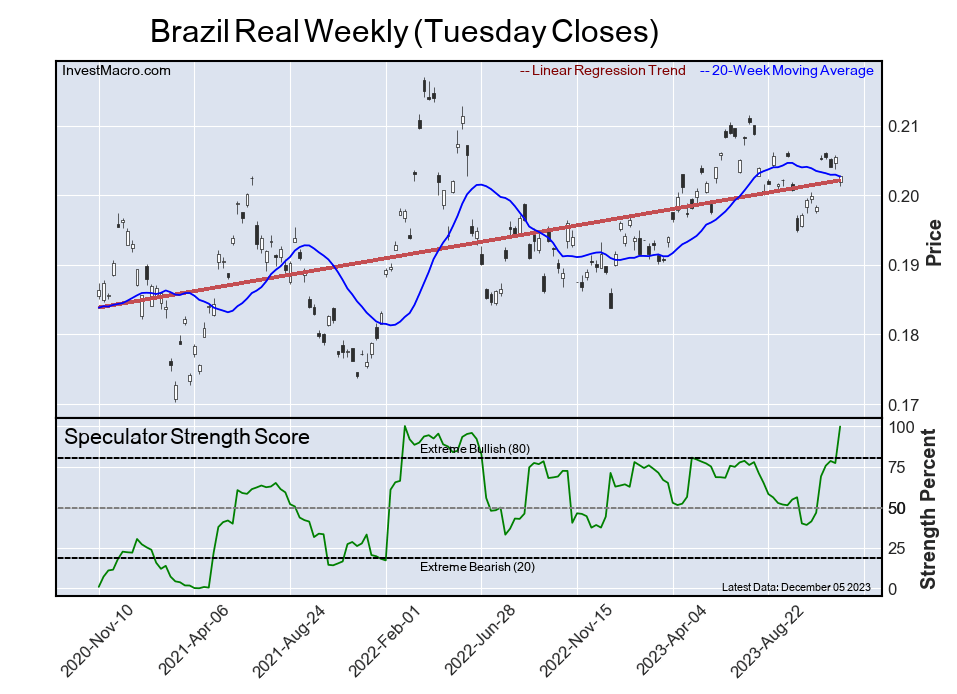
Brazilian Real Futures:
 The Brazilian Real large speculator standing this week came in at a net position of 32,881 contracts in the data reported through Tuesday. This was a weekly reduction of -1,001 contracts from the previous week which had a total of 33,882 net contracts.
This week’s current strength score (the trader positioning range over the past three years, measured from 0 to 100) shows the speculators are currently Bullish with a score of 77.1 percent. The commercials are Bearish with a score of 29.4 percent and the small traders (not shown in chart) are Bearish-Extreme with a score of 0.4 percent.
Price Trend-Following Model: Weak Downtrend (Possible Trend Change)
Our weekly trend-following model classifies the current market price position as: Weak Downtrend. The current action for the model is considered to be: Hold – Maintain Short Position.
| BRAZIL REAL Statistics | SPECULATORS | COMMERCIALS | SMALL TRADERS |
| – Percent of Open Interest Longs: | 48.1 | 45.7 | 3.6 |
| – Percent of Open Interest Shorts: | 17.8 | 72.5 | 7.0 |
| – Net Position: | 32,881 | -29,230 | -3,651 |
| – Gross Longs: | 52,260 | 49,664 | 3,934 |
| – Gross Shorts: | 19,379 | 78,894 | 7,585 |
| – Long to Short Ratio: | 2.7 to 1 | 0.6 to 1 | 0.5 to 1 |
| NET POSITION TREND: | | | |
| – Strength Index Score (3 Year Range Pct): | 77.1 | 29.4 | 0.4 |
| – Strength Index Reading (3 Year Range): | Bullish | Bearish | Bearish-Extreme |
| NET POSITION MOVEMENT INDEX: | | | |
| – 6-Week Change in Strength Index: | 38.1 | -30.4 | -48.6 |
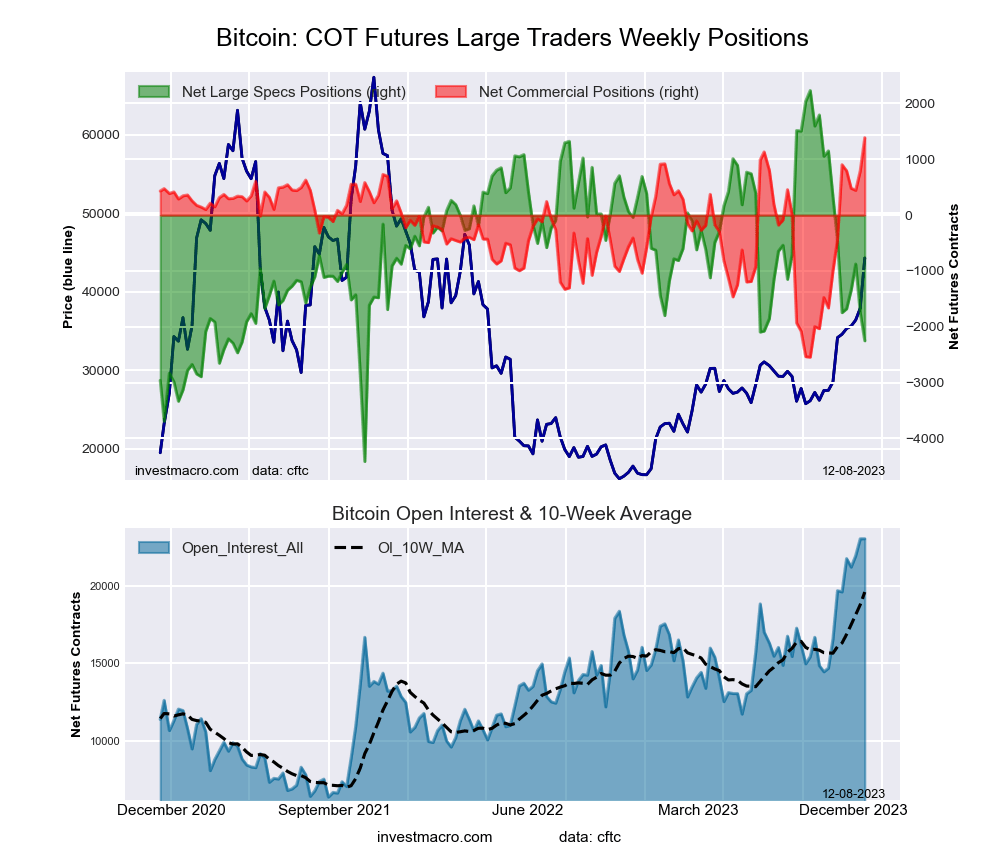
Bitcoin Futures:
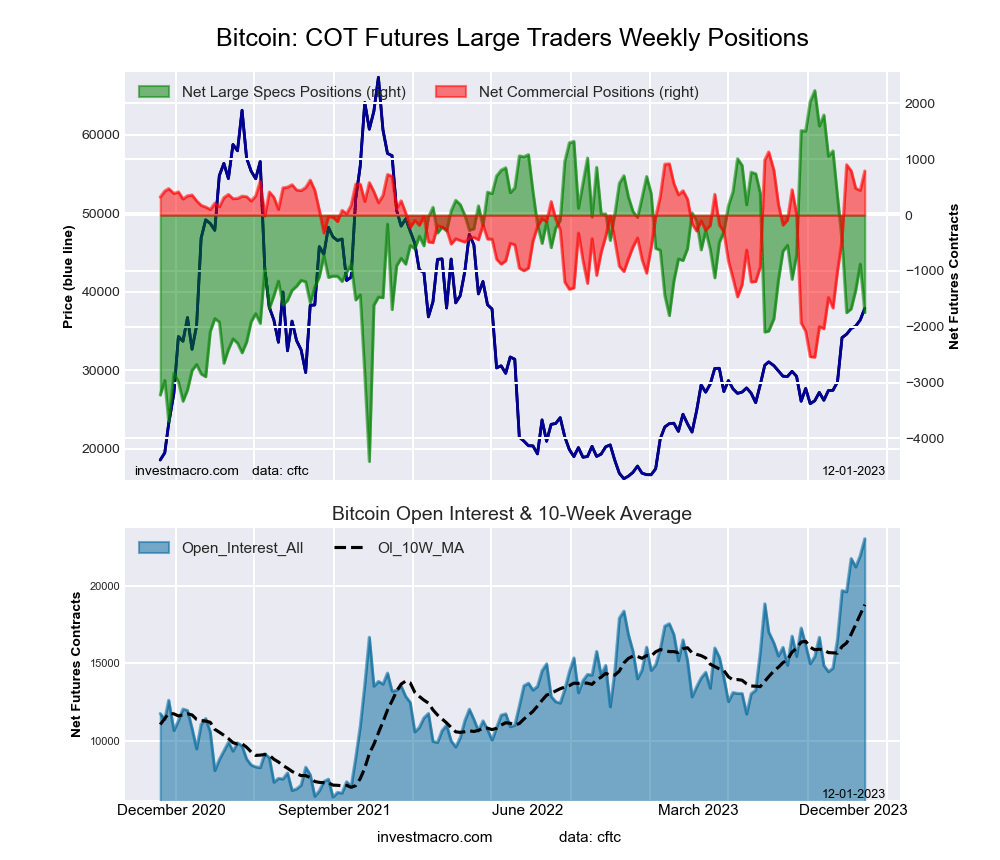 The Bitcoin large speculator standing this week came in at a net position of -1,745 contracts in the data reported through Tuesday. This was a weekly fall of -869 contracts from the previous week which had a total of -876 net contracts.
This week’s current strength score (the trader positioning range over the past three years, measured from 0 to 100) shows the speculators are currently Bearish with a score of 40.1 percent. The commercials are Bullish-Extreme with a score of 90.7 percent and the small traders (not shown in chart) are Bearish with a score of 34.6 percent.
Price Trend-Following Model: Strong Uptrend
Our weekly trend-following model classifies the current market price position as: Strong Uptrend. The current action for the model is considered to be: Hold – Maintain Long Position.
| BITCOIN Statistics | SPECULATORS | COMMERCIALS | SMALL TRADERS |
| – Percent of Open Interest Longs: | 82.4 | 5.8 | 7.3 |
| – Percent of Open Interest Shorts: | 90.0 | 2.4 | 3.2 |
| – Net Position: | -1,745 | 792 | 953 |
| – Gross Longs: | 18,979 | 1,344 | 1,688 |
| – Gross Shorts: | 20,724 | 552 | 735 |
| – Long to Short Ratio: | 0.9 to 1 | 2.4 to 1 | 2.3 to 1 |
| NET POSITION TREND: | | | |
| – Strength Index Score (3 Year Range Pct): | 40.1 | 90.7 | 34.6 |
| – Strength Index Reading (3 Year Range): | Bearish | Bullish-Extreme | Bearish |
| NET POSITION MOVEMENT INDEX: | | | |
| – 6-Week Change in Strength Index: | -31.2 | 48.6 | 6.5 |
Article By InvestMacro – Receive our weekly COT Newsletter
*COT Report: The COT data, released weekly to the public each Friday, is updated through the most recent Tuesday (data is 3 days old) and shows a quick view of how large speculators or non-commercials (for-profit traders) were positioned in the futures markets.
The CFTC categorizes trader positions according to commercial hedgers (traders who use futures contracts for hedging as part of the business), non-commercials (large traders who speculate to realize trading profits) and nonreportable traders (usually small traders/speculators) as well as their open interest (contracts open in the market at time of reporting). See CFTC criteria here.


