
By InvestMacro
Here are the latest charts and statistics for the Commitment of Traders (COT) data published by the Commodities Futures Trading Commission (CFTC).
The latest COT data is updated through Tuesday December 5th and shows a quick view of how large traders (for-profit speculators and commercial entities) were positioned in the futures markets.
Weekly Speculator Changes led by Gold & Silver
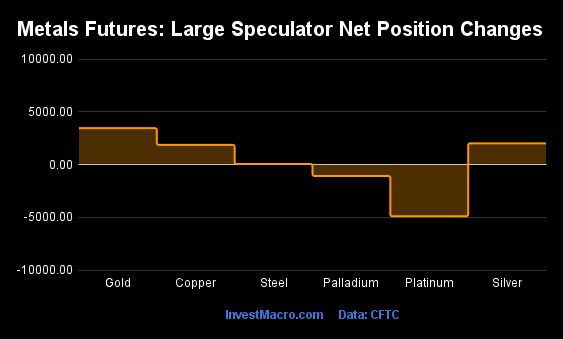
The COT metals markets speculator bets were higher this week as four out of the six metals markets we cover had higher positioning while the other two markets had lower speculator contracts.
Free Reports:
 Get our Weekly Commitment of Traders Reports - See where the biggest traders (Hedge Funds and Commercial Hedgers) are positioned in the futures markets on a weekly basis.
 Sign Up for Our Stock Market Newsletter – Get updated on News, Charts & Rankings of Public Companies when you join our Stocks Newsletter
Leading the gains for the metals was Gold (3,460 contracts) with Silver (2,023 contracts), Copper (1,878 contracts) and Steel (66 contracts) also recording positive weeks.
The markets with declines in speculator bets for the week were Platinum (-4,901 contracts) with Palladium (-1,081 contracts) also seeing lower bets on the week.
| Dec-05-2023 | OI | OI-Index | Spec-Net | Spec-Index | Com-Net | COM-Index | Smalls-Net | Smalls-Index |
|---|---|---|---|---|---|---|---|---|
| Gold | 487,469 | 30 | 203,544 | 67 | -226,945 | 36 | 23,401 | 43 |
| Silver | 139,753 | 32 | 36,303 | 70 | -52,014 | 31 | 15,711 | 54 |
| Copper | 176,373 | 24 | -1,994 | 30 | 2,139 | 73 | -145 | 18 |
| Palladium | 21,271 | 72 | -11,252 | 2 | 11,277 | 99 | -25 | 40 |
| Platinum | 75,508 | 67 | 5,133 | 27 | -9,183 | 74 | 4,050 | 22 |
Strength Scores led by Steel & Silver
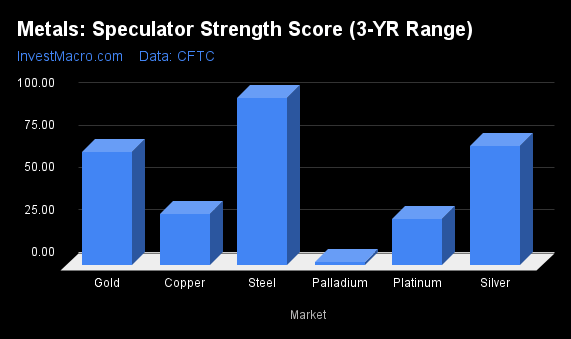
COT Strength Scores (a normalized measure of Speculator positions over a 3-Year range, from 0 to 100 where above 80 is Extreme-Bullish and below 20 is Extreme-Bearish) showed that Steel (99 percent) and Silver (70 percent) lead the metals markets this week. comes in as the next highest in the weekly strength scores.
On the downside, Palladium (2 percent) comes in at the lowest strength level currently and is in Extreme-Bearish territory (below 20 percent). The next lowest strength scores were Platinum (27 percent) and Copper (30 percent).
Strength Statistics:
Gold (66.7 percent) vs Gold previous week (65.1 percent)
Silver (70.1 percent) vs Silver previous week (67.2 percent)
Copper (30.3 percent) vs Copper previous week (28.6 percent)
Platinum (27.4 percent) vs Platinum previous week (38.7 percent)
Palladium (1.6 percent) vs Palladium previous week (8.7 percent)
Steel (98.8 percent) vs Palladium previous week (98.6 percent)
Gold & Steel top the 6-Week Strength Trends
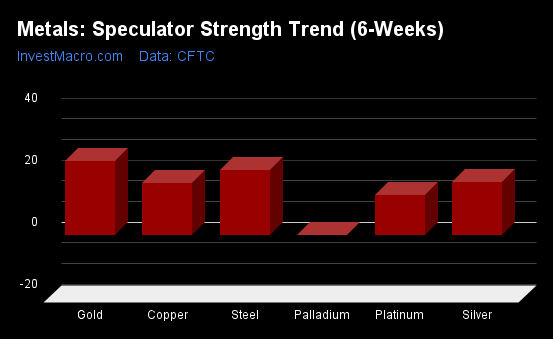
COT Strength Score Trends (or move index, calculates the 6-week changes in strength scores) showed that Gold (24 percent) and Steel (21 percent) lead the past six weeks trends for metals.
Palladium (-0.1 percent) leads the downside trend scores currently with Palladium (0 percent) as the next market with lower trend scores.
Move Statistics:
Gold (23.8 percent) vs Gold previous week (38.4 percent)
Silver (17.1 percent) vs Silver previous week (20.7 percent)
Copper (16.9 percent) vs Copper previous week (19.8 percent)
Platinum (13.0 percent) vs Platinum previous week (22.4 percent)
Palladium (-0.1 percent) vs Palladium previous week (8.7 percent)
Steel (20.9 percent) vs Steel previous week (21.8 percent)
Individual Markets:
Gold Comex Futures:
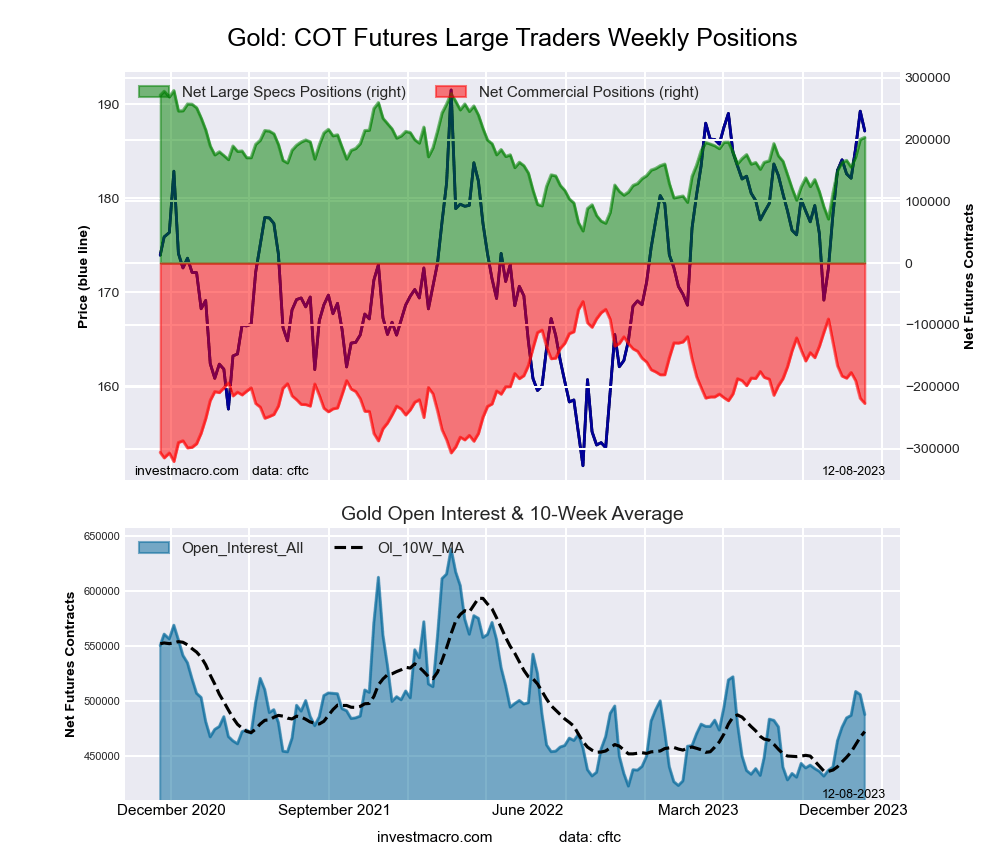 The Gold Comex Futures large speculator standing this week came in at a net position of 203,544 contracts in the data reported through Tuesday. This was a weekly gain of 3,460 contracts from the previous week which had a total of 200,084 net contracts.
This week’s current strength score (the trader positioning range over the past three years, measured from 0 to 100) shows the speculators are currently Bullish with a score of 66.7 percent. The commercials are Bearish with a score of 36.3 percent and the small traders (not shown in chart) are Bearish with a score of 42.6 percent.
Price Trend-Following Model: Strong Uptrend
Our weekly trend-following model classifies the current market price position as: Strong Uptrend. The current action for the model is considered to be: Hold – Maintain Long Position.
| Gold Futures Statistics | SPECULATORS | COMMERCIALS | SMALL TRADERS |
| – Percent of Open Interest Longs: | 59.3 | 21.2 | 9.7 |
| – Percent of Open Interest Shorts: | 17.5 | 67.7 | 4.9 |
| – Net Position: | 203,544 | -226,945 | 23,401 |
| – Gross Longs: | 288,840 | 103,193 | 47,483 |
| – Gross Shorts: | 85,296 | 330,138 | 24,082 |
| – Long to Short Ratio: | 3.4 to 1 | 0.3 to 1 | 2.0 to 1 |
| NET POSITION TREND: | |||
| – Strength Index Score (3 Year Range Pct): | 66.7 | 36.3 | 42.6 |
| – Strength Index Reading (3 Year Range): | Bullish | Bearish | Bearish |
| NET POSITION MOVEMENT INDEX: | |||
| – 6-Week Change in Strength Index: | 23.8 | -23.6 | 19.2 |
Silver Comex Futures:
 The Silver Comex Futures large speculator standing this week came in at a net position of 36,303 contracts in the data reported through Tuesday. This was a weekly lift of 2,023 contracts from the previous week which had a total of 34,280 net contracts.
This week’s current strength score (the trader positioning range over the past three years, measured from 0 to 100) shows the speculators are currently Bullish with a score of 70.1 percent. The commercials are Bearish with a score of 30.9 percent and the small traders (not shown in chart) are Bullish with a score of 53.8 percent.
Price Trend-Following Model: Strong Uptrend
Our weekly trend-following model classifies the current market price position as: Strong Uptrend. The current action for the model is considered to be: New Buy – Long Position.
| Silver Futures Statistics | SPECULATORS | COMMERCIALS | SMALL TRADERS |
| – Percent of Open Interest Longs: | 45.3 | 29.3 | 18.9 |
| – Percent of Open Interest Shorts: | 19.3 | 66.5 | 7.6 |
| – Net Position: | 36,303 | -52,014 | 15,711 |
| – Gross Longs: | 63,241 | 40,974 | 26,387 |
| – Gross Shorts: | 26,938 | 92,988 | 10,676 |
| – Long to Short Ratio: | 2.3 to 1 | 0.4 to 1 | 2.5 to 1 |
| NET POSITION TREND: | |||
| – Strength Index Score (3 Year Range Pct): | 70.1 | 30.9 | 53.8 |
| – Strength Index Reading (3 Year Range): | Bullish | Bearish | Bullish |
| NET POSITION MOVEMENT INDEX: | |||
| – 6-Week Change in Strength Index: | 17.1 | -21.1 | 30.6 |
Copper Grade #1 Futures:
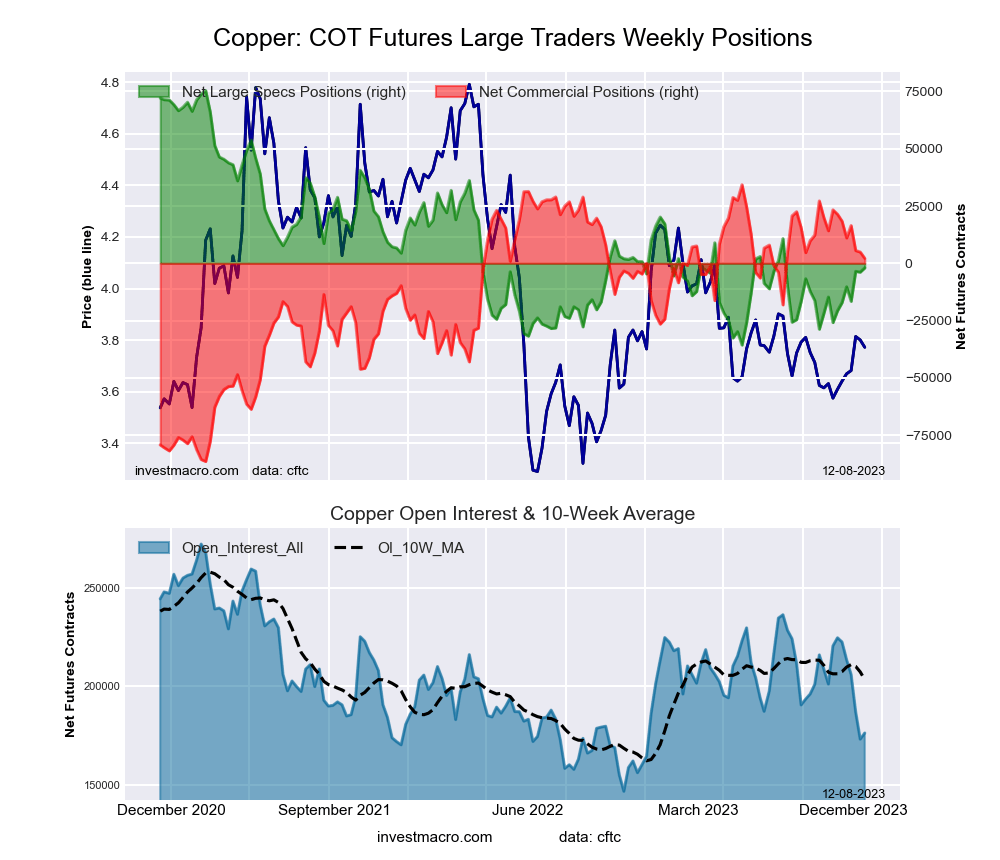 The Copper Grade #1 Futures large speculator standing this week came in at a net position of -1,994 contracts in the data reported through Tuesday. This was a weekly rise of 1,878 contracts from the previous week which had a total of -3,872 net contracts.
This week’s current strength score (the trader positioning range over the past three years, measured from 0 to 100) shows the speculators are currently Bearish with a score of 30.3 percent. The commercials are Bullish with a score of 73.4 percent and the small traders (not shown in chart) are Bearish-Extreme with a score of 17.6 percent.
Price Trend-Following Model: Weak Downtrend (Possible Trend Change)
Our weekly trend-following model classifies the current market price position as: Weak Downtrend. The current action for the model is considered to be: Hold – Maintain Short Position.
| Copper Futures Statistics | SPECULATORS | COMMERCIALS | SMALL TRADERS |
| – Percent of Open Interest Longs: | 35.6 | 39.3 | 7.6 |
| – Percent of Open Interest Shorts: | 36.7 | 38.1 | 7.7 |
| – Net Position: | -1,994 | 2,139 | -145 |
| – Gross Longs: | 62,780 | 69,402 | 13,390 |
| – Gross Shorts: | 64,774 | 67,263 | 13,535 |
| – Long to Short Ratio: | 1.0 to 1 | 1.0 to 1 | 1.0 to 1 |
| NET POSITION TREND: | |||
| – Strength Index Score (3 Year Range Pct): | 30.3 | 73.4 | 17.6 |
| – Strength Index Reading (3 Year Range): | Bearish | Bullish | Bearish-Extreme |
| NET POSITION MOVEMENT INDEX: | |||
| – 6-Week Change in Strength Index: | 16.9 | -15.9 | 3.1 |
Platinum Futures:
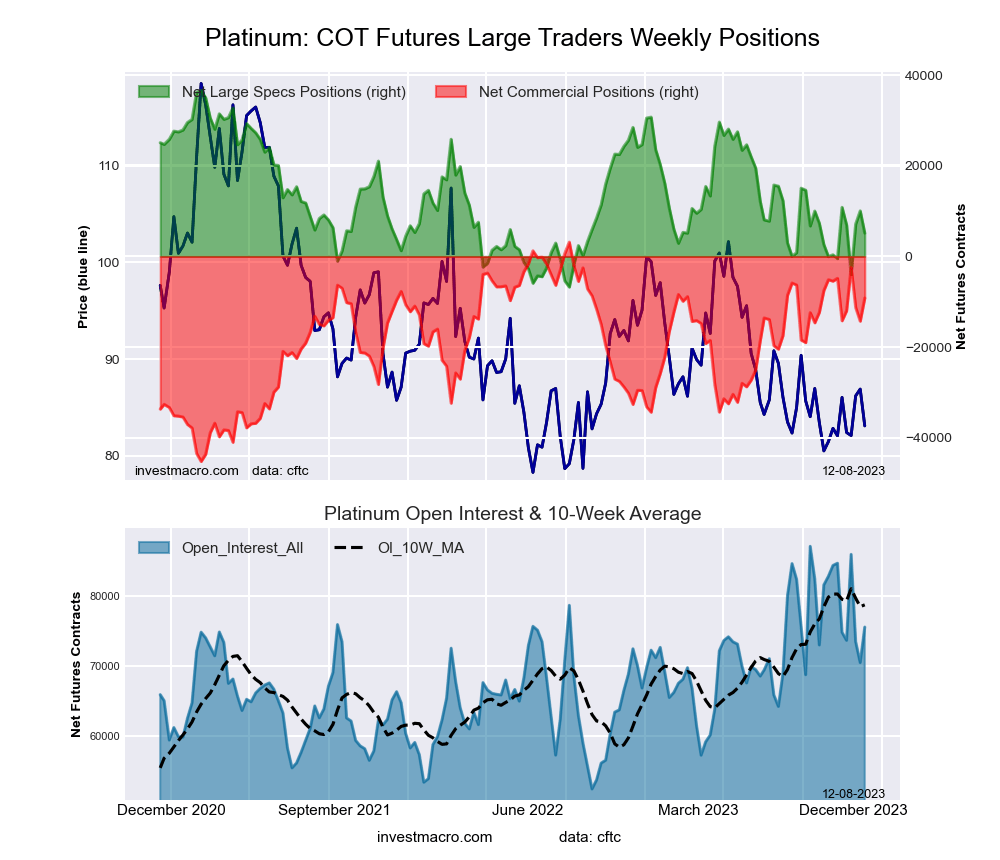 The Platinum Futures large speculator standing this week came in at a net position of 5,133 contracts in the data reported through Tuesday. This was a weekly lowering of -4,901 contracts from the previous week which had a total of 10,034 net contracts.
This week’s current strength score (the trader positioning range over the past three years, measured from 0 to 100) shows the speculators are currently Bearish with a score of 27.4 percent. The commercials are Bullish with a score of 74.5 percent and the small traders (not shown in chart) are Bearish with a score of 22.4 percent.
Price Trend-Following Model: Downtrend
Our weekly trend-following model classifies the current market price position as: Downtrend. The current action for the model is considered to be: Hold – Maintain Short Position.
| Platinum Futures Statistics | SPECULATORS | COMMERCIALS | SMALL TRADERS |
| – Percent of Open Interest Longs: | 49.5 | 29.7 | 10.3 |
| – Percent of Open Interest Shorts: | 42.7 | 41.9 | 4.9 |
| – Net Position: | 5,133 | -9,183 | 4,050 |
| – Gross Longs: | 37,395 | 22,448 | 7,743 |
| – Gross Shorts: | 32,262 | 31,631 | 3,693 |
| – Long to Short Ratio: | 1.2 to 1 | 0.7 to 1 | 2.1 to 1 |
| NET POSITION TREND: | |||
| – Strength Index Score (3 Year Range Pct): | 27.4 | 74.5 | 22.4 |
| – Strength Index Reading (3 Year Range): | Bearish | Bullish | Bearish |
| NET POSITION MOVEMENT INDEX: | |||
| – 6-Week Change in Strength Index: | 13.0 | -9.0 | -16.8 |
Palladium Futures:
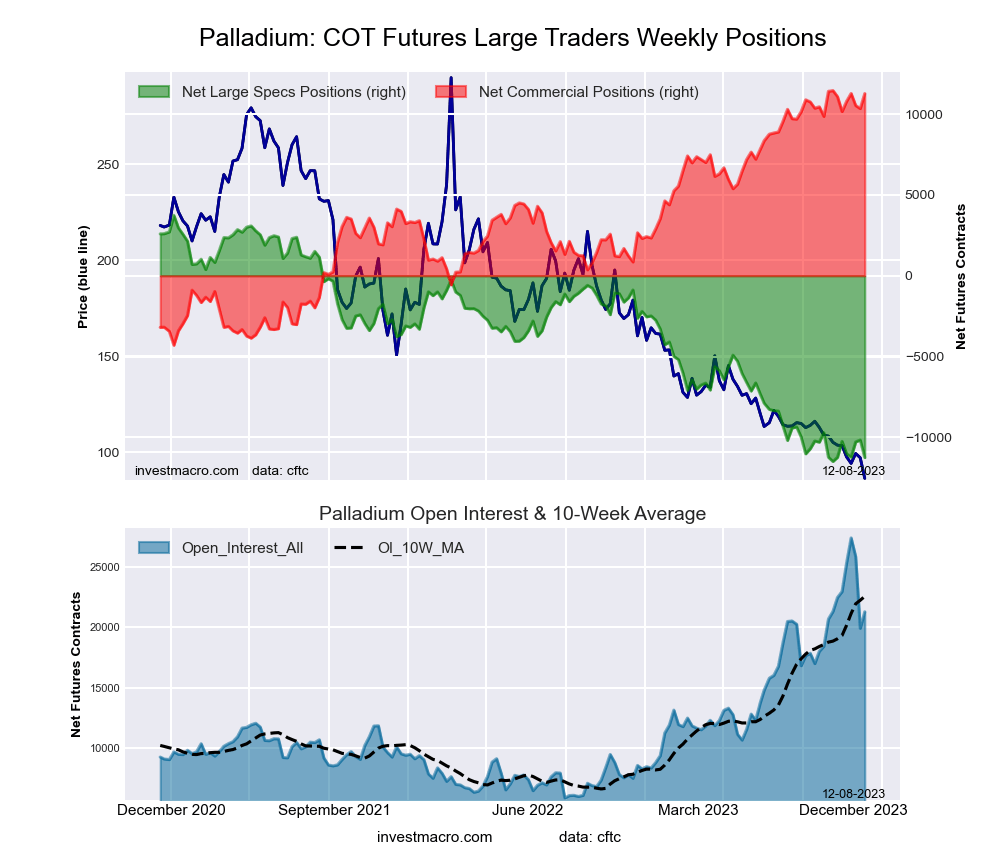 The Palladium Futures large speculator standing this week came in at a net position of -11,252 contracts in the data reported through Tuesday. This was a weekly decrease of -1,081 contracts from the previous week which had a total of -10,171 net contracts.
This week’s current strength score (the trader positioning range over the past three years, measured from 0 to 100) shows the speculators are currently Bearish-Extreme with a score of 1.6 percent. The commercials are Bullish-Extreme with a score of 98.8 percent and the small traders (not shown in chart) are Bearish with a score of 40.2 percent.
Price Trend-Following Model: Strong Downtrend
Our weekly trend-following model classifies the current market price position as: Strong Downtrend. The current action for the model is considered to be: Hold – Maintain Short Position.
| Palladium Futures Statistics | SPECULATORS | COMMERCIALS | SMALL TRADERS |
| – Percent of Open Interest Longs: | 23.1 | 60.2 | 8.7 |
| – Percent of Open Interest Shorts: | 76.0 | 7.2 | 8.9 |
| – Net Position: | -11,252 | 11,277 | -25 |
| – Gross Longs: | 4,920 | 12,814 | 1,859 |
| – Gross Shorts: | 16,172 | 1,537 | 1,884 |
| – Long to Short Ratio: | 0.3 to 1 | 8.3 to 1 | 1.0 to 1 |
| NET POSITION TREND: | |||
| – Strength Index Score (3 Year Range Pct): | 1.6 | 98.8 | 40.2 |
| – Strength Index Reading (3 Year Range): | Bearish-Extreme | Bullish-Extreme | Bearish |
| NET POSITION MOVEMENT INDEX: | |||
| – 6-Week Change in Strength Index: | -0.1 | 1.2 | -10.8 |
Steel Futures Futures:
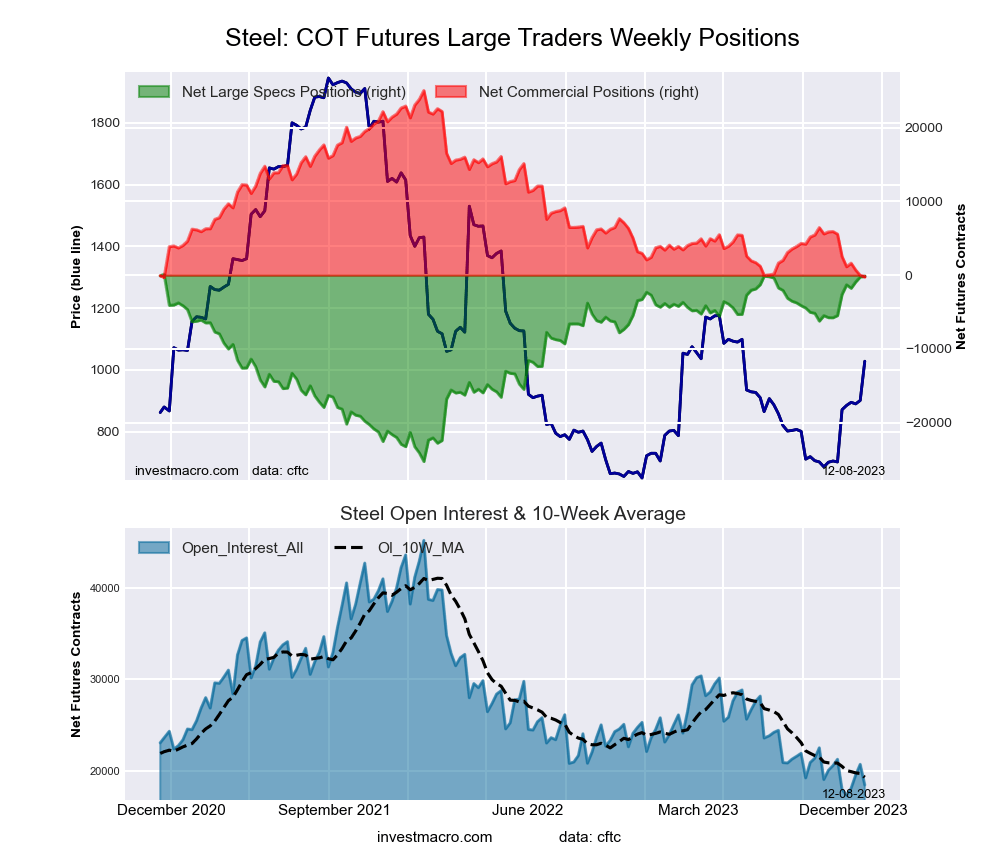 The Steel Futures large speculator standing this week came in at a net position of -167 contracts in the data reported through Tuesday. This was a weekly gain of 66 contracts from the previous week which had a total of -233 net contracts.
This week’s current strength score (the trader positioning range over the past three years, measured from 0 to 100) shows the speculators are currently Bullish-Extreme with a score of 98.8 percent. The commercials are Bearish-Extreme with a score of 0.2 percent and the small traders (not shown in chart) are Bullish with a score of 77.0 percent.
Price Trend-Following Model: Strong Uptrend
Our weekly trend-following model classifies the current market price position as: Strong Uptrend. The current action for the model is considered to be: Hold – Maintain Long Position.
| Steel Futures Statistics | SPECULATORS | COMMERCIALS | SMALL TRADERS |
| – Percent of Open Interest Longs: | 25.5 | 68.2 | 2.9 |
| – Percent of Open Interest Shorts: | 26.4 | 69.5 | 0.7 |
| – Net Position: | -167 | -241 | 408 |
| – Gross Longs: | 4,707 | 12,586 | 543 |
| – Gross Shorts: | 4,874 | 12,827 | 135 |
| – Long to Short Ratio: | 1.0 to 1 | 1.0 to 1 | 4.0 to 1 |
| NET POSITION TREND: | |||
| – Strength Index Score (3 Year Range Pct): | 98.8 | 0.2 | 77.0 |
| – Strength Index Reading (3 Year Range): | Bullish-Extreme | Bearish-Extreme | Bullish |
| NET POSITION MOVEMENT INDEX: | |||
| – 6-Week Change in Strength Index: | 20.9 | -22.9 | 55.8 |
Article By InvestMacro – Receive our weekly COT Newsletter
*COT Report: The COT data, released weekly to the public each Friday, is updated through the most recent Tuesday (data is 3 days old) and shows a quick view of how large speculators or non-commercials (for-profit traders) were positioned in the futures markets.
The CFTC categorizes trader positions according to commercial hedgers (traders who use futures contracts for hedging as part of the business), non-commercials (large traders who speculate to realize trading profits) and nonreportable traders (usually small traders/speculators) as well as their open interest (contracts open in the market at time of reporting). See CFTC criteria here.

- Oil prices jumped 4% amid a new wave of escalation between the US and Iran Jul 13, 2026
- EUR/USD: US Inflation Will Determine Everything Jul 13, 2026
- COT Metals Charts: Weekly Speculator Bets see small gains for Silver & Gold Jul 12, 2026
- COT Bonds Charts: Speculator Bets led by SOFR 3-Months & 2-Year Bonds Jul 12, 2026
- COT Energy Charts: Weekly Speculator Changes led by Brent Oil Jul 12, 2026
- COT Soft Commodities Charts: Weekly Speculator Changes led by Sugar, Corn & Soybeans Jul 12, 2026
- The US and European stock indices are rising again amid renewed investor interest in the AI industry. Jul 10, 2026
- USD/JPY Falls as Yen Recovers Weekly Losses Jul 10, 2026
- Crude oil prices surged sharply by 7% in reaction to the rapid escalation of the conflict in the Middle East Jul 9, 2026
- Middle East Tensions Weigh on Gold Jul 9, 2026