By InvestMacro
Here are the latest charts and statistics for the Commitment of Traders (COT) data published by the Commodities Futures Trading Commission (CFTC).
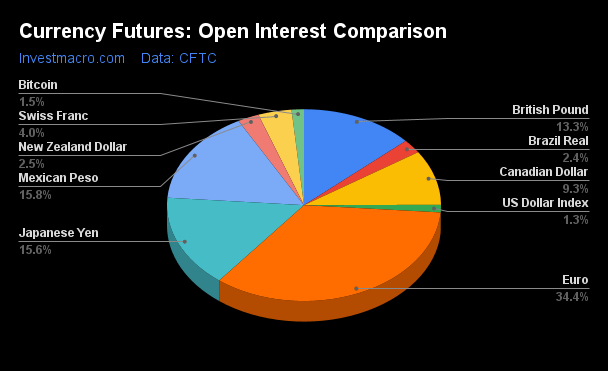
The latest COT data is updated through Tuesday March 12th and shows a quick view of how large market participants (for-profit speculators and commercial traders) were positioned in the futures markets. All currency positions are in direct relation to the US dollar where, for example, a bet for the euro is a bet that the euro will rise versus the dollar while a bet against the euro will be a bet that the euro will decline versus the dollar.
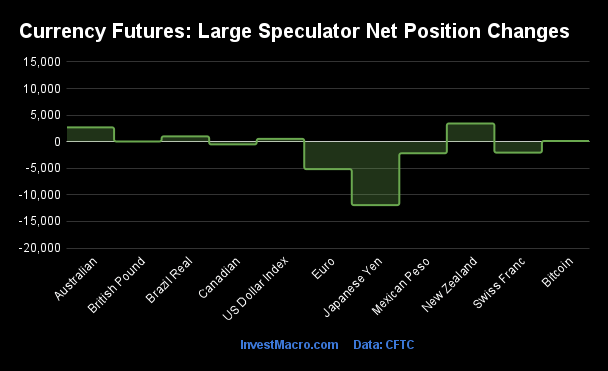
Weekly Speculator Changes led by Japanese Yen & British Pound
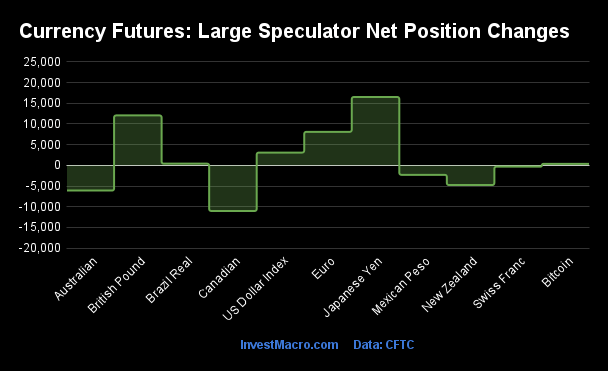
The COT currency market speculator bets were slightly higher overall this week as six out of the eleven currency markets we cover had higher positioning and the other five markets had lower speculator contracts.
Leading the gains for the currency markets was the Japanese Yen (16,521 contracts) with the British Pound (12,066 contracts), the EuroFX (8,096 contracts), the US Dollar Index (3,087 contracts), the Brazilian Real (407 contracts) and Bitcoin (358 contracts) also having positive weeks.
The currencies seeing declines in speculator bets on the week were the Canadian Dollar (-11,037 contracts), the Australian Dollar (-6,097 contracts), the New Zealand Dollar (-4,763 contracts), the Mexican Peso (-2,294 contracts) and the Swiss Franc (-319 contracts) also registering lower bets on the week.
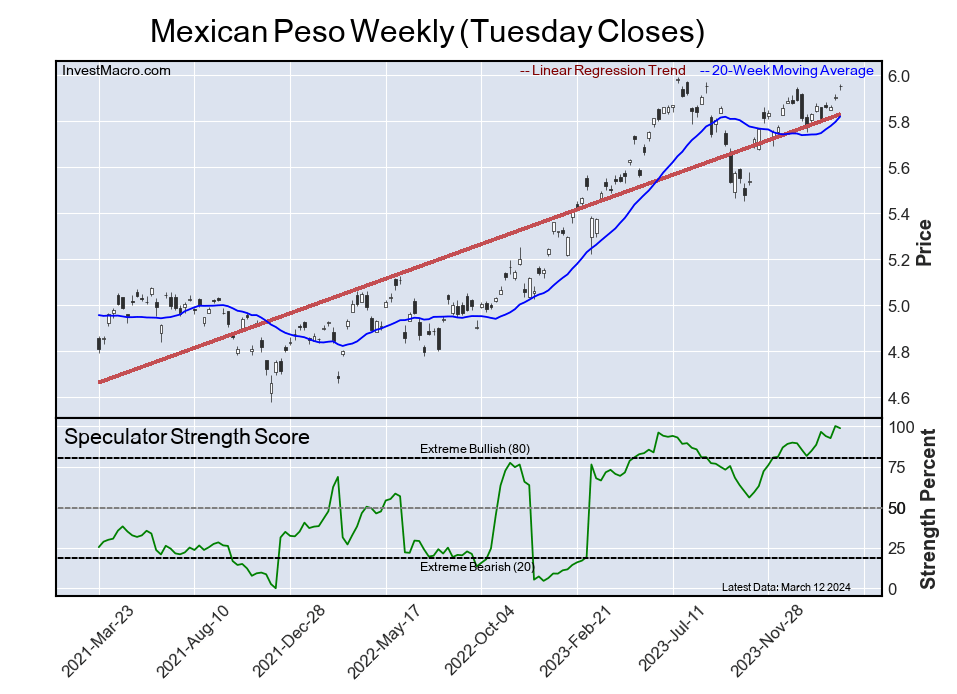
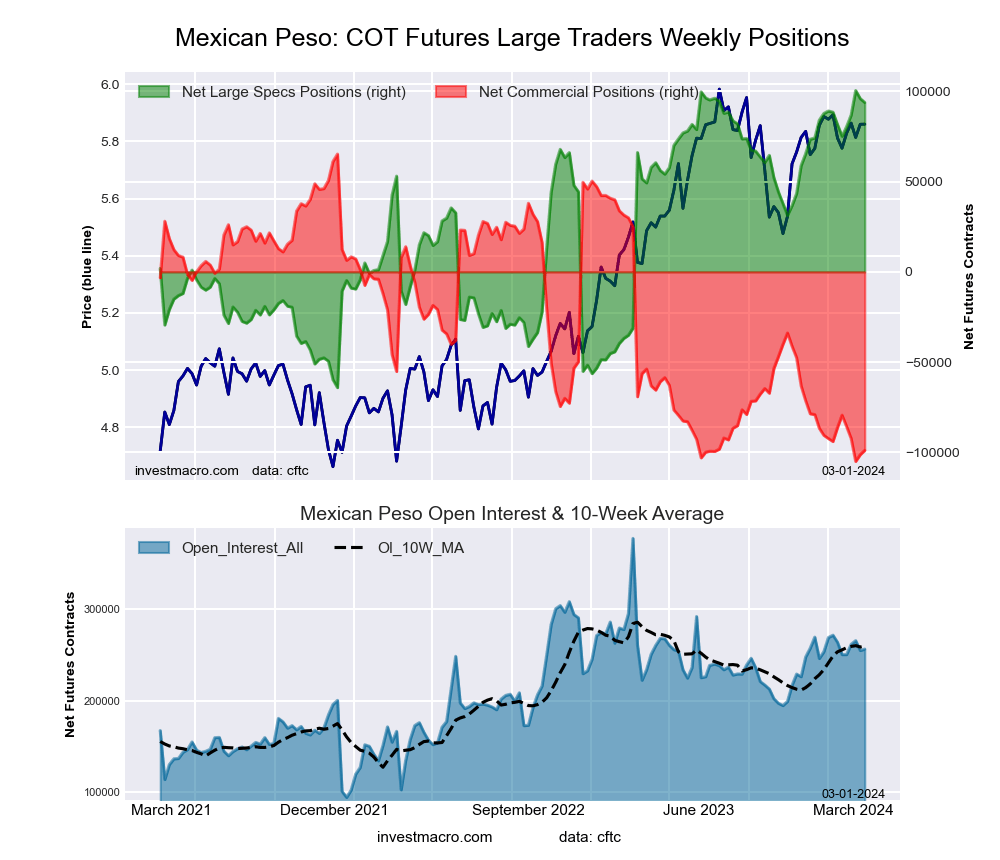
Speculators boosting Mexican Peso positions to best levels in 4 years
Highlighting the COT currency data this week is the continued strength in the Mexican peso positioning. Large speculators slightly trimmed (-2,294 contracts) their bullish bets for the Mexican peso this week but have been pushing their bets to multi-year highs over the past month.
Last week, on March 5th, the large speculator position rose by over +12,772 contracts and ascended to the most bullish level (+106,586 contracts) of the past 208 weeks, dating back all the way to March 10th of 2020. Since the beginning of November, speculators have increased their bullish bets in thirteen out of nineteen weeks and have added a total of +72,995 contracts to the overall net bullish standing, going from +31,297 contracts on October 31st to a total of +104,292 contracts this week.
Helping the Mexican peso positioning has been the record high interest rates in Mexico at 11.25 percent which gives the currency an interest rate differential advantage over the other major currencies. The Mexican economy has been on a steady growth path as well with the year-over-year GDP expanding by 2.5 percent in the 4th quarter following 3.5 percent growth in the third quarter of 2023 and 3.4 percent growth in the second quarter.
The Mexican peso exchange rate has been strongly trending higher in the currency markets versus the US Dollar and the other major currencies. The peso exchange level versus the US Dollar, on Thursday, reached its highest level since July of 2023 at just over the 0.0600 exchange rate. The peso has also been higher versus all of the other major currencies we track on a year-over-year basis.
The Bank of Mexico does meet on March 21st with a market expectation of a possible interest rate reduction — so we will see if the peso can continue to shine in 2024 following a great 2023 when the peso had an approximate gain versus the USD by a little over 14 percent.
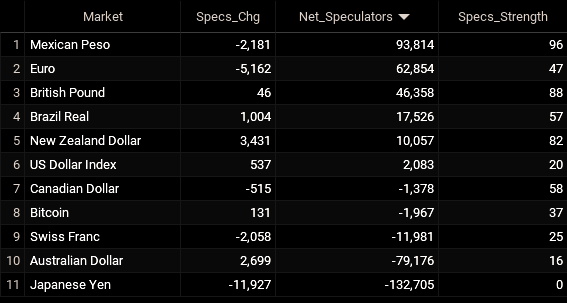
Currencies Net Speculators Leaderboard
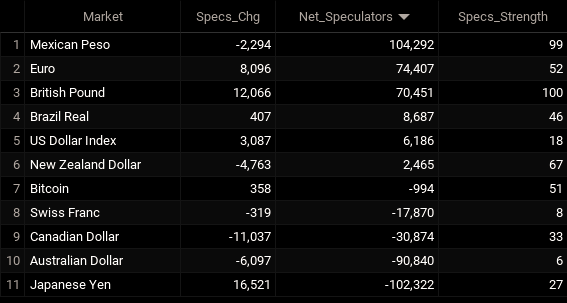
Legend: Weekly Speculators Change | Speculators Current Net Position | Speculators Strength Score compared to last 3-Years (0-100 range)
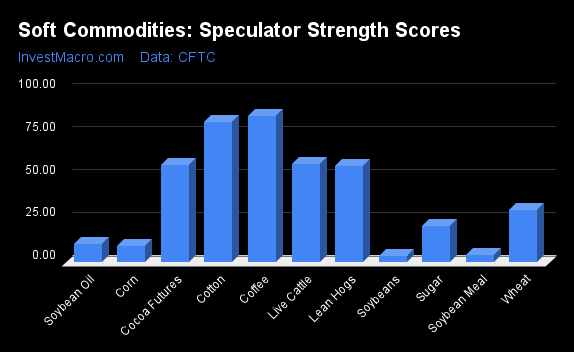
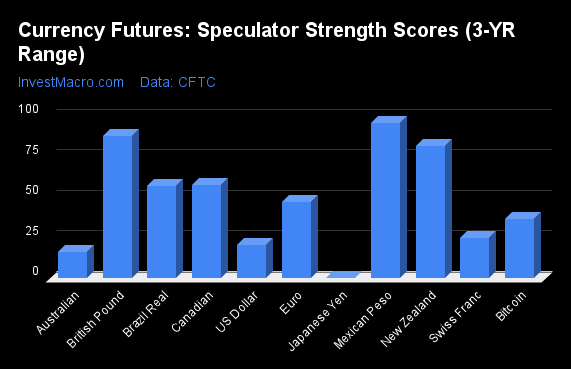
Strength Scores led by British Pound & Mexican Peso
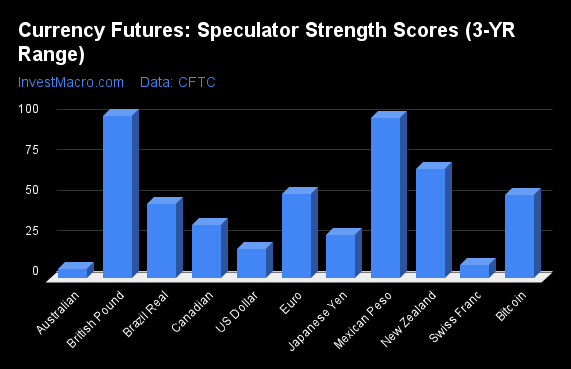
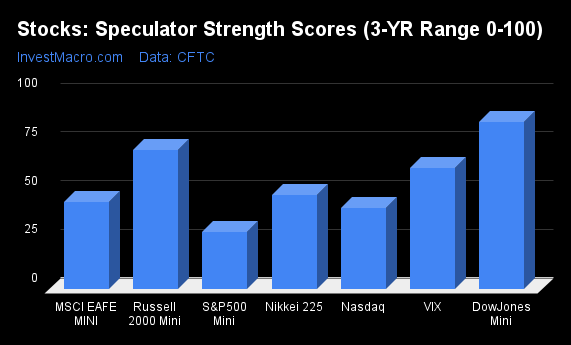
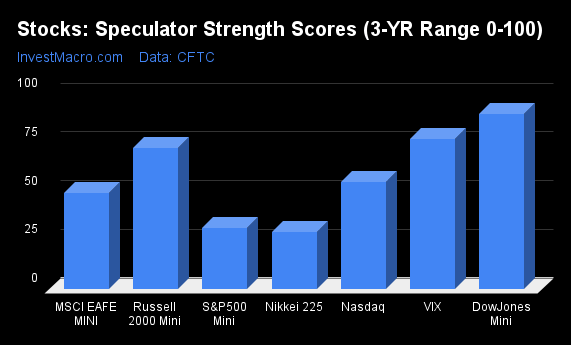
COT Strength Scores (a normalized measure of Speculator positions over a 3-Year range, from 0 to 100 where above 80 is Extreme-Bullish and below 20 is Extreme-Bearish) showed that the British Pound (100 percent) and the Mexican Peso (99 percent) lead the currency markets this week. The New Zealand Dollar (67 percent), EuroFX (52 percent) and Bitcoin (51 percent) come in as the next highest in the weekly strength scores and above their midpoint (50 percent) of the last three years.
On the downside, the Australian Dollar (6 percent), the Swiss Franc (8 percent) and the US Dollar Index (18 percent) come in at the lowest strength levels currently and are in Extreme-Bearish territory (below 20 percent). The next lowest strength score is the Japanese Yen (27 percent).
Strength Statistics:
US Dollar Index (17.9 percent) vs US Dollar Index previous week (11.4 percent)
EuroFX (52.0 percent) vs EuroFX previous week (48.6 percent)
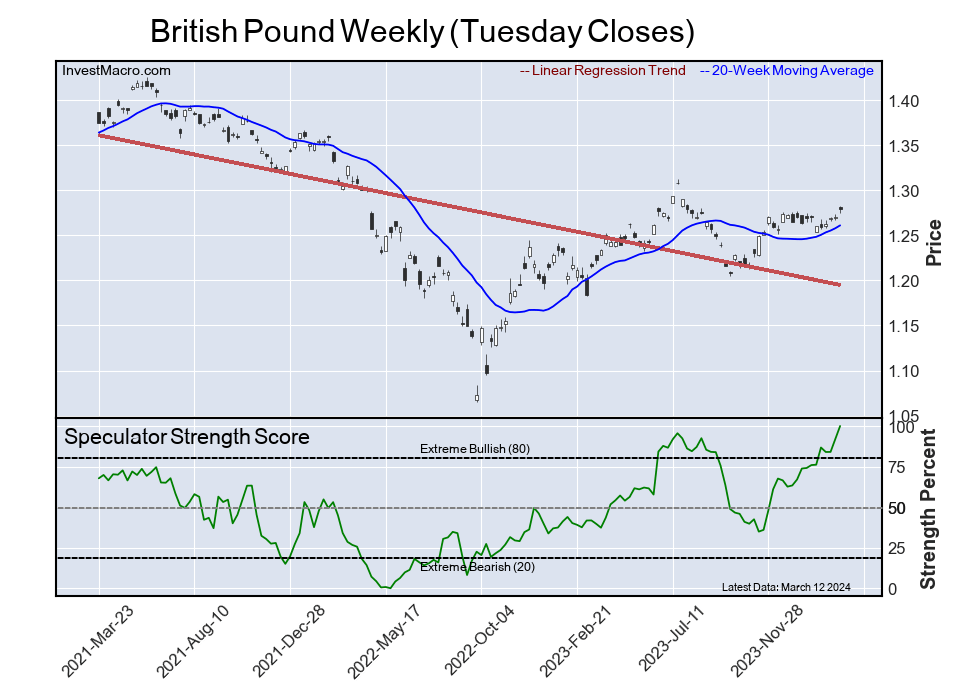
British Pound Sterling (100.0 percent) vs British Pound Sterling previous week (92.0 percent)
Japanese Yen (27.0 percent) vs Japanese Yen previous week (12.3 percent)
Swiss Franc (8.1 percent) vs Swiss Franc previous week (9.1 percent)
Canadian Dollar (33.2 percent) vs Canadian Dollar previous week (42.4 percent)
Australian Dollar (5.6 percent) vs Australian Dollar previous week (11.2 percent)
New Zealand Dollar (67.4 percent) vs New Zealand Dollar previous week (80.9 percent)
Mexican Peso (98.7 percent) vs Mexican Peso previous week (100.0 percent)
Brazilian Real (45.8 percent) vs Brazilian Real previous week (45.2 percent)
Bitcoin (51.4 percent) vs Bitcoin previous week (46.1 percent)
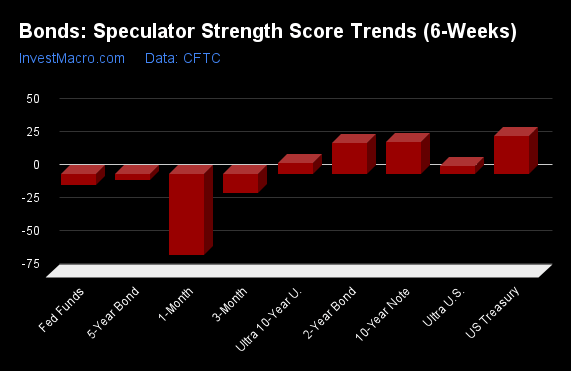
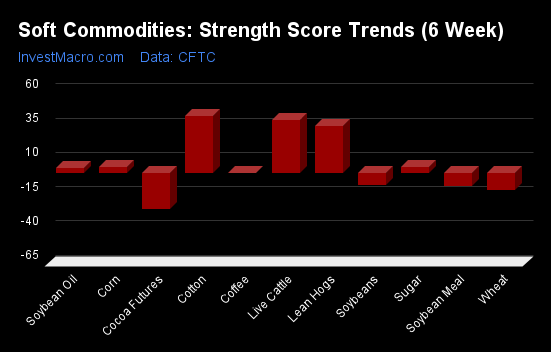
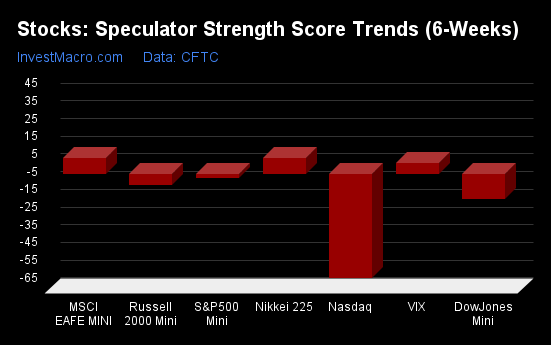
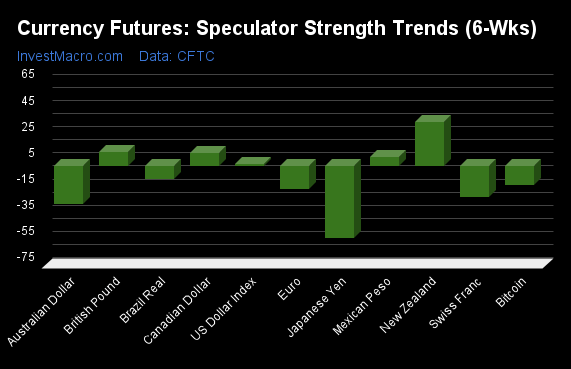
British Pound & Mexican Peso top the 6-Week Strength Trends
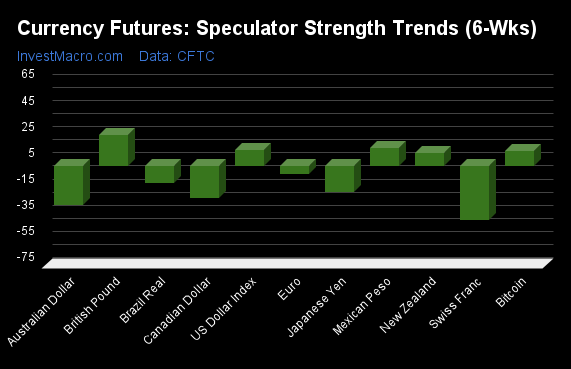
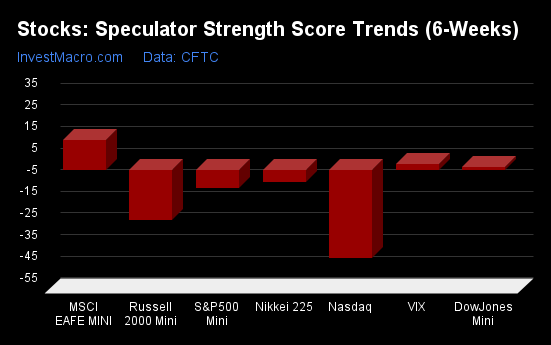
COT Strength Score Trends (or move index, calculates the 6-week changes in strength scores) showed that the British Pound (24 percent) and the Mexican Peso (14 percent) lead the past six weeks trends for the currencies. The US Dollar Index (12 percent), the Bitcoin (12 percent) and the New Zealand Dollar (10 percent) are the next highest positive movers in the latest trends data.
The Swiss Franc (-41 percent) leads the downside trend scores currently with the Australian Dollar (-30 percent), Canadian Dollar (-24 percent) and the Japanese Yen (-19 percent) following next with lower trend scores.
Strength Trend Statistics:
US Dollar Index (12.3 percent) vs US Dollar Index previous week (3.1 percent)
EuroFX (-6.1 percent) vs EuroFX previous week (-9.4 percent)
British Pound Sterling (24.1 percent) vs British Pound Sterling previous week (17.9 percent)
Japanese Yen (-19.4 percent) vs Japanese Yen previous week (-42.8 percent)
Swiss Franc (-40.8 percent) vs Swiss Franc previous week (-36.2 percent)
Canadian Dollar (-23.9 percent) vs Canadian Dollar previous week (-9.6 percent)
Australian Dollar (-29.8 percent) vs Australian Dollar previous week (-28.0 percent)
New Zealand Dollar (9.9 percent) vs New Zealand Dollar previous week (25.5 percent)
Mexican Peso (14.0 percent) vs Mexican Peso previous week (18.4 percent)
Brazilian Real (-12.5 percent) vs Brazilian Real previous week (-20.1 percent)
Bitcoin (12.1 percent) vs Bitcoin previous week (4.7 percent)
Individual COT Forex Markets:
US Dollar Index Futures:
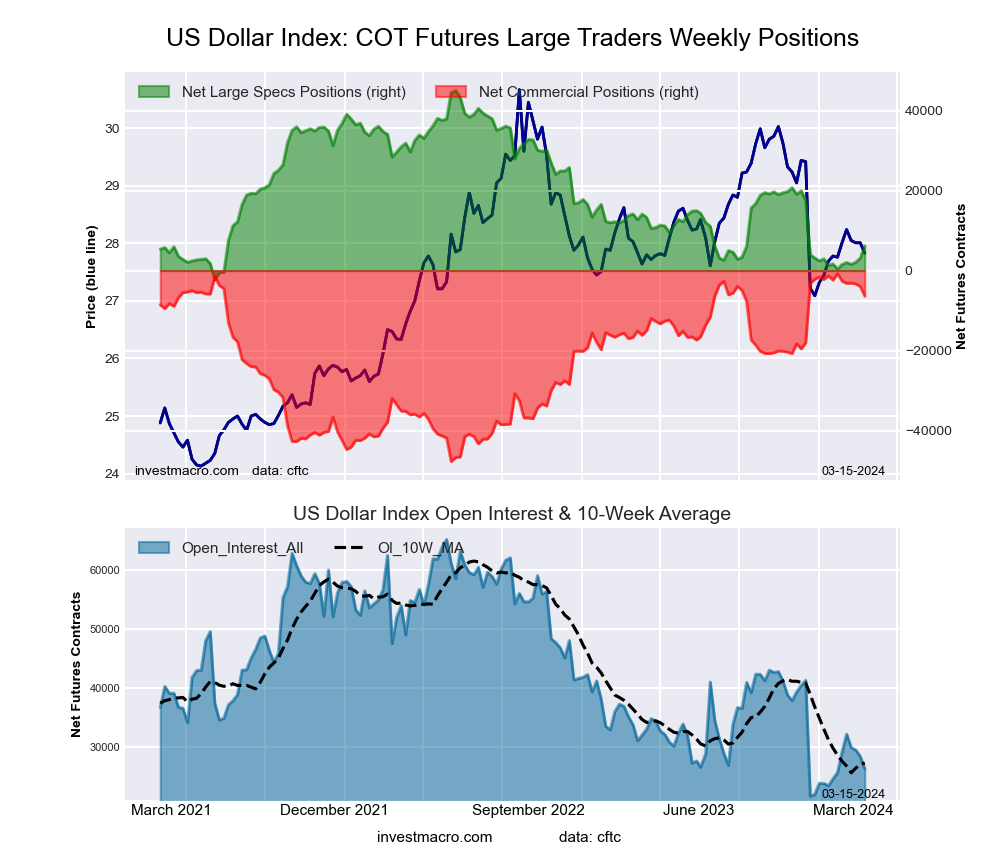 The US Dollar Index large speculator standing this week totaled a net position of 6,186 contracts in the data reported through Tuesday. This was a weekly advance of 3,087 contracts from the previous week which had a total of 3,099 net contracts.
This week’s current strength score (the trader positioning range over the past three years, measured from 0 to 100) shows the speculators are currently Bearish-Extreme with a score of 17.9 percent. The commercials are Bullish-Extreme with a score of 88.0 percent and the small traders (not shown in chart) are Bearish-Extreme with a score of 13.4 percent.
Price Trend-Following Model: Downtrend
Our weekly trend-following model classifies the current market price position as: Downtrend. The current action for the model is considered to be: Hold – Maintain Short Position.
| US DOLLAR INDEX Statistics | SPECULATORS | COMMERCIALS | SMALL TRADERS |
| – Percent of Open Interest Longs: | 66.6 | 11.9 | 10.8 |
| – Percent of Open Interest Shorts: | 43.1 | 36.1 | 10.1 |
| – Net Position: | 6,186 | -6,381 | 195 |
| – Gross Longs: | 17,547 | 3,127 | 2,853 |
| – Gross Shorts: | 11,361 | 9,508 | 2,658 |
| – Long to Short Ratio: | 1.5 to 1 | 0.3 to 1 | 1.1 to 1 |
| NET POSITION TREND: | |||
| – Strength Index Score (3 Year Range Pct): | 17.9 | 88.0 | 13.4 |
| – Strength Index Reading (3 Year Range): | Bearish-Extreme | Bullish-Extreme | Bearish-Extreme |
| NET POSITION MOVEMENT INDEX: | |||
| – 6-Week Change in Strength Index: | 12.3 | -12.0 | -2.0 |
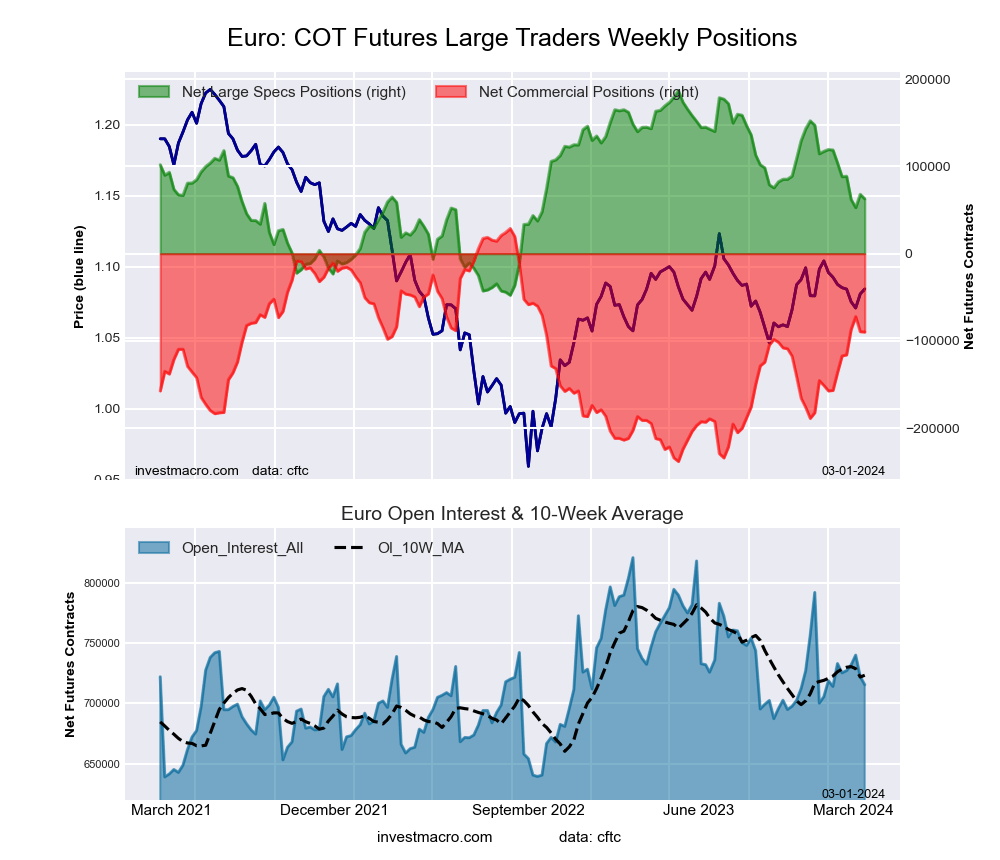
Euro Currency Futures:
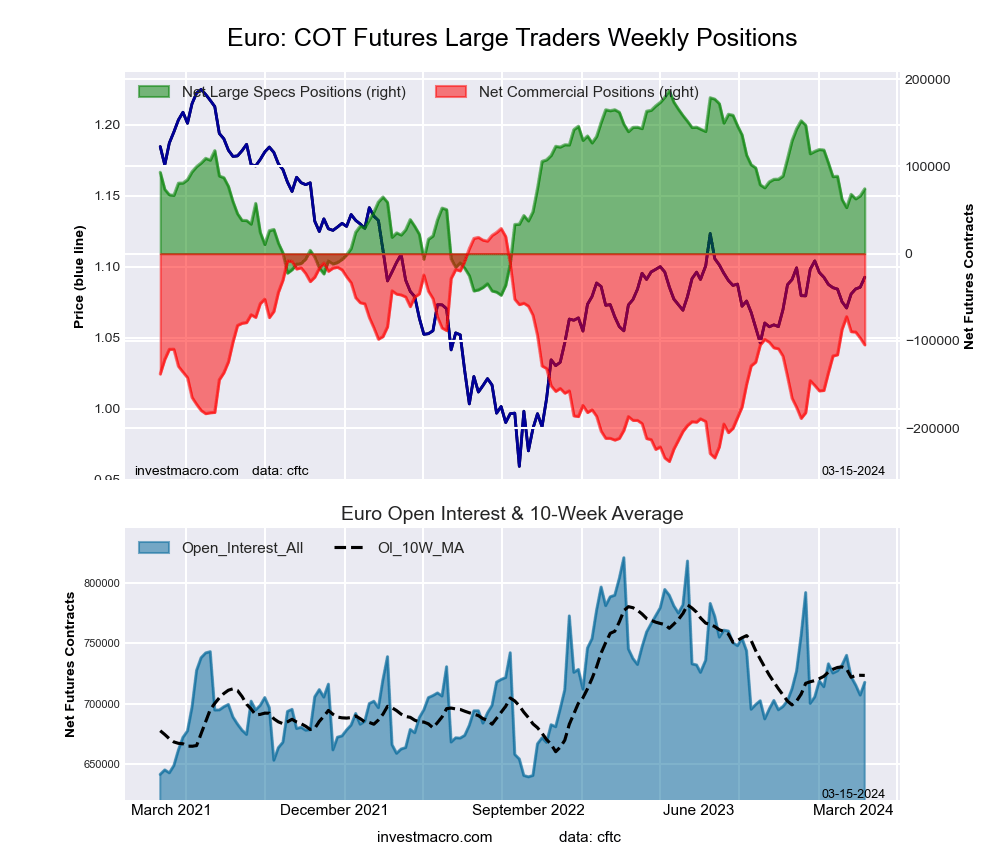 The Euro Currency large speculator standing this week totaled a net position of 74,407 contracts in the data reported through Tuesday. This was a weekly increase of 8,096 contracts from the previous week which had a total of 66,311 net contracts.
This week’s current strength score (the trader positioning range over the past three years, measured from 0 to 100) shows the speculators are currently Bullish with a score of 52.0 percent. The commercials are Bullish with a score of 50.0 percent and the small traders (not shown in chart) are Bearish with a score of 27.2 percent.
Price Trend-Following Model: Uptrend
Our weekly trend-following model classifies the current market price position as: Uptrend. The current action for the model is considered to be: Hold – Maintain Long Position.
| EURO Currency Statistics | SPECULATORS | COMMERCIALS | SMALL TRADERS |
| – Percent of Open Interest Longs: | 27.0 | 56.0 | 11.7 |
| – Percent of Open Interest Shorts: | 16.7 | 70.6 | 7.5 |
| – Net Position: | 74,407 | -104,604 | 30,197 |
| – Gross Longs: | 193,998 | 402,081 | 84,306 |
| – Gross Shorts: | 119,591 | 506,685 | 54,109 |
| – Long to Short Ratio: | 1.6 to 1 | 0.8 to 1 | 1.6 to 1 |
| NET POSITION TREND: | |||
| – Strength Index Score (3 Year Range Pct): | 52.0 | 50.0 | 27.2 |
| – Strength Index Reading (3 Year Range): | Bullish | Bullish | Bearish |
| NET POSITION MOVEMENT INDEX: | |||
| – 6-Week Change in Strength Index: | -6.1 | 4.3 | 4.7 |
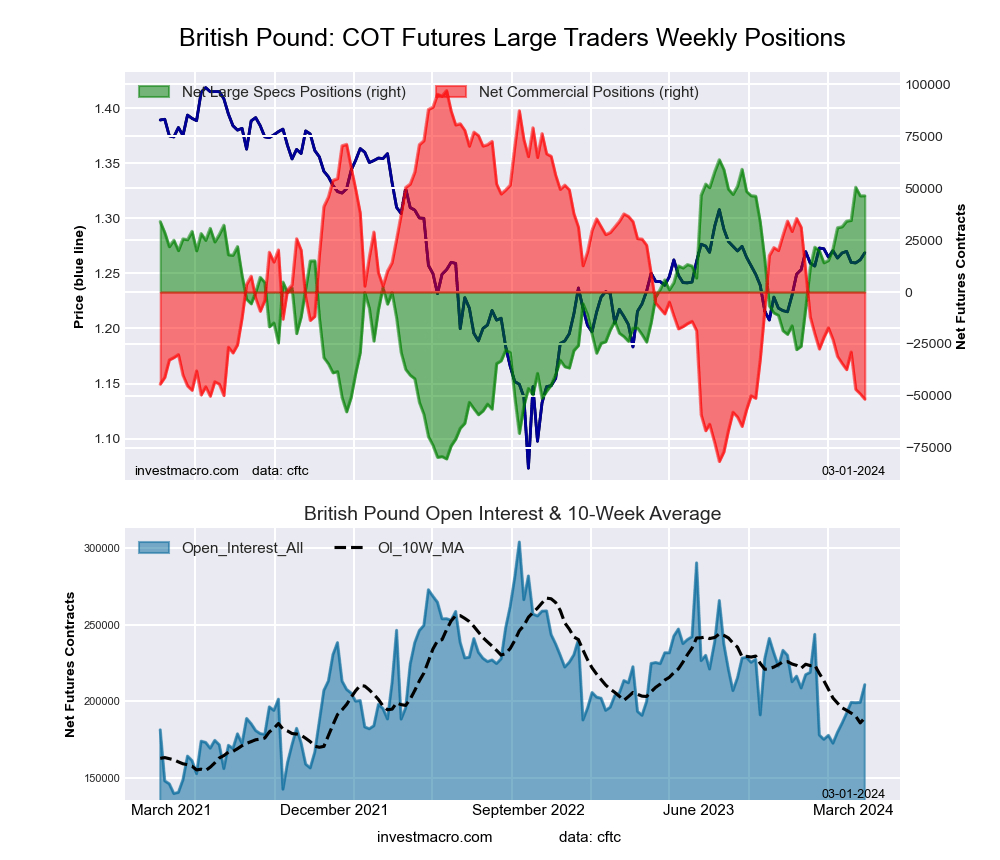
British Pound Sterling Futures:
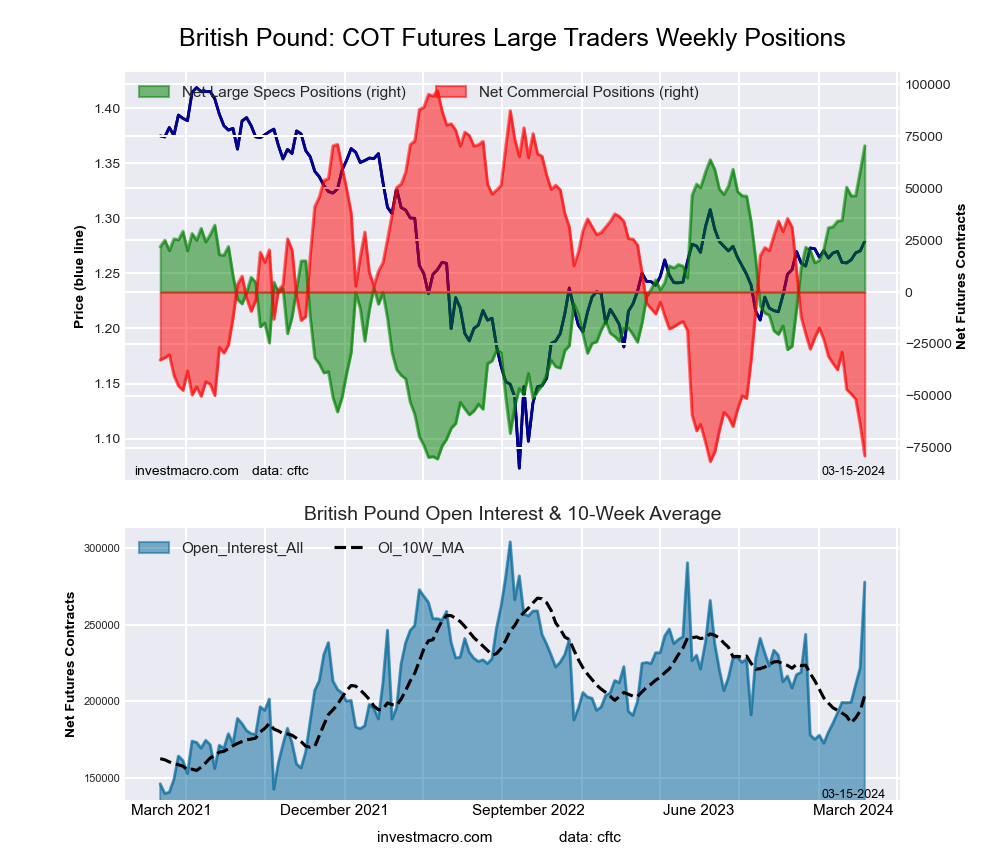 The British Pound Sterling large speculator standing this week totaled a net position of 70,451 contracts in the data reported through Tuesday. This was a weekly increase of 12,066 contracts from the previous week which had a total of 58,385 net contracts.
This week’s current strength score (the trader positioning range over the past three years, measured from 0 to 100) shows the speculators are currently Bullish-Extreme with a score of 100.0 percent. The commercials are Bearish-Extreme with a score of 1.5 percent and the small traders (not shown in chart) are Bullish with a score of 74.6 percent.
Price Trend-Following Model: Uptrend
Our weekly trend-following model classifies the current market price position as: Uptrend. The current action for the model is considered to be: Hold – Maintain Long Position.
| BRITISH POUND Statistics | SPECULATORS | COMMERCIALS | SMALL TRADERS |
| – Percent of Open Interest Longs: | 44.4 | 37.6 | 10.8 |
| – Percent of Open Interest Shorts: | 19.0 | 66.0 | 7.8 |
| – Net Position: | 70,451 | -78,920 | 8,469 |
| – Gross Longs: | 123,285 | 104,338 | 30,123 |
| – Gross Shorts: | 52,834 | 183,258 | 21,654 |
| – Long to Short Ratio: | 2.3 to 1 | 0.6 to 1 | 1.4 to 1 |
| NET POSITION TREND: | |||
| – Strength Index Score (3 Year Range Pct): | 100.0 | 1.5 | 74.6 |
| – Strength Index Reading (3 Year Range): | Bullish-Extreme | Bearish-Extreme | Bullish |
| NET POSITION MOVEMENT INDEX: | |||
| – 6-Week Change in Strength Index: | 24.1 | -23.3 | 10.3 |
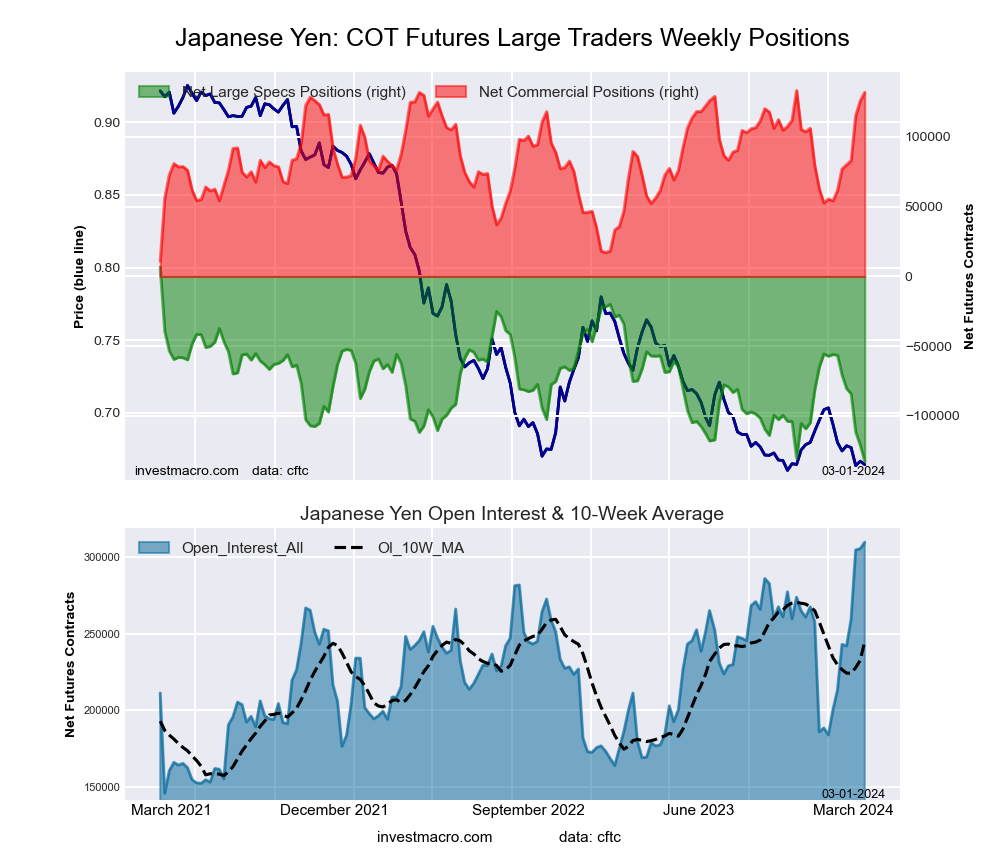
Japanese Yen Futures:
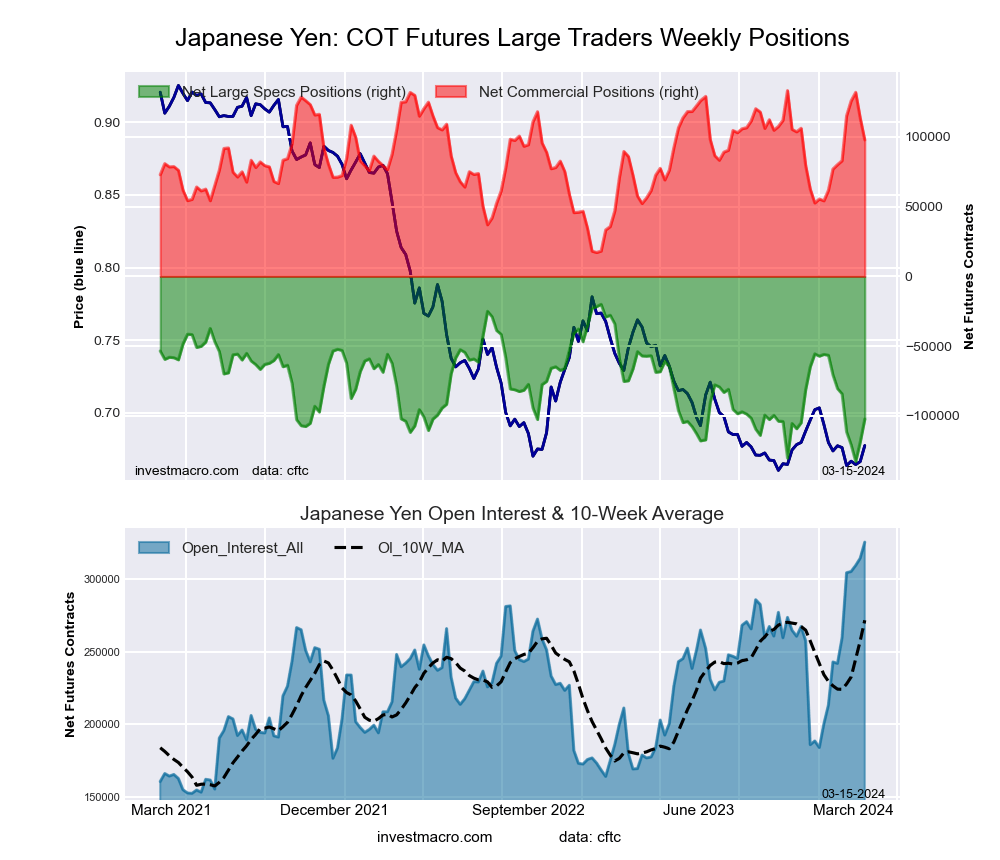 The Japanese Yen large speculator standing this week totaled a net position of -102,322 contracts in the data reported through Tuesday. This was a weekly lift of 16,521 contracts from the previous week which had a total of -118,843 net contracts.
This week’s current strength score (the trader positioning range over the past three years, measured from 0 to 100) shows the speculators are currently Bearish with a score of 27.0 percent. The commercials are Bullish with a score of 69.5 percent and the small traders (not shown in chart) are Bullish-Extreme with a score of 96.5 percent.
Price Trend-Following Model: Strong Downtrend
Our weekly trend-following model classifies the current market price position as: Strong Downtrend. The current action for the model is considered to be: Hold – Maintain Short Position.
| JAPANESE YEN Statistics | SPECULATORS | COMMERCIALS | SMALL TRADERS |
| – Percent of Open Interest Longs: | 16.9 | 63.7 | 14.6 |
| – Percent of Open Interest Shorts: | 48.3 | 33.7 | 13.2 |
| – Net Position: | -102,322 | 97,877 | 4,445 |
| – Gross Longs: | 54,923 | 207,478 | 47,586 |
| – Gross Shorts: | 157,245 | 109,601 | 43,141 |
| – Long to Short Ratio: | 0.3 to 1 | 1.9 to 1 | 1.1 to 1 |
| NET POSITION TREND: | |||
| – Strength Index Score (3 Year Range Pct): | 27.0 | 69.5 | 96.5 |
| – Strength Index Reading (3 Year Range): | Bearish | Bullish | Bullish-Extreme |
| NET POSITION MOVEMENT INDEX: | |||
| – 6-Week Change in Strength Index: | -19.4 | 15.3 | 12.9 |
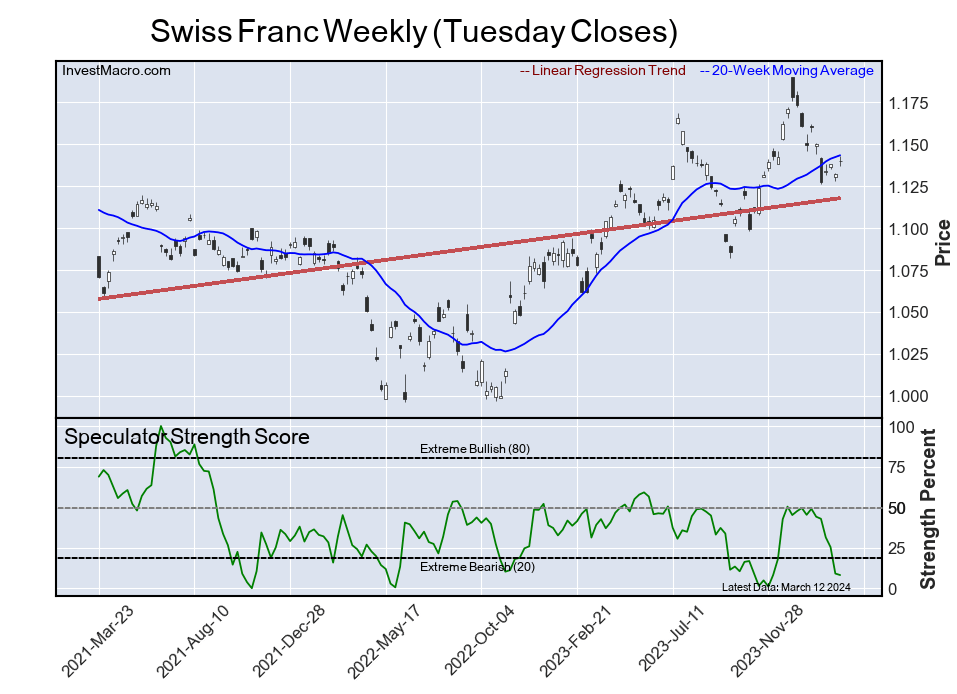
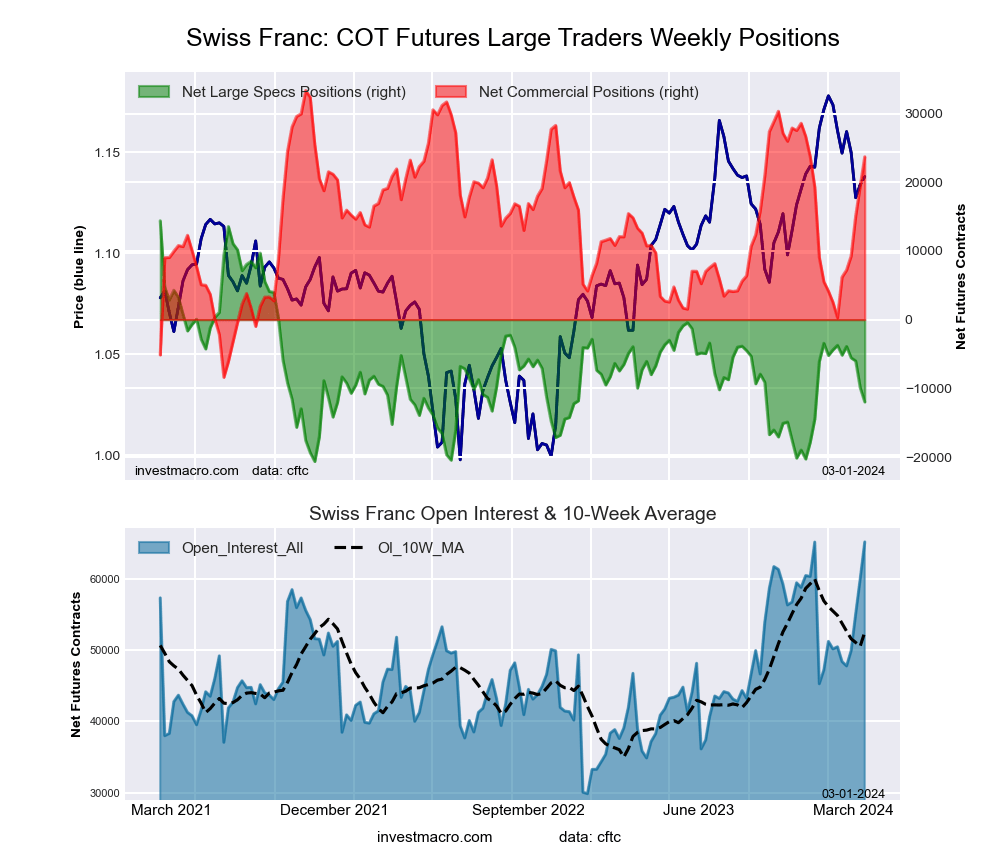
Swiss Franc Futures:
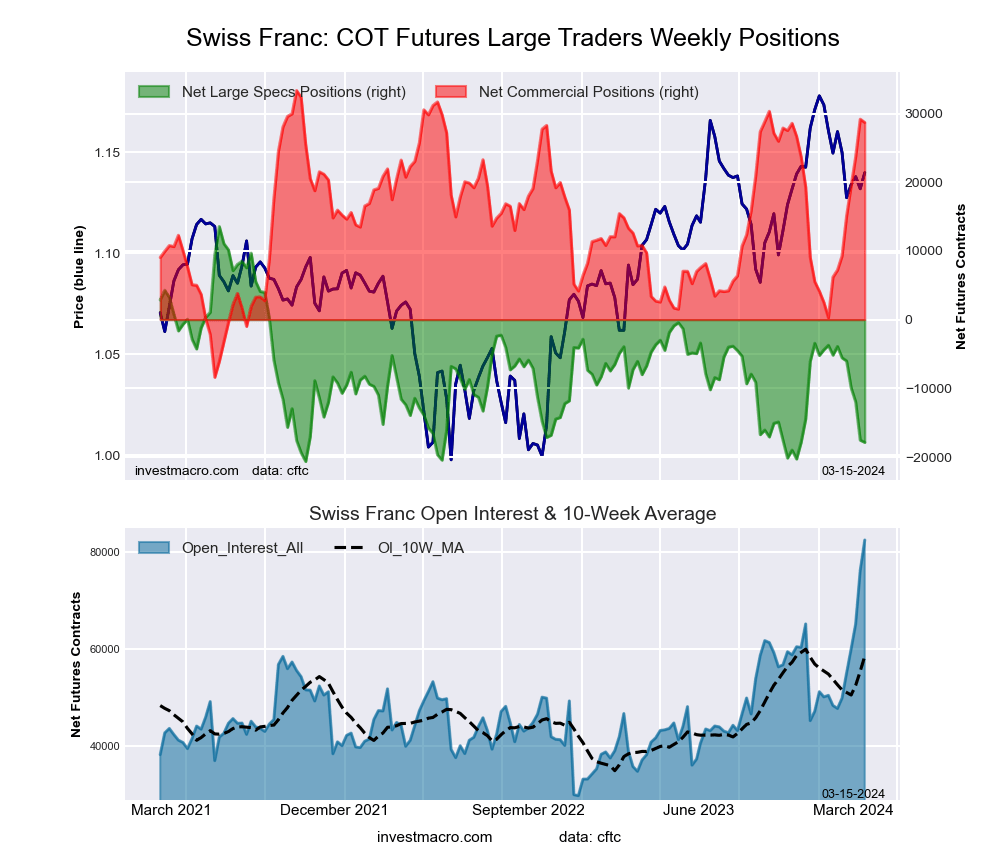 The Swiss Franc large speculator standing this week totaled a net position of -17,870 contracts in the data reported through Tuesday. This was a weekly reduction of -319 contracts from the previous week which had a total of -17,551 net contracts.
This week’s current strength score (the trader positioning range over the past three years, measured from 0 to 100) shows the speculators are currently Bearish-Extreme with a score of 8.1 percent. The commercials are Bullish-Extreme with a score of 88.9 percent and the small traders (not shown in chart) are Bearish with a score of 28.0 percent.
Price Trend-Following Model: Weak Uptrend
Our weekly trend-following model classifies the current market price position as: Weak Uptrend. The current action for the model is considered to be: Hold – Maintain Long Position.
| SWISS FRANC Statistics | SPECULATORS | COMMERCIALS | SMALL TRADERS |
| – Percent of Open Interest Longs: | 13.6 | 69.0 | 11.6 |
| – Percent of Open Interest Shorts: | 35.3 | 34.2 | 24.8 |
| – Net Position: | -17,870 | 28,703 | -10,833 |
| – Gross Longs: | 11,236 | 56,885 | 9,575 |
| – Gross Shorts: | 29,106 | 28,182 | 20,408 |
| – Long to Short Ratio: | 0.4 to 1 | 2.0 to 1 | 0.5 to 1 |
| NET POSITION TREND: | |||
| – Strength Index Score (3 Year Range Pct): | 8.1 | 88.9 | 28.0 |
| – Strength Index Reading (3 Year Range): | Bearish-Extreme | Bullish-Extreme | Bearish |
| NET POSITION MOVEMENT INDEX: | |||
| – 6-Week Change in Strength Index: | -40.8 | 51.5 | -34.2 |
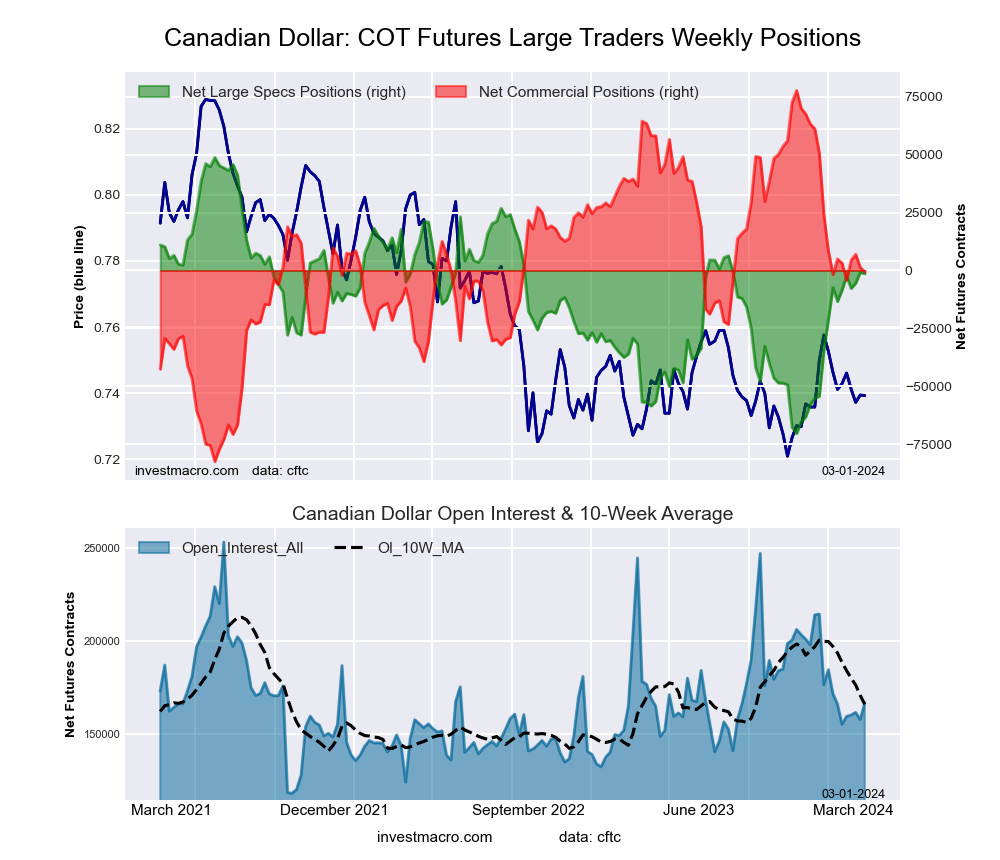
Canadian Dollar Futures:
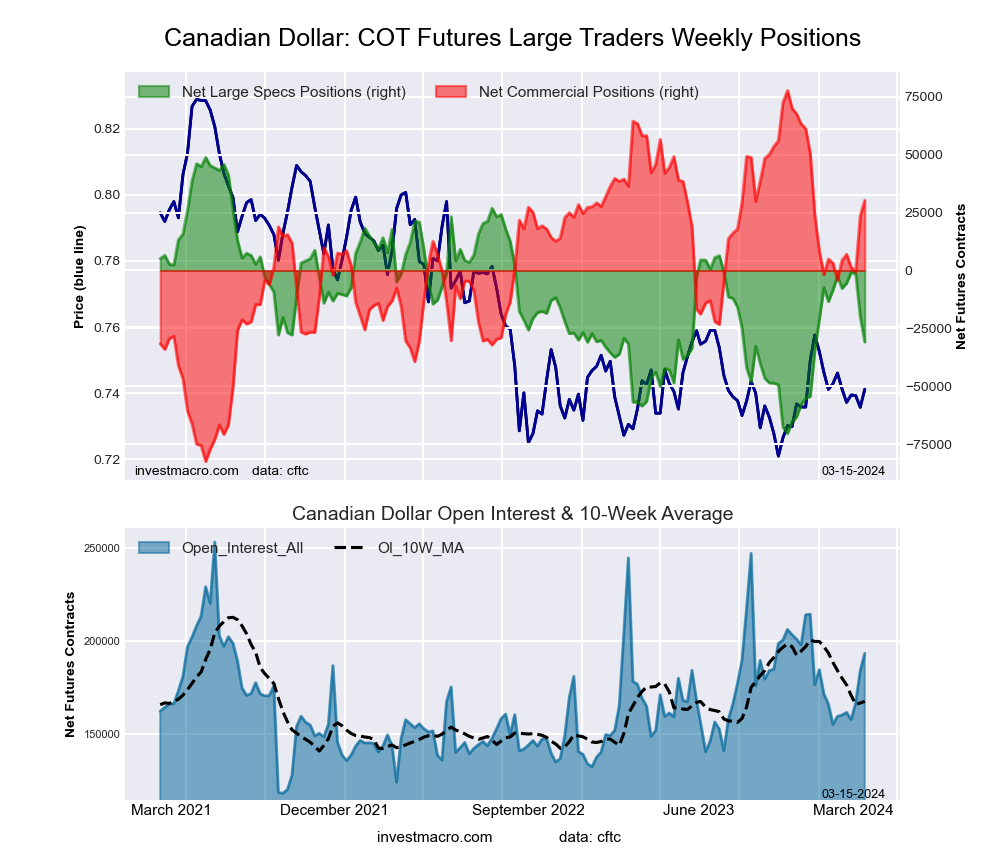 The Canadian Dollar large speculator standing this week totaled a net position of -30,874 contracts in the data reported through Tuesday. This was a weekly reduction of -11,037 contracts from the previous week which had a total of -19,837 net contracts.
This week’s current strength score (the trader positioning range over the past three years, measured from 0 to 100) shows the speculators are currently Bearish with a score of 33.2 percent. The commercials are Bullish with a score of 70.4 percent and the small traders (not shown in chart) are Bearish with a score of 24.1 percent.
Price Trend-Following Model: Weak Uptrend
Our weekly trend-following model classifies the current market price position as: Weak Uptrend. The current action for the model is considered to be: Hold – Maintain Long Position.
| CANADIAN DOLLAR Statistics | SPECULATORS | COMMERCIALS | SMALL TRADERS |
| – Percent of Open Interest Longs: | 18.6 | 59.0 | 15.6 |
| – Percent of Open Interest Shorts: | 34.6 | 43.3 | 15.3 |
| – Net Position: | -30,874 | 30,296 | 578 |
| – Gross Longs: | 35,964 | 113,942 | 30,149 |
| – Gross Shorts: | 66,838 | 83,646 | 29,571 |
| – Long to Short Ratio: | 0.5 to 1 | 1.4 to 1 | 1.0 to 1 |
| NET POSITION TREND: | |||
| – Strength Index Score (3 Year Range Pct): | 33.2 | 70.4 | 24.1 |
| – Strength Index Reading (3 Year Range): | Bearish | Bullish | Bearish |
| NET POSITION MOVEMENT INDEX: | |||
| – 6-Week Change in Strength Index: | -23.9 | 21.5 | -13.3 |
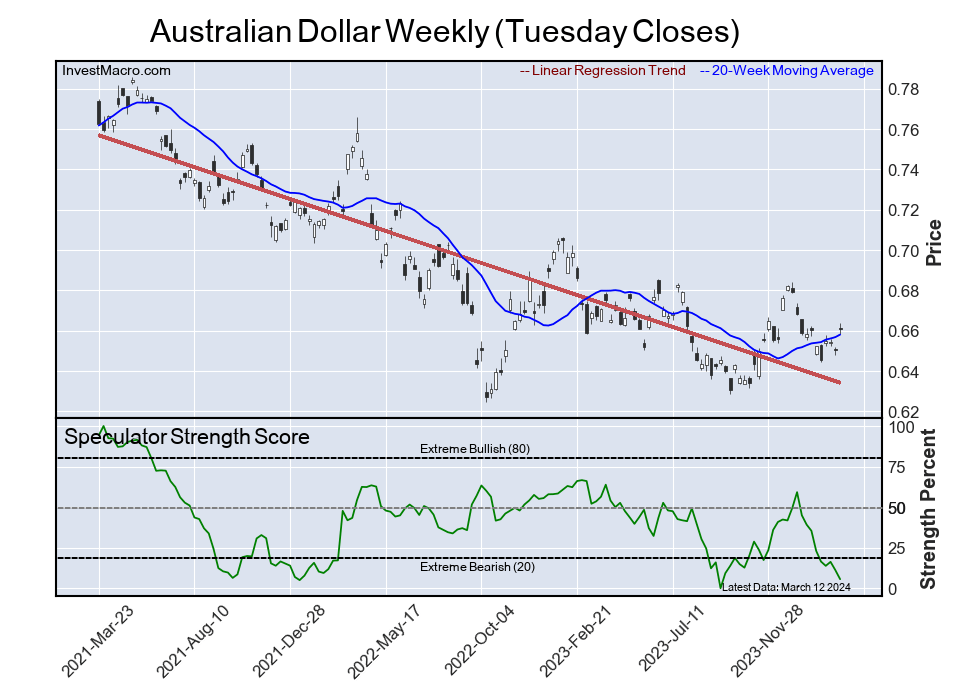
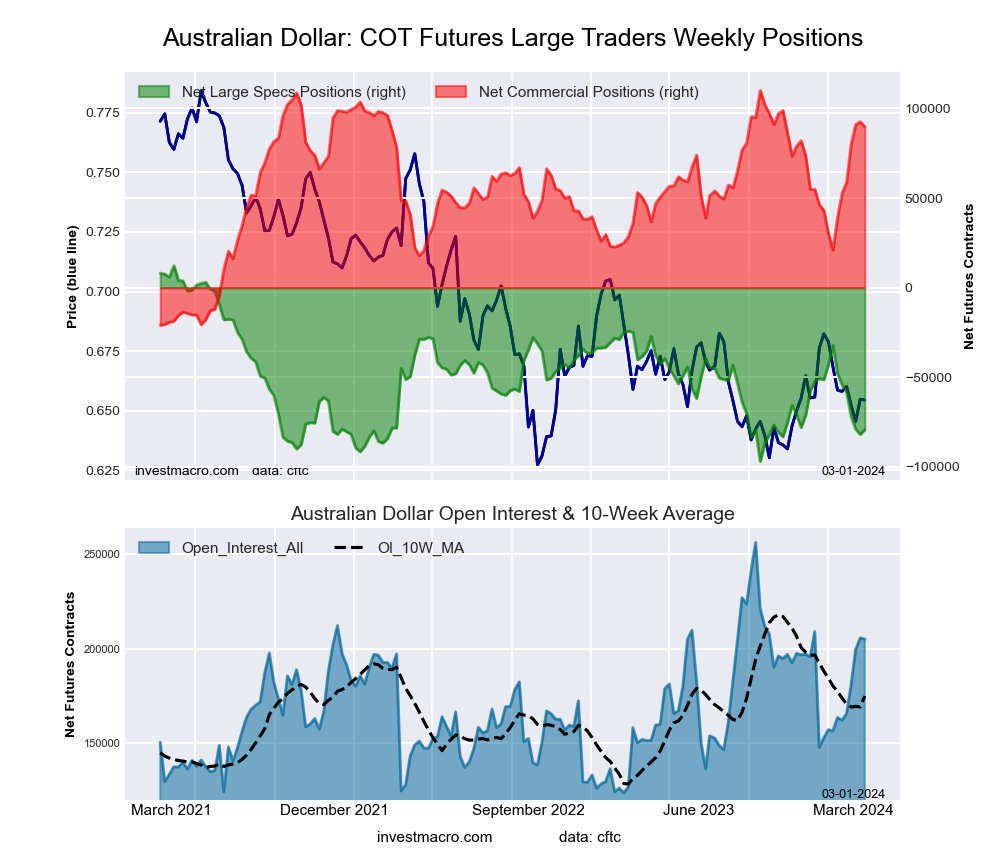
Australian Dollar Futures:
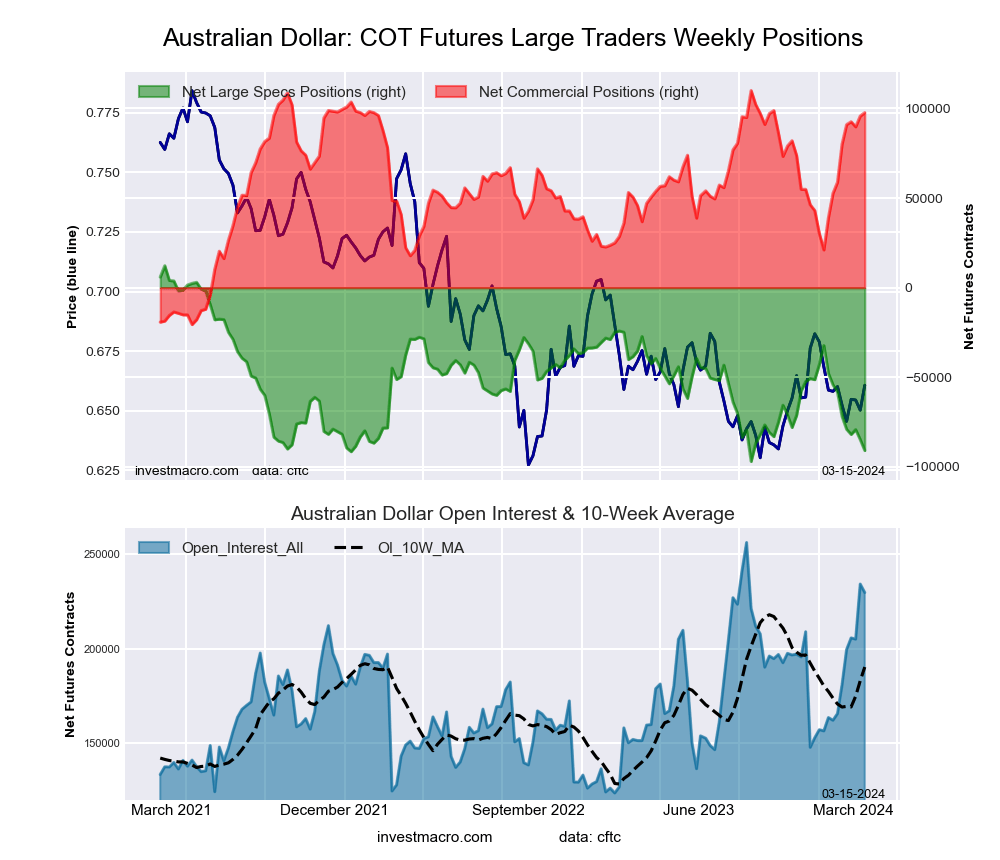 The Australian Dollar large speculator standing this week totaled a net position of -90,840 contracts in the data reported through Tuesday. This was a weekly lowering of -6,097 contracts from the previous week which had a total of -84,743 net contracts.
This week’s current strength score (the trader positioning range over the past three years, measured from 0 to 100) shows the speculators are currently Bearish-Extreme with a score of 5.6 percent. The commercials are Bullish-Extreme with a score of 90.6 percent and the small traders (not shown in chart) are Bearish with a score of 37.0 percent.
Price Trend-Following Model: Weak Uptrend
Our weekly trend-following model classifies the current market price position as: Weak Uptrend. The current action for the model is considered to be: Hold – Maintain Long Position.
| AUSTRALIAN DOLLAR Statistics | SPECULATORS | COMMERCIALS | SMALL TRADERS |
| – Percent of Open Interest Longs: | 18.1 | 66.0 | 9.1 |
| – Percent of Open Interest Shorts: | 57.6 | 23.5 | 12.1 |
| – Net Position: | -90,840 | 97,678 | -6,838 |
| – Gross Longs: | 41,591 | 151,731 | 20,858 |
| – Gross Shorts: | 132,431 | 54,053 | 27,696 |
| – Long to Short Ratio: | 0.3 to 1 | 2.8 to 1 | 0.8 to 1 |
| NET POSITION TREND: | |||
| – Strength Index Score (3 Year Range Pct): | 5.6 | 90.6 | 37.0 |
| – Strength Index Reading (3 Year Range): | Bearish-Extreme | Bullish-Extreme | Bearish |
| NET POSITION MOVEMENT INDEX: | |||
| – 6-Week Change in Strength Index: | -29.8 | 29.7 | -15.9 |
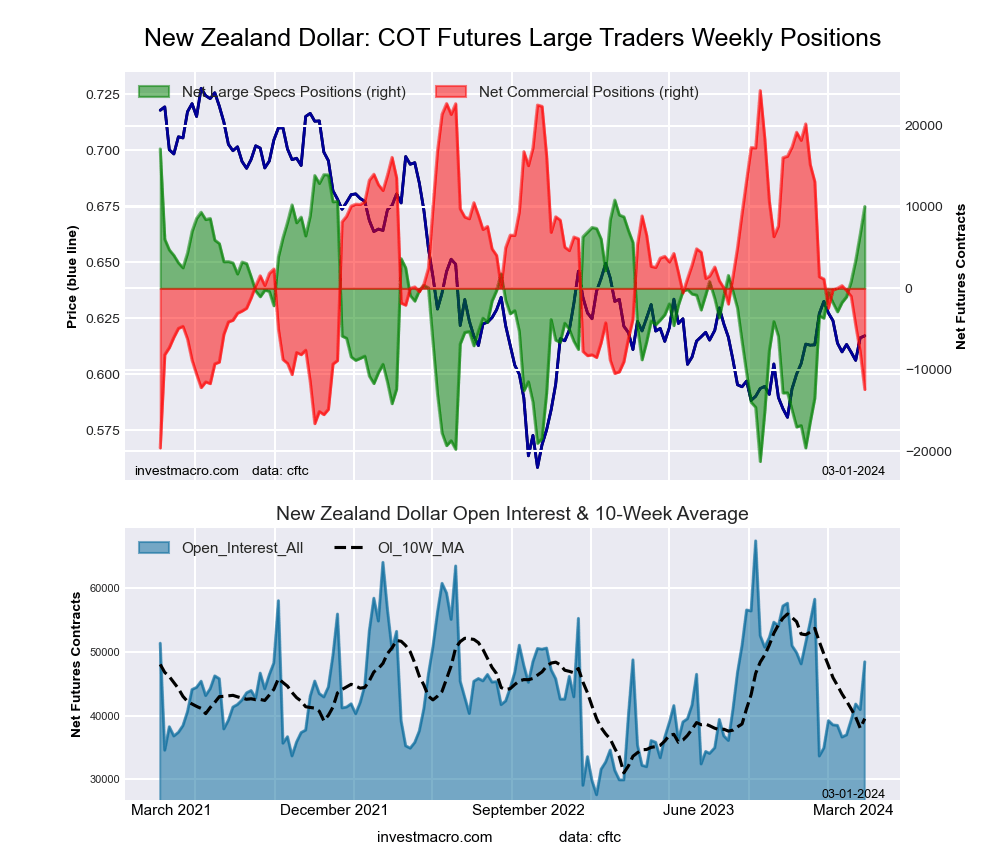
New Zealand Dollar Futures:
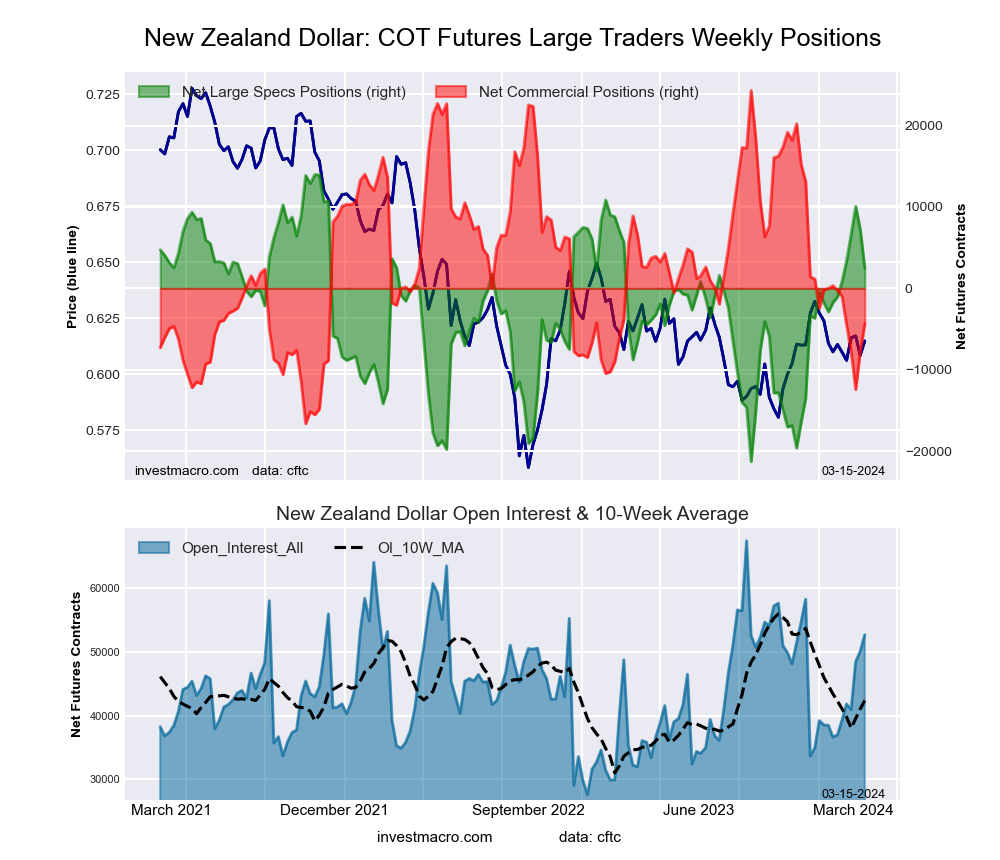 The New Zealand Dollar large speculator standing this week totaled a net position of 2,465 contracts in the data reported through Tuesday. This was a weekly reduction of -4,763 contracts from the previous week which had a total of 7,228 net contracts.
This week’s current strength score (the trader positioning range over the past three years, measured from 0 to 100) shows the speculators are currently Bullish with a score of 67.4 percent. The commercials are Bearish with a score of 30.0 percent and the small traders (not shown in chart) are Bullish with a score of 78.3 percent.
Price Trend-Following Model: Weak Uptrend
Our weekly trend-following model classifies the current market price position as: Weak Uptrend. The current action for the model is considered to be: Hold – Maintain Long Position.
| NEW ZEALAND DOLLAR Statistics | SPECULATORS | COMMERCIALS | SMALL TRADERS |
| – Percent of Open Interest Longs: | 31.1 | 50.1 | 8.9 |
| – Percent of Open Interest Shorts: | 26.4 | 58.3 | 5.4 |
| – Net Position: | 2,465 | -4,337 | 1,872 |
| – Gross Longs: | 16,391 | 26,408 | 4,700 |
| – Gross Shorts: | 13,926 | 30,745 | 2,828 |
| – Long to Short Ratio: | 1.2 to 1 | 0.9 to 1 | 1.7 to 1 |
| NET POSITION TREND: | |||
| – Strength Index Score (3 Year Range Pct): | 67.4 | 30.0 | 78.3 |
| – Strength Index Reading (3 Year Range): | Bullish | Bearish | Bullish |
| NET POSITION MOVEMENT INDEX: | |||
| – 6-Week Change in Strength Index: | 9.9 | -9.9 | 7.0 |
Mexican Peso Futures:
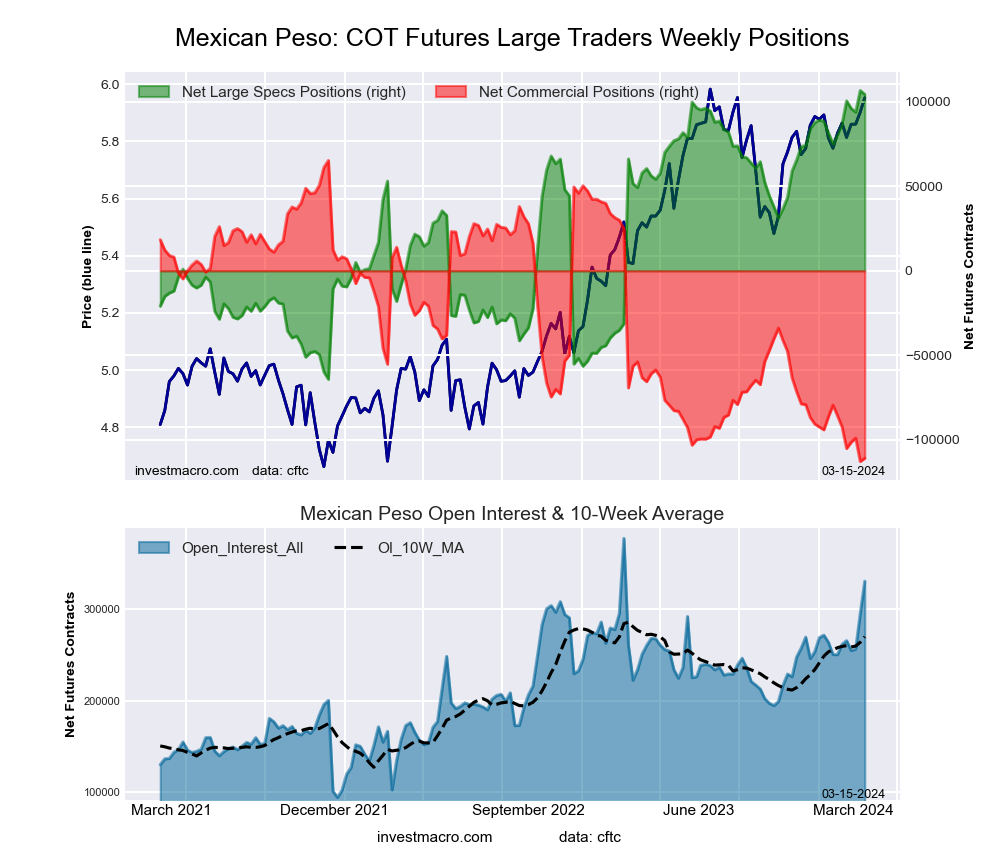 The Mexican Peso large speculator standing this week totaled a net position of 104,292 contracts in the data reported through Tuesday. This was a weekly decline of -2,294 contracts from the previous week which had a total of 106,586 net contracts.
This week’s current strength score (the trader positioning range over the past three years, measured from 0 to 100) shows the speculators are currently Bullish-Extreme with a score of 98.7 percent. The commercials are Bearish-Extreme with a score of 1.1 percent and the small traders (not shown in chart) are Bullish with a score of 52.8 percent.
Price Trend-Following Model: Strong Uptrend
Our weekly trend-following model classifies the current market price position as: Strong Uptrend. The current action for the model is considered to be: Hold – Maintain Long Position.
| MEXICAN PESO Statistics | SPECULATORS | COMMERCIALS | SMALL TRADERS |
| – Percent of Open Interest Longs: | 54.6 | 39.7 | 2.8 |
| – Percent of Open Interest Shorts: | 23.0 | 73.3 | 0.8 |
| – Net Position: | 104,292 | -110,810 | 6,518 |
| – Gross Longs: | 180,140 | 131,144 | 9,172 |
| – Gross Shorts: | 75,848 | 241,954 | 2,654 |
| – Long to Short Ratio: | 2.4 to 1 | 0.5 to 1 | 3.5 to 1 |
| NET POSITION TREND: | |||
| – Strength Index Score (3 Year Range Pct): | 98.7 | 1.1 | 52.8 |
| – Strength Index Reading (3 Year Range): | Bullish-Extreme | Bearish-Extreme | Bullish |
| NET POSITION MOVEMENT INDEX: | |||
| – 6-Week Change in Strength Index: | 14.0 | -14.1 | 7.6 |
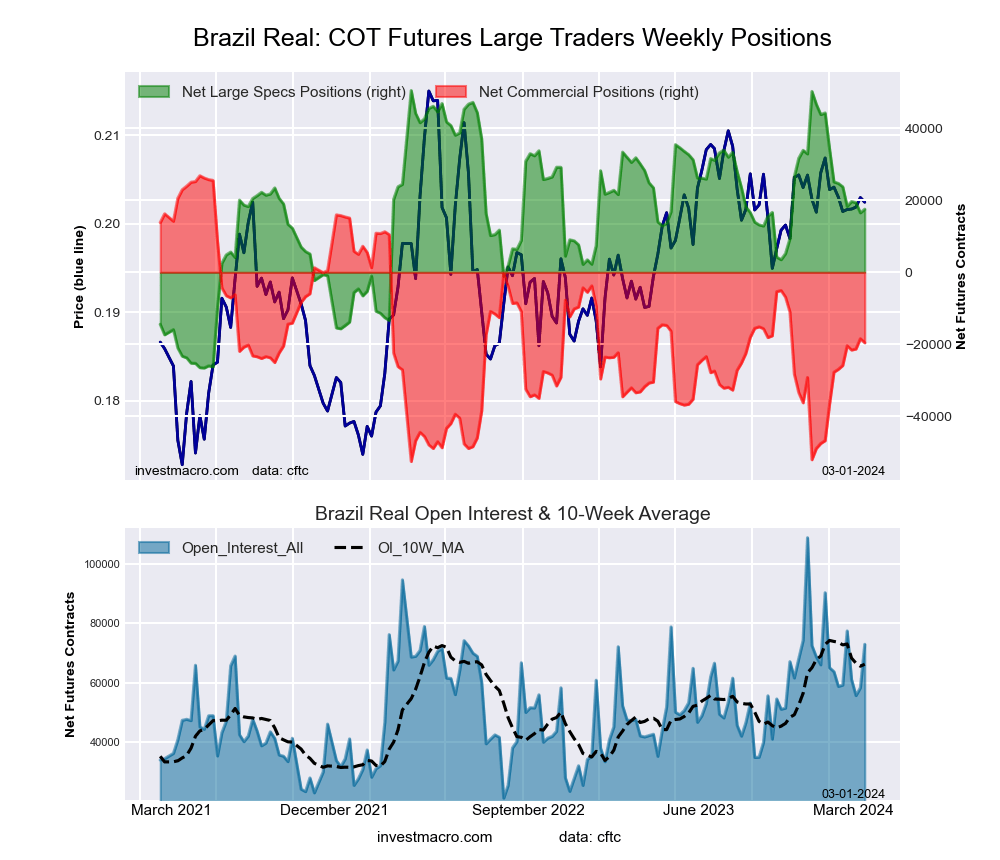
Brazilian Real Futures:
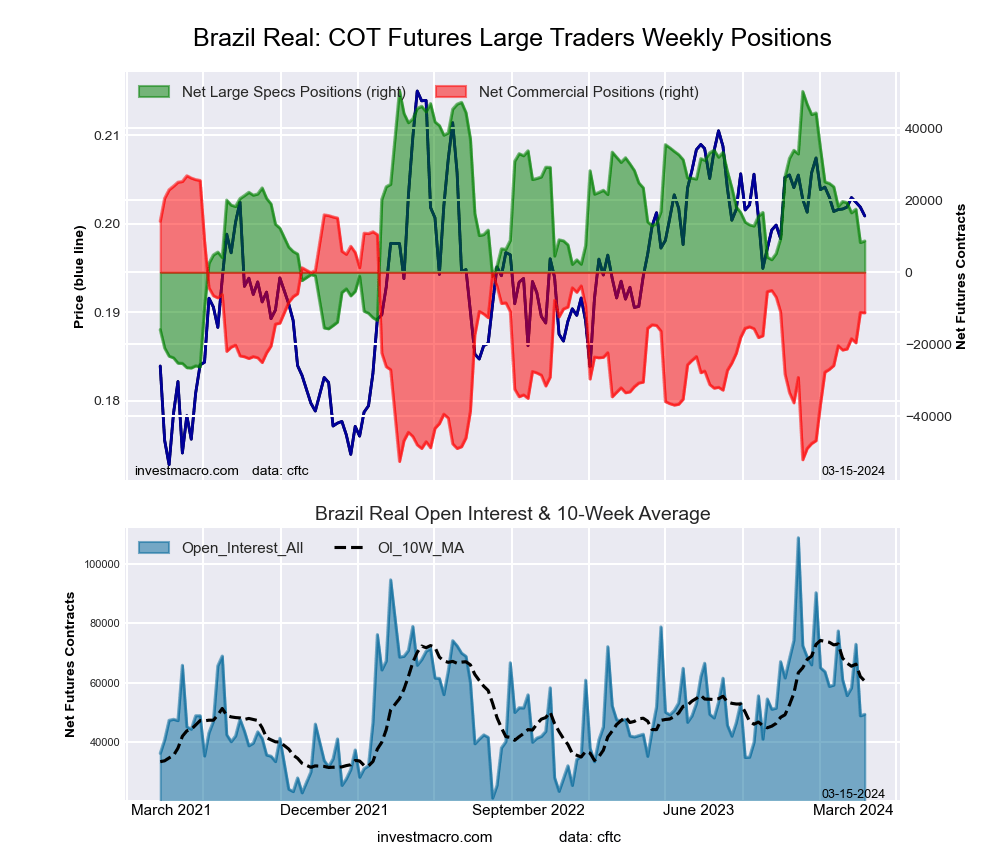 The Brazilian Real large speculator standing this week totaled a net position of 8,687 contracts in the data reported through Tuesday. This was a weekly gain of 407 contracts from the previous week which had a total of 8,280 net contracts.
This week’s current strength score (the trader positioning range over the past three years, measured from 0 to 100) shows the speculators are currently Bearish with a score of 45.8 percent. The commercials are Bullish with a score of 52.0 percent and the small traders (not shown in chart) are Bullish with a score of 58.3 percent.
Price Trend-Following Model: Strong Downtrend
Our weekly trend-following model classifies the current market price position as: Strong Downtrend. The current action for the model is considered to be: Hold – Maintain Short Position.
| BRAZIL REAL Statistics | SPECULATORS | COMMERCIALS | SMALL TRADERS |
| – Percent of Open Interest Longs: | 53.3 | 39.6 | 7.1 |
| – Percent of Open Interest Shorts: | 35.7 | 62.4 | 1.9 |
| – Net Position: | 8,687 | -11,253 | 2,566 |
| – Gross Longs: | 26,314 | 19,532 | 3,502 |
| – Gross Shorts: | 17,627 | 30,785 | 936 |
| – Long to Short Ratio: | 1.5 to 1 | 0.6 to 1 | 3.7 to 1 |
| NET POSITION TREND: | |||
| – Strength Index Score (3 Year Range Pct): | 45.8 | 52.0 | 58.3 |
| – Strength Index Reading (3 Year Range): | Bearish | Bullish | Bullish |
| NET POSITION MOVEMENT INDEX: | |||
| – 6-Week Change in Strength Index: | -12.5 | 11.6 | 4.1 |
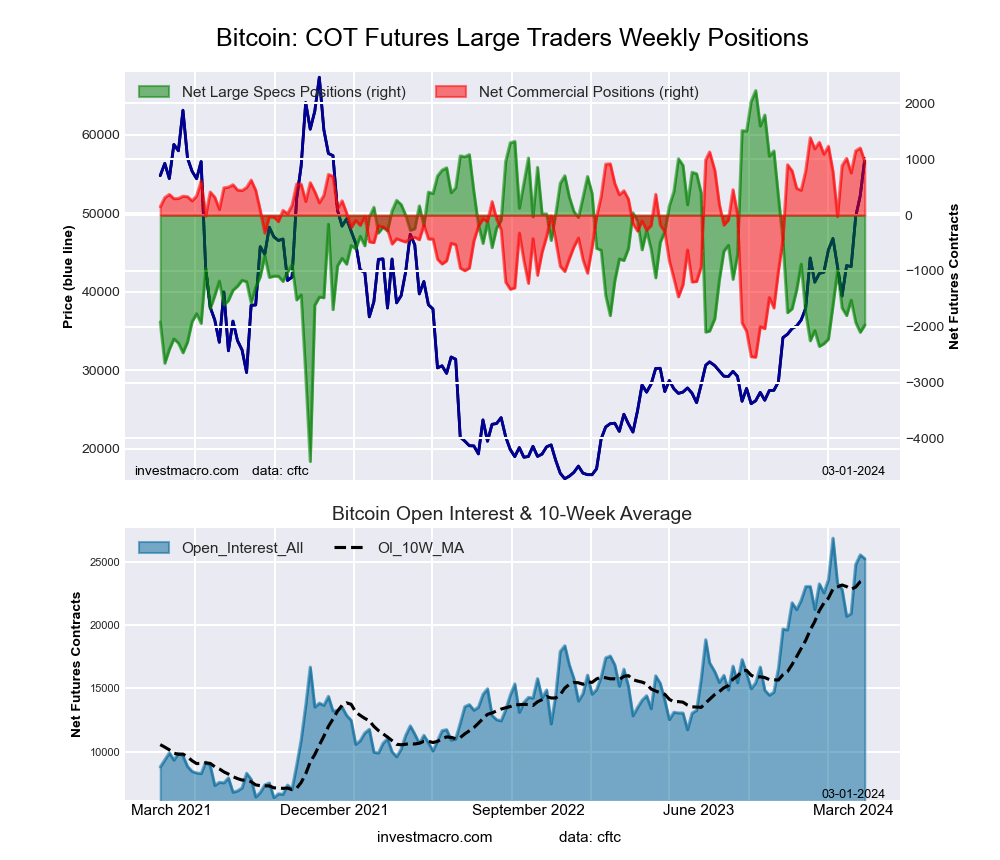
Bitcoin Futures:
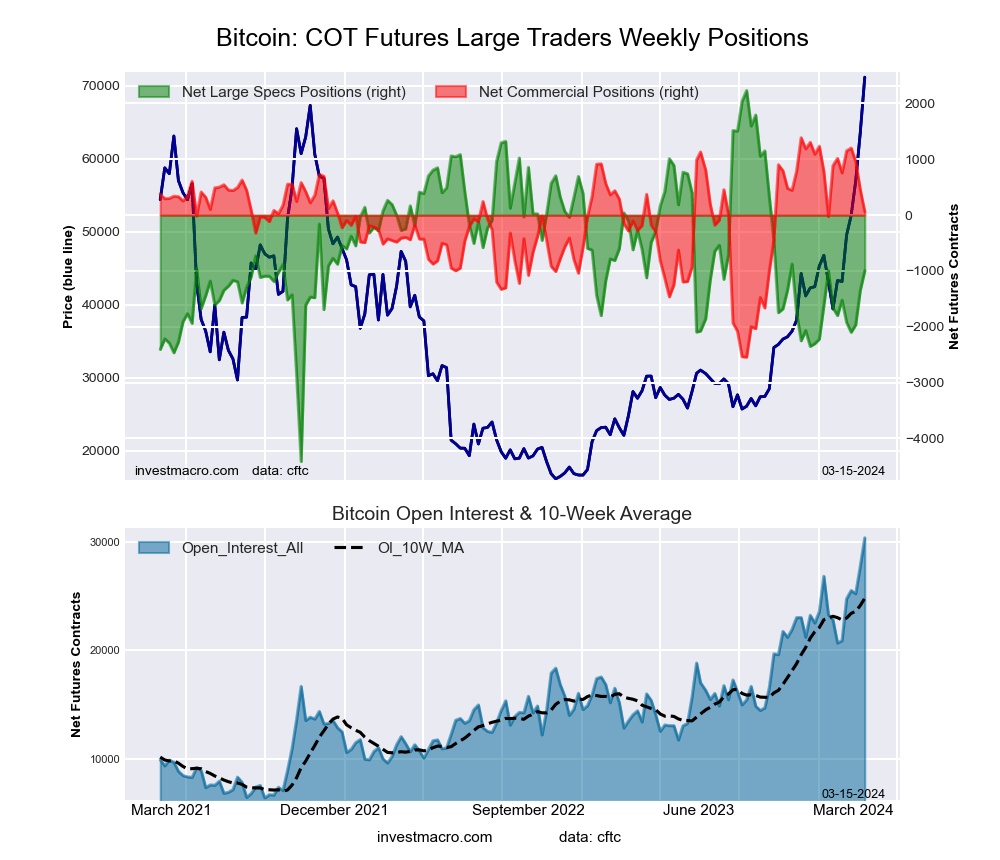 The Bitcoin large speculator standing this week totaled a net position of -994 contracts in the data reported through Tuesday. This was a weekly lift of 358 contracts from the previous week which had a total of -1,352 net contracts.
This week’s current strength score (the trader positioning range over the past three years, measured from 0 to 100) shows the speculators are currently Bullish with a score of 51.4 percent. The commercials are Bullish with a score of 66.2 percent and the small traders (not shown in chart) are Bearish with a score of 34.2 percent.
Price Trend-Following Model: Strong Uptrend
Our weekly trend-following model classifies the current market price position as: Strong Uptrend. The current action for the model is considered to be: Hold – Maintain Long Position.
| BITCOIN Statistics | SPECULATORS | COMMERCIALS | SMALL TRADERS |
| – Percent of Open Interest Longs: | 82.2 | 4.9 | 5.9 |
| – Percent of Open Interest Shorts: | 85.4 | 4.7 | 2.8 |
| – Net Position: | -994 | 59 | 935 |
| – Gross Longs: | 24,977 | 1,486 | 1,800 |
| – Gross Shorts: | 25,971 | 1,427 | 865 |
| – Long to Short Ratio: | 1.0 to 1 | 1.0 to 1 | 2.1 to 1 |
| NET POSITION TREND: | |||
| – Strength Index Score (3 Year Range Pct): | 51.4 | 66.2 | 34.2 |
| – Strength Index Reading (3 Year Range): | Bullish | Bullish | Bearish |
| NET POSITION MOVEMENT INDEX: | |||
| – 6-Week Change in Strength Index: | 12.1 | -24.4 | 3.5 |
Article By InvestMacro – Receive our weekly COT Newsletter
*COT Report: The COT data, released weekly to the public each Friday, is updated through the most recent Tuesday (data is 3 days old) and shows a quick view of how large speculators or non-commercials (for-profit traders) were positioned in the futures markets.
The CFTC categorizes trader positions according to commercial hedgers (traders who use futures contracts for hedging as part of the business), non-commercials (large traders who speculate to realize trading profits) and nonreportable traders (usually small traders/speculators) as well as their open interest (contracts open in the market at time of reporting). See CFTC criteria here.