
By InvestMacro
Here are the latest charts and statistics for the Commitment of Traders (COT) data published by the Commodities Futures Trading Commission (CFTC).
The latest COT data is updated through Tuesday November 28th and shows a quick view of how large traders (for-profit speculators and commercial entities) were positioned in the futures markets.
Weekly Speculator Changes led higher by Gold, Silver & Platinum
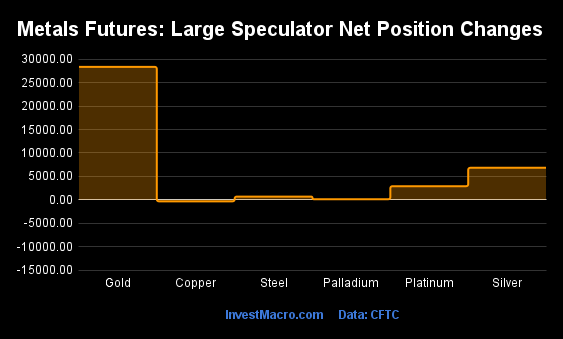
The COT metals markets speculator bets were higher this week as five out of the six metals markets we cover had higher positioning while the other one markets had lower speculator contracts.
Free Reports:
 Sign Up for Our Stock Market Newsletter – Get updated on News, Charts & Rankings of Public Companies when you join our Stocks Newsletter
 Get our Weekly Commitment of Traders Reports - See where the biggest traders (Hedge Funds and Commercial Hedgers) are positioned in the futures markets on a weekly basis.
Leading the gains for the metals was Gold (28,379 contracts) with Silver (6,828 contracts), Platinum (2,898 contracts), Steel (682 contracts) and Palladium (116 contracts) also recording positive weeks.
The only market with a decline in speculator bets this week was Copper with a dip of just -329 contracts.
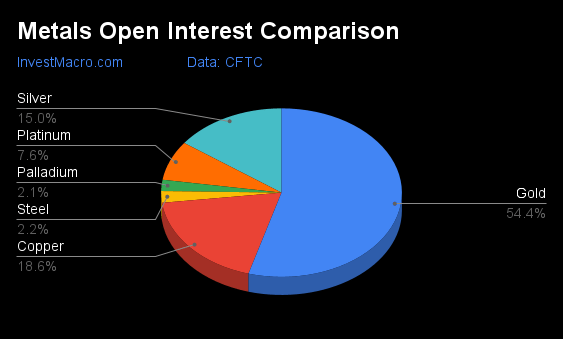
| Nov-28-2023 | OI | OI-Index | Spec-Net | Spec-Index | Com-Net | COM-Index | Smalls-Net | Smalls-Index |
|---|---|---|---|---|---|---|---|---|
| Gold | 505,658 | 39 | 200,084 | 65 | -218,592 | 40 | 18,508 | 29 |
| Silver | 139,144 | 31 | 34,280 | 67 | -47,855 | 36 | 13,575 | 42 |
| Copper | 173,233 | 21 | -3,872 | 28 | 4,912 | 76 | -1,040 | 12 |
| Palladium | 19,904 | 65 | -10,171 | 9 | 10,348 | 93 | -177 | 31 |
| Platinum | 70,437 | 52 | 10,034 | 39 | -14,272 | 64 | 4,238 | 25 |
Strength Scores led by Steel, Silver & Gold
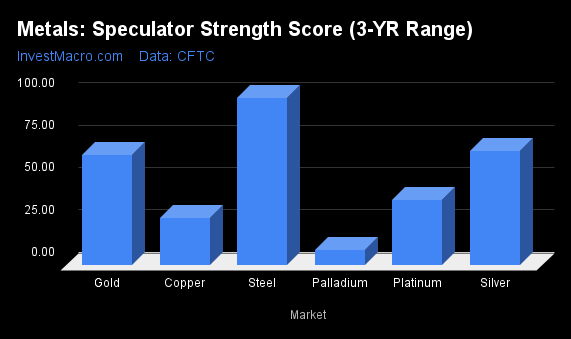
COT Strength Scores (a normalized measure of Speculator positions over a 3-Year range, from 0 to 100 where above 80 is Extreme-Bullish and below 20 is Extreme-Bearish) showed that Steel (99 percent), Silver (67 percent) and Gold (65 percent) lead the metals markets this week.
On the downside, Palladium (9 percent) comes in at the lowest strength level currently and is in Extreme-Bearish territory (below 20 percent).
Strength Statistics:
Gold (65.1 percent) vs Gold previous week (52.6 percent)
Silver (67.2 percent) vs Silver previous week (57.4 percent)
Copper (27.5 percent) vs Copper previous week (27.8 percent)
Platinum (38.7 percent) vs Platinum previous week (32.1 percent)
Palladium (8.7 percent) vs Palladium previous week (7.9 percent)
Steel (98.6 percent) vs Palladium previous week (95.9 percent)
Gold & Platinum top the 6-Week Strength Trends
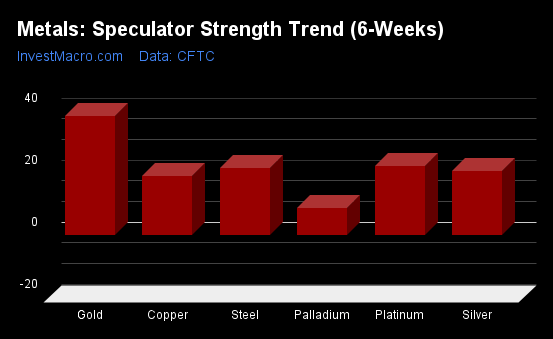
COT Strength Score Trends (or move index, calculates the 6-week changes in strength scores) showed that Gold (38 percent) and Platinum (22 percent) lead the past six weeks trends for metals. All the markets in the metals category have positive trends for the past six weeks.
Move Statistics:
Gold (38.4 percent) vs Gold previous week (44.1 percent)
Silver (20.7 percent) vs Silver previous week (21.6 percent)
Copper (19.0 percent) vs Copper previous week (9.7 percent)
Platinum (22.4 percent) vs Platinum previous week (16.6 percent)
Palladium (8.7 percent) vs Palladium previous week (6.2 percent)
Steel (21.8 percent) vs Steel previous week (19.0 percent)
Individual Markets:
Gold Comex Futures:
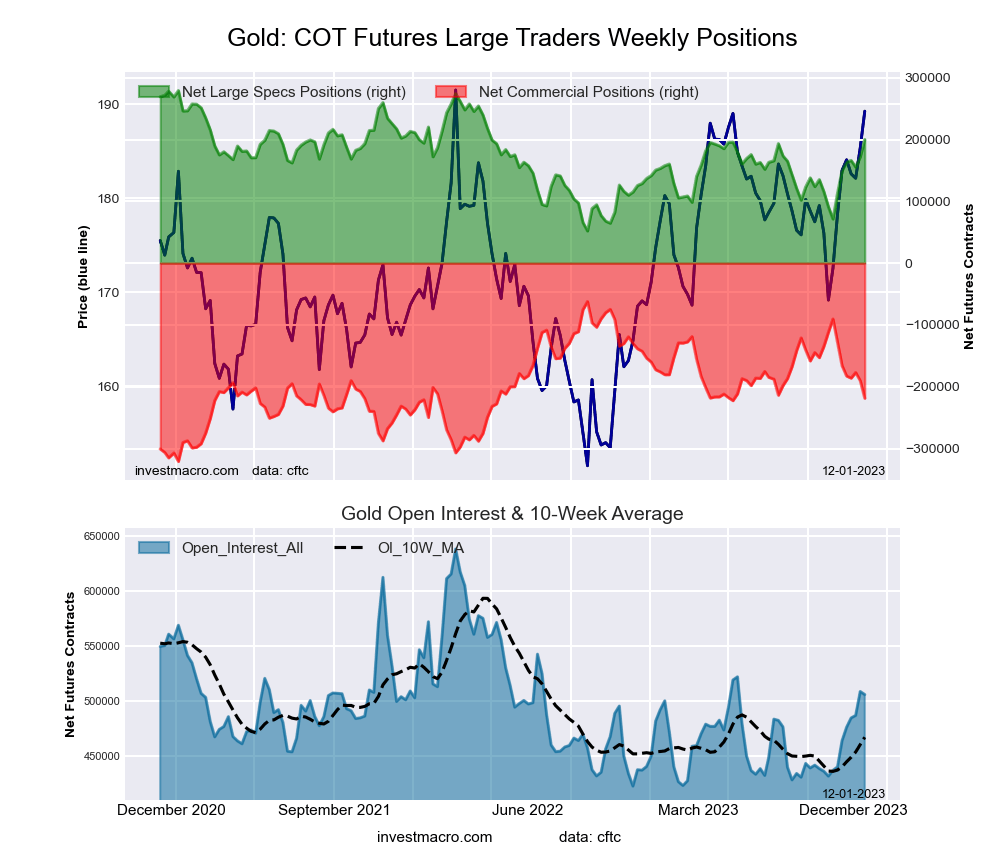 The Gold Comex Futures large speculator standing this week reached a net position of 200,084 contracts in the data reported through Tuesday. This was a weekly lift of 28,379 contracts from the previous week which had a total of 171,705 net contracts.
This week’s current strength score (the trader positioning range over the past three years, measured from 0 to 100) shows the speculators are currently Bullish with a score of 65.1 percent. The commercials are Bearish with a score of 39.5 percent and the small traders (not shown in chart) are Bearish with a score of 29.1 percent.
Price Trend-Following Model: Strong Uptrend
Our weekly trend-following model classifies the current market price position as: Strong Uptrend. The current action for the model is considered to be: Hold – Maintain Long Position.
| Gold Futures Statistics | SPECULATORS | COMMERCIALS | SMALL TRADERS |
| – Percent of Open Interest Longs: | 57.3 | 22.9 | 9.0 |
| – Percent of Open Interest Shorts: | 17.8 | 66.1 | 5.4 |
| – Net Position: | 200,084 | -218,592 | 18,508 |
| – Gross Longs: | 289,845 | 115,596 | 45,650 |
| – Gross Shorts: | 89,761 | 334,188 | 27,142 |
| – Long to Short Ratio: | 3.2 to 1 | 0.3 to 1 | 1.7 to 1 |
| NET POSITION TREND: | |||
| – Strength Index Score (3 Year Range Pct): | 65.1 | 39.5 | 29.1 |
| – Strength Index Reading (3 Year Range): | Bullish | Bearish | Bearish |
| NET POSITION MOVEMENT INDEX: | |||
| – 6-Week Change in Strength Index: | 38.4 | -35.0 | 9.0 |
Silver Comex Futures:
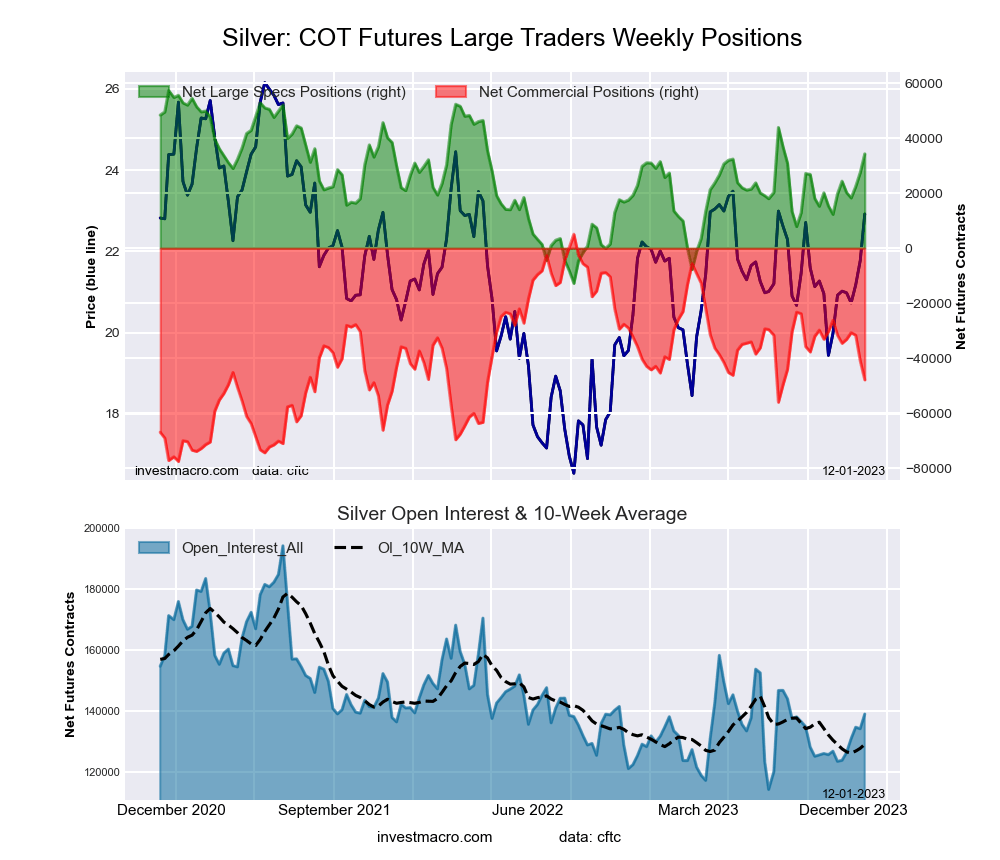 The Silver Comex Futures large speculator standing this week reached a net position of 34,280 contracts in the data reported through Tuesday. This was a weekly lift of 6,828 contracts from the previous week which had a total of 27,452 net contracts.
This week’s current strength score (the trader positioning range over the past three years, measured from 0 to 100) shows the speculators are currently Bullish with a score of 67.2 percent. The commercials are Bearish with a score of 35.9 percent and the small traders (not shown in chart) are Bearish with a score of 41.8 percent.
Price Trend-Following Model: Weak Downtrend (Possible Trend Change)
Our weekly trend-following model classifies the current market price position as: Weak Downtrend. The current action for the model is considered to be: Hold – Maintain Short Position.
| Silver Futures Statistics | SPECULATORS | COMMERCIALS | SMALL TRADERS |
| – Percent of Open Interest Longs: | 45.2 | 29.0 | 19.2 |
| – Percent of Open Interest Shorts: | 20.6 | 63.3 | 9.4 |
| – Net Position: | 34,280 | -47,855 | 13,575 |
| – Gross Longs: | 62,880 | 40,287 | 26,647 |
| – Gross Shorts: | 28,600 | 88,142 | 13,072 |
| – Long to Short Ratio: | 2.2 to 1 | 0.5 to 1 | 2.0 to 1 |
| NET POSITION TREND: | |||
| – Strength Index Score (3 Year Range Pct): | 67.2 | 35.9 | 41.8 |
| – Strength Index Reading (3 Year Range): | Bullish | Bearish | Bearish |
| NET POSITION MOVEMENT INDEX: | |||
| – 6-Week Change in Strength Index: | 20.7 | -19.7 | 9.5 |
Copper Grade #1 Futures:
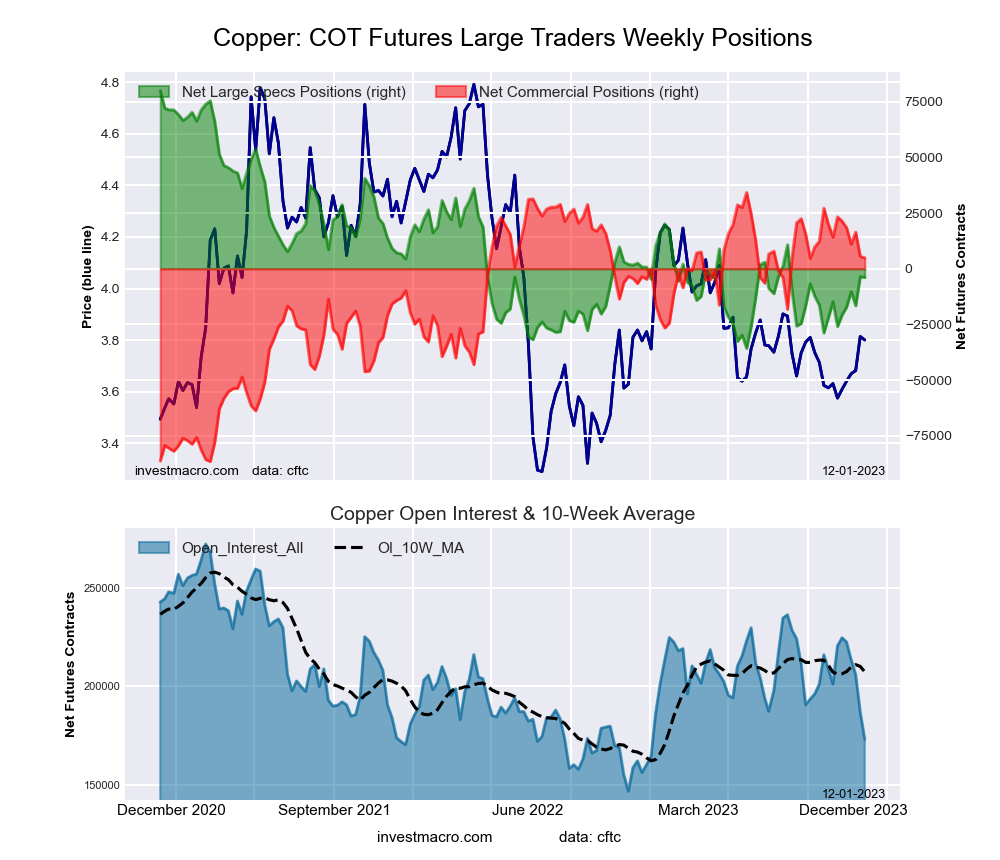 The Copper Grade #1 Futures large speculator standing this week reached a net position of -3,872 contracts in the data reported through Tuesday. This was a weekly fall of -329 contracts from the previous week which had a total of -3,543 net contracts.
This week’s current strength score (the trader positioning range over the past three years, measured from 0 to 100) shows the speculators are currently Bearish with a score of 27.5 percent. The commercials are Bullish with a score of 75.7 percent and the small traders (not shown in chart) are Bearish-Extreme with a score of 11.9 percent.
Price Trend-Following Model: Weak Downtrend (Possible Trend Change)
Our weekly trend-following model classifies the current market price position as: Weak Downtrend. The current action for the model is considered to be: Hold – Maintain Short Position.
| Copper Futures Statistics | SPECULATORS | COMMERCIALS | SMALL TRADERS |
| – Percent of Open Interest Longs: | 36.2 | 38.9 | 7.7 |
| – Percent of Open Interest Shorts: | 38.5 | 36.0 | 8.3 |
| – Net Position: | -3,872 | 4,912 | -1,040 |
| – Gross Longs: | 62,749 | 67,348 | 13,309 |
| – Gross Shorts: | 66,621 | 62,436 | 14,349 |
| – Long to Short Ratio: | 0.9 to 1 | 1.1 to 1 | 0.9 to 1 |
| NET POSITION TREND: | |||
| – Strength Index Score (3 Year Range Pct): | 27.5 | 75.7 | 11.9 |
| – Strength Index Reading (3 Year Range): | Bearish | Bullish | Bearish-Extreme |
| NET POSITION MOVEMENT INDEX: | |||
| – 6-Week Change in Strength Index: | 19.0 | -15.2 | -22.8 |
Platinum Futures:
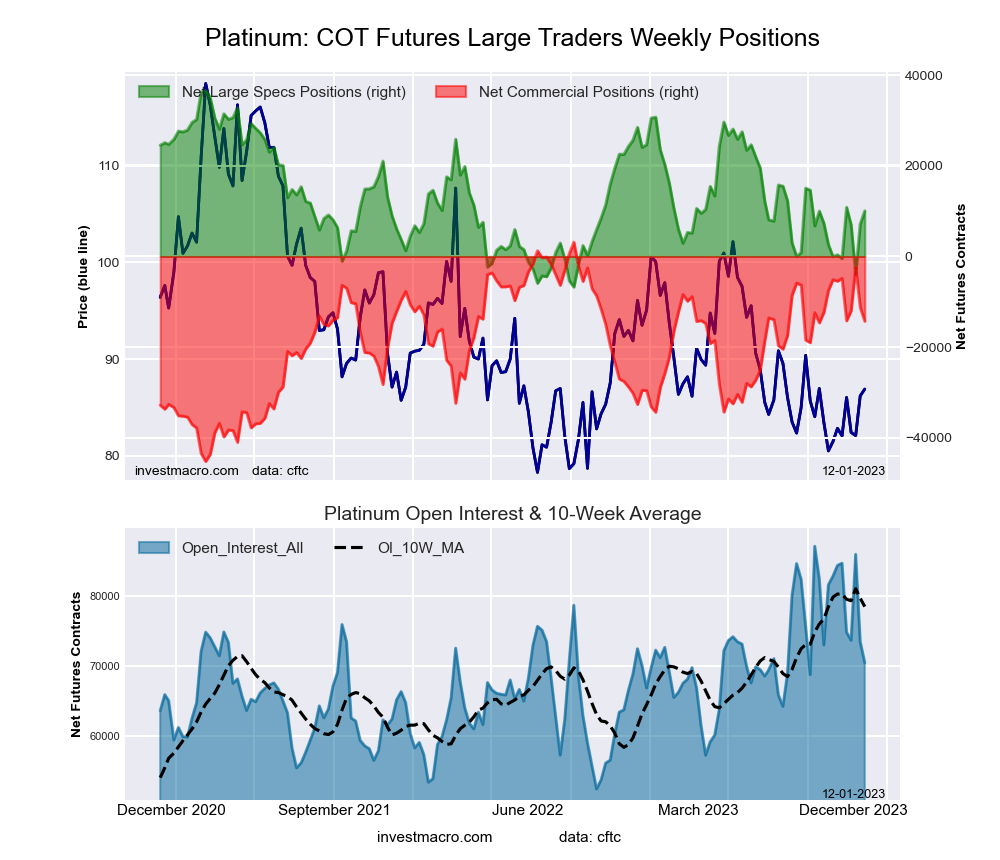 The Platinum Futures large speculator standing this week reached a net position of 10,034 contracts in the data reported through Tuesday. This was a weekly lift of 2,898 contracts from the previous week which had a total of 7,136 net contracts.
This week’s current strength score (the trader positioning range over the past three years, measured from 0 to 100) shows the speculators are currently Bearish with a score of 38.7 percent. The commercials are Bullish with a score of 64.0 percent and the small traders (not shown in chart) are Bearish with a score of 24.9 percent.
Price Trend-Following Model: Weak Downtrend (Possible Trend Change)
Our weekly trend-following model classifies the current market price position as: Weak Downtrend. The current action for the model is considered to be: Hold – Maintain Short Position.
| Platinum Futures Statistics | SPECULATORS | COMMERCIALS | SMALL TRADERS |
| – Percent of Open Interest Longs: | 54.6 | 25.0 | 10.5 |
| – Percent of Open Interest Shorts: | 40.3 | 45.3 | 4.5 |
| – Net Position: | 10,034 | -14,272 | 4,238 |
| – Gross Longs: | 38,438 | 17,603 | 7,403 |
| – Gross Shorts: | 28,404 | 31,875 | 3,165 |
| – Long to Short Ratio: | 1.4 to 1 | 0.6 to 1 | 2.3 to 1 |
| NET POSITION TREND: | |||
| – Strength Index Score (3 Year Range Pct): | 38.7 | 64.0 | 24.9 |
| – Strength Index Reading (3 Year Range): | Bearish | Bullish | Bearish |
| NET POSITION MOVEMENT INDEX: | |||
| – 6-Week Change in Strength Index: | 22.4 | -18.2 | -11.5 |
Palladium Futures:
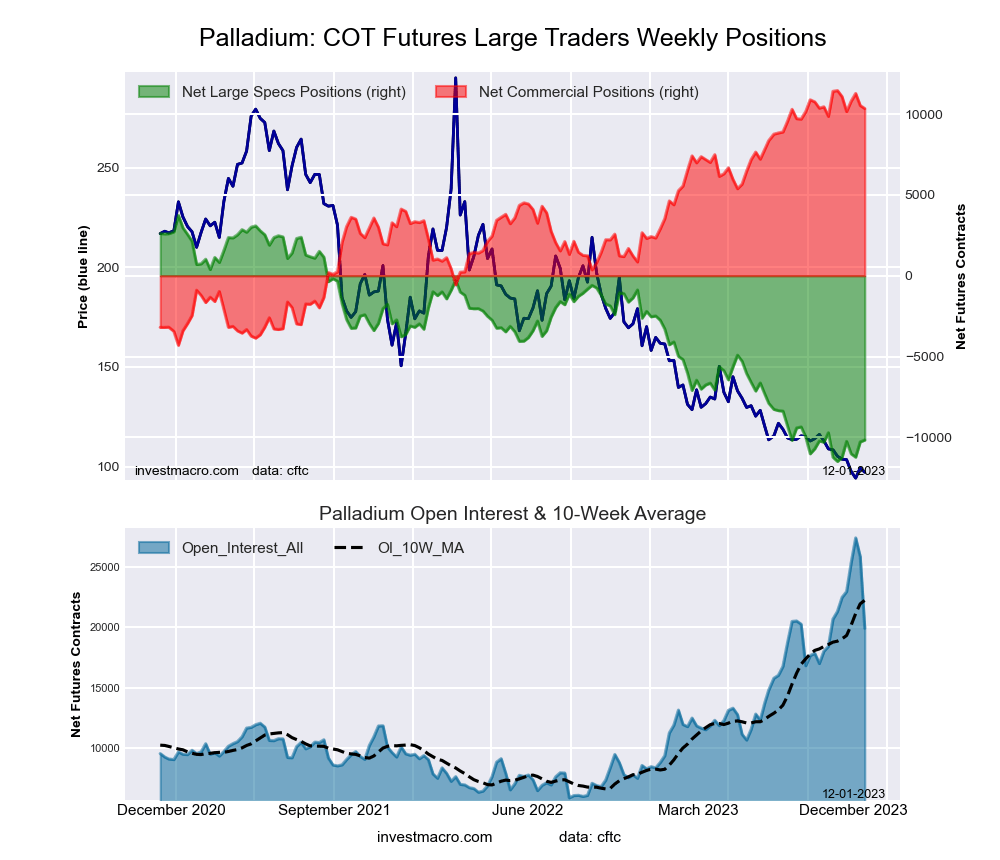 The Palladium Futures large speculator standing this week reached a net position of -10,171 contracts in the data reported through Tuesday. This was a weekly boost of 116 contracts from the previous week which had a total of -10,287 net contracts.
This week’s current strength score (the trader positioning range over the past three years, measured from 0 to 100) shows the speculators are currently Bearish-Extreme with a score of 8.7 percent. The commercials are Bullish-Extreme with a score of 92.9 percent and the small traders (not shown in chart) are Bearish with a score of 31.1 percent.
Price Trend-Following Model: Strong Downtrend
Our weekly trend-following model classifies the current market price position as: Strong Downtrend. The current action for the model is considered to be: Hold – Maintain Short Position.
| Palladium Futures Statistics | SPECULATORS | COMMERCIALS | SMALL TRADERS |
| – Percent of Open Interest Longs: | 24.1 | 59.2 | 8.1 |
| – Percent of Open Interest Shorts: | 75.2 | 7.2 | 9.0 |
| – Net Position: | -10,171 | 10,348 | -177 |
| – Gross Longs: | 4,804 | 11,790 | 1,610 |
| – Gross Shorts: | 14,975 | 1,442 | 1,787 |
| – Long to Short Ratio: | 0.3 to 1 | 8.2 to 1 | 0.9 to 1 |
| NET POSITION TREND: | |||
| – Strength Index Score (3 Year Range Pct): | 8.7 | 92.9 | 31.1 |
| – Strength Index Reading (3 Year Range): | Bearish-Extreme | Bullish-Extreme | Bearish |
| NET POSITION MOVEMENT INDEX: | |||
| – 6-Week Change in Strength Index: | 8.7 | -7.1 | -12.6 |
Steel Futures Futures:
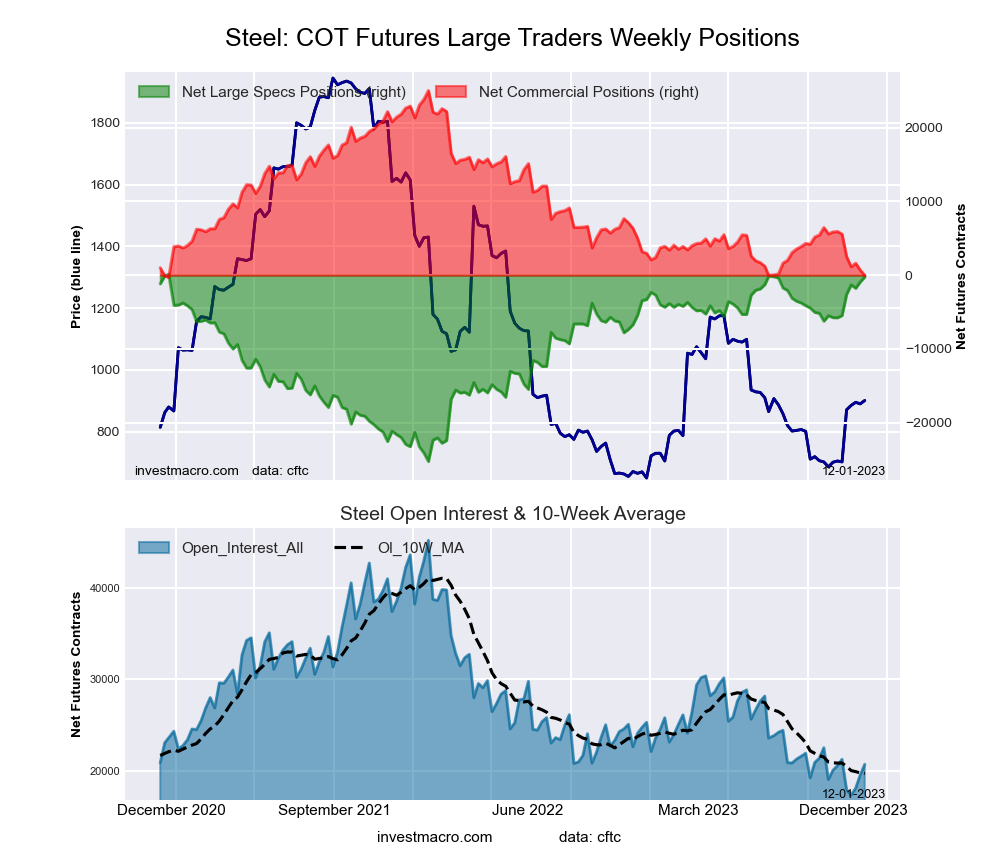 The Steel Futures large speculator standing this week reached a net position of -233 contracts in the data reported through Tuesday. This was a weekly advance of 682 contracts from the previous week which had a total of -915 net contracts.
This week’s current strength score (the trader positioning range over the past three years, measured from 0 to 100) shows the speculators are currently Bullish-Extreme with a score of 98.6 percent. The commercials are Bearish-Extreme with a score of 1.1 percent and the small traders (not shown in chart) are Bullish with a score of 61.2 percent.
Price Trend-Following Model: Strong Uptrend
Our weekly trend-following model classifies the current market price position as: Strong Uptrend. The current action for the model is considered to be: Hold – Maintain Long Position.
| Steel Futures Statistics | SPECULATORS | COMMERCIALS | SMALL TRADERS |
| – Percent of Open Interest Longs: | 24.0 | 70.3 | 2.2 |
| – Percent of Open Interest Shorts: | 25.1 | 70.4 | 0.9 |
| – Net Position: | -233 | -30 | 263 |
| – Gross Longs: | 4,967 | 14,556 | 453 |
| – Gross Shorts: | 5,200 | 14,586 | 190 |
| – Long to Short Ratio: | 1.0 to 1 | 1.0 to 1 | 2.4 to 1 |
| NET POSITION TREND: | |||
| – Strength Index Score (3 Year Range Pct): | 98.6 | 1.1 | 61.2 |
| – Strength Index Reading (3 Year Range): | Bullish-Extreme | Bearish-Extreme | Bullish |
| NET POSITION MOVEMENT INDEX: | |||
| – 6-Week Change in Strength Index: | 21.8 | -23.5 | 46.4 |
Article By InvestMacro – Receive our weekly COT Newsletter
*COT Report: The COT data, released weekly to the public each Friday, is updated through the most recent Tuesday (data is 3 days old) and shows a quick view of how large speculators or non-commercials (for-profit traders) were positioned in the futures markets.
The CFTC categorizes trader positions according to commercial hedgers (traders who use futures contracts for hedging as part of the business), non-commercials (large traders who speculate to realize trading profits) and nonreportable traders (usually small traders/speculators) as well as their open interest (contracts open in the market at time of reporting). See CFTC criteria here.

- COT Metals Charts: Weekly Speculator Bets see small gains for Silver & Gold Jul 12, 2026
- COT Bonds Charts: Speculator Bets led by SOFR 3-Months & 2-Year Bonds Jul 12, 2026
- COT Energy Charts: Weekly Speculator Changes led by Brent Oil Jul 12, 2026
- COT Soft Commodities Charts: Weekly Speculator Changes led by Sugar, Corn & Soybeans Jul 12, 2026
- The US and European stock indices are rising again amid renewed investor interest in the AI industry. Jul 10, 2026
- USD/JPY Falls as Yen Recovers Weekly Losses Jul 10, 2026
- Crude oil prices surged sharply by 7% in reaction to the rapid escalation of the conflict in the Middle East Jul 9, 2026
- Middle East Tensions Weigh on Gold Jul 9, 2026
- Pound Awaits Tighter Policy from Bank of England Jul 8, 2026
- The United States carried out airstrikes on Iran after Iran’s attacked tankers in the Strait of Hormuz. The RBNZ raised the interest rate to 2.5% Jul 8, 2026