
By InvestMacro
Here are the latest charts and statistics for the Commitment of Traders (COT) data published by the Commodities Futures Trading Commission (CFTC).
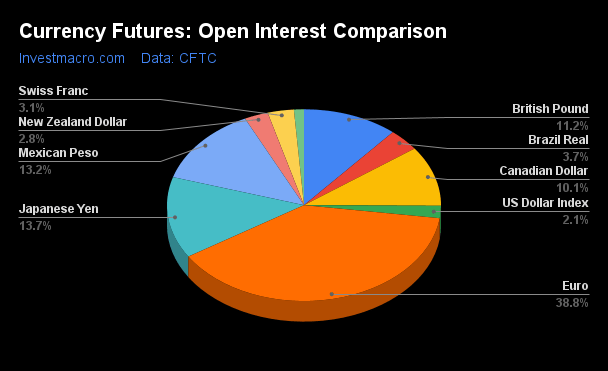
The latest COT data is updated through Tuesday December 5th and shows a quick view of how large market participants (for-profit speculators and commercial traders) were positioned in the futures markets. All currency positions are in direct relation to the US dollar where, for example, a bet for the euro is a bet that the euro will rise versus the dollar while a bet against the euro will be a bet that the euro will decline versus the dollar.
Weekly Speculator Changes led by British Pound & Brazilian Real
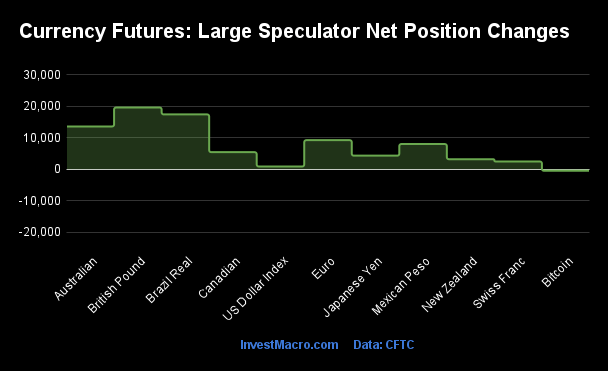
The COT currency market speculator bets were higher this week as ten out of the eleven currency markets we cover had higher positioning while the other one markets had lower speculator contracts.
Free Reports:
 Get our Weekly Commitment of Traders Reports - See where the biggest traders (Hedge Funds and Commercial Hedgers) are positioned in the futures markets on a weekly basis.
 Sign Up for Our Stock Market Newsletter – Get updated on News, Charts & Rankings of Public Companies when you join our Stocks Newsletter
Leading the gains for the currency markets was the British Pound (19,560 contracts) with the Brazilian Real (17,363 contracts), the Australian Dollar (13,538 contracts), the EuroFX (9,195 contracts), the Mexican Peso (7,971 contracts), the Canadian Dollar (5,394 contracts), the Japanese Yen (4,281 contracts), the New Zealand Dollar (3,159 contracts), the Swiss Franc (2,437 contracts) and the US Dollar Index (857 contracts) also experiencing positive weeks.
The only currency (cryptocurrency) seeing a decline in speculator bets on the week was the Bitcoin with a dip by -505 contracts.
Currency Speculators raise their British Pound bets into bullish level
Highlighting the COT currency’s data is the continued gains in the speculator positioning for the British Pound Sterling. The Pound Sterling speculative positioning rose this week by almost +20,000 contracts, following up on last week’s gain by +18,203 contracts. The GBP speculator position has now risen in four out of the past five weeks and by a total of +32,036 contracts over that period.
This bullishness has brought the net speculator standing (currently at +11,665 contracts) back into an overall bullish level for the first time since September 26th.
The British Pound Sterling’s exchange rate with the US Dollar took a breather this week after gaining for three consecutive weeks and touching over the 1.2700 level. The Sterling’s exchange descended this week to the major psychological support level of 1.2500 but managed to bounce from that major support back up to 1.2551 to close out the week.
| Dec-05-2023 | OI | OI-Index | Spec-Net | Spec-Index | Com-Net | COM-Index | Smalls-Net | Smalls-Index |
|---|---|---|---|---|---|---|---|---|
| USD Index | 40,451 | 36 | 19,944 | 58 | -19,561 | 45 | -383 | 5 |
| EUR | 756,615 | 65 | 152,360 | 85 | -188,929 | 18 | 36,569 | 37 |
| GBP | 218,873 | 48 | 11,665 | 64 | -11,983 | 39 | 318 | 59 |
| JPY | 267,482 | 87 | -104,956 | 14 | 106,218 | 87 | -1,262 | 51 |
| CHF | 60,356 | 96 | -17,852 | 8 | 23,713 | 83 | -5,861 | 40 |
| CAD | 197,791 | 59 | -57,848 | 11 | 63,290 | 91 | -5,442 | 11 |
| AUD | 195,569 | 54 | -57,681 | 36 | 54,899 | 58 | 2,782 | 59 |
| NZD | 54,732 | 68 | -16,450 | 13 | 15,215 | 79 | 1,235 | 65 |
| MXN | 257,053 | 58 | 73,456 | 84 | -78,636 | 15 | 5,180 | 44 |
| RUB | 20,930 | 4 | 7,543 | 31 | -7,150 | 69 | -393 | 24 |
| BRL | 72,487 | 59 | 50,244 | 100 | -52,089 | 1 | 1,845 | 52 |
| Bitcoin | 23,035 | 100 | -2,250 | 33 | 1,387 | 0 | 863 | 33 |
Strength Scores led by Brazilian Real & EuroFX
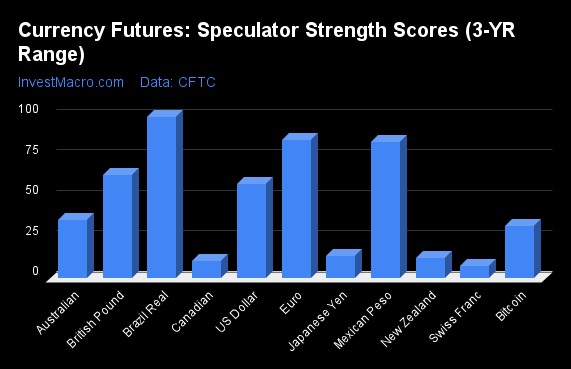
COT Strength Scores (a normalized measure of Speculator positions over a 3-Year range, from 0 to 100 where above 80 is Extreme-Bullish and below 20 is Extreme-Bearish) showed that the Brazilian Real (100 percent) and the EuroFX (85 percent) lead the currency markets this week. The Mexican Peso (84 percent), British Pound (64 percent) and the US Dollar Index (58 percent) come in as the next highest in the weekly strength scores.
On the downside, the Swiss Franc (8 percent), the Canadian Dollar (11 percent), the New Zealand Dollar (13 percent) and the Japanese Yen (14 percent) come in at the lowest strength levels currently and are in Extreme-Bearish territory (below 20 percent).
Strength Statistics:
US Dollar Index (58.2 percent) vs US Dollar Index previous week (56.8 percent)
EuroFX (85.2 percent) vs EuroFX previous week (81.3 percent)
British Pound Sterling (63.9 percent) vs British Pound Sterling previous week (50.3 percent)
Japanese Yen (14.0 percent) vs Japanese Yen previous week (11.6 percent)
Swiss Franc (7.9 percent) vs Swiss Franc previous week (1.0 percent)
Canadian Dollar (10.5 percent) vs Canadian Dollar previous week (6.0 percent)
Australian Dollar (36.0 percent) vs Australian Dollar previous week (23.6 percent)
New Zealand Dollar (12.6 percent) vs New Zealand Dollar previous week (4.3 percent)
Mexican Peso (84.0 percent) vs Mexican Peso previous week (79.1 percent)
Brazilian Real (99.7 percent) vs Brazilian Real previous week (77.1 percent)
Bitcoin (32.5 percent) vs Bitcoin previous week (40.1 percent)
Brazilian Real & EuroFX top the 6-Week Strength Trends
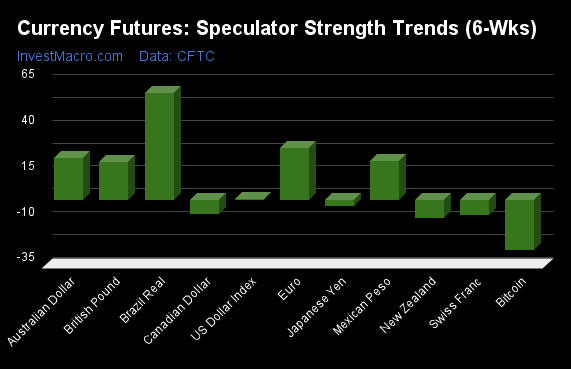
COT Strength Score Trends (or move index, calculates the 6-week changes in strength scores) showed that the Brazilian Real (58 percent) and the EuroFX (29 percent) lead the past six weeks trends for the currencies. The Australian Dollar (23 percent), the Mexican Peso (22 percent) and the British Pound (21 percent) are the next highest positive movers in the latest trends data.
The Bitcoin (-27 percent) leads the downside trend scores currently with the New Zealand Dollar (-9 percent), Canadian Dollar (-8 percent) and the Swiss Franc (-8 percent) following next with lower trend scores.
Strength Trend Statistics:
US Dollar Index (0.5 percent) vs US Dollar Index previous week (-0.1 percent)
EuroFX (28.6 percent) vs EuroFX previous week (25.9 percent)
British Pound Sterling (21.0 percent) vs British Pound Sterling previous week (2.3 percent)
Japanese Yen (-2.9 percent) vs Japanese Yen previous week (-3.6 percent)
Swiss Franc (-7.8 percent) vs Swiss Franc previous week (-9.1 percent)
Canadian Dollar (-7.7 percent) vs Canadian Dollar previous week (-12.3 percent)
Australian Dollar (23.3 percent) vs Australian Dollar previous week (8.7 percent)
New Zealand Dollar (-9.4 percent) vs New Zealand Dollar previous week (-35.7 percent)
Mexican Peso (21.7 percent) vs Mexican Peso previous week (12.9 percent)
Brazilian Real (58.5 percent) vs Brazilian Real previous week (38.1 percent)
Bitcoin (-27.0 percent) vs Bitcoin previous week (-31.2 percent)
Individual COT Forex Markets:
US Dollar Index Futures:
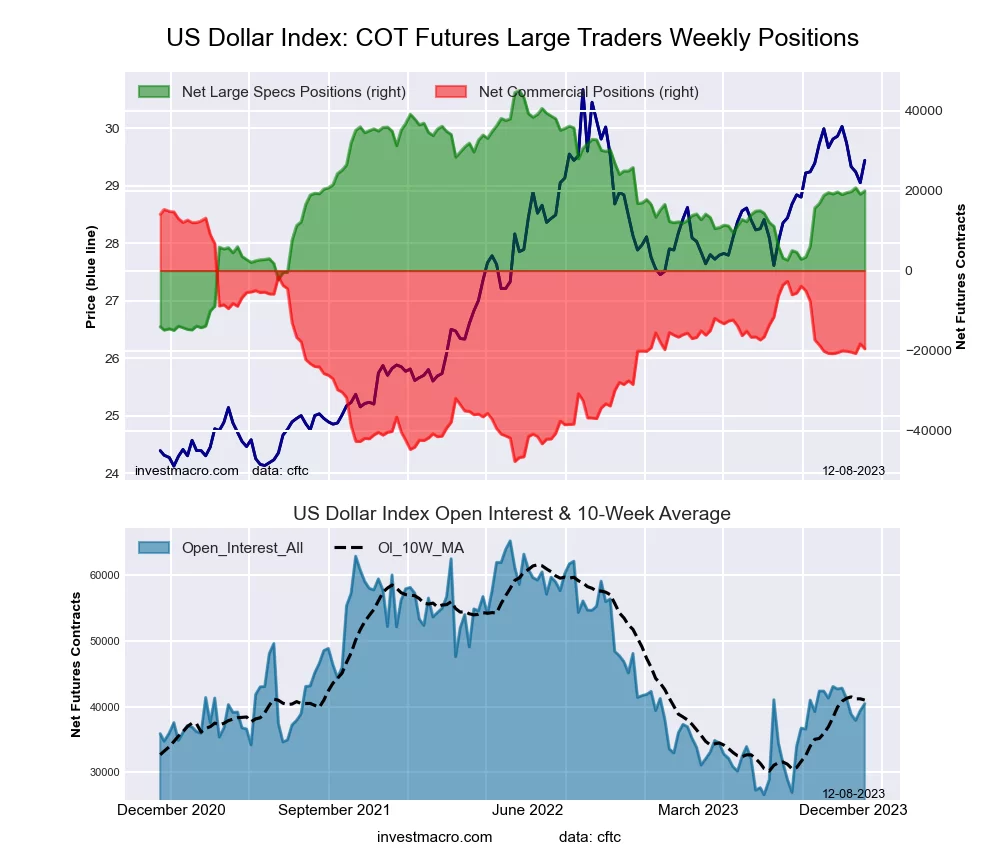 The US Dollar Index large speculator standing this week totaled a net position of 19,944 contracts in the data reported through Tuesday. This was a weekly gain of 857 contracts from the previous week which had a total of 19,087 net contracts.
This week’s current strength score (the trader positioning range over the past three years, measured from 0 to 100) shows the speculators are currently Bullish with a score of 58.2 percent. The commercials are Bearish with a score of 44.7 percent and the small traders (not shown in chart) are Bearish-Extreme with a score of 4.9 percent.
Price Trend-Following Model: Uptrend
Our weekly trend-following model classifies the current market price position as: Uptrend. The current action for the model is considered to be: Hold – Maintain Long Position.
| US DOLLAR INDEX Statistics | SPECULATORS | COMMERCIALS | SMALL TRADERS |
| – Percent of Open Interest Longs: | 69.7 | 17.3 | 7.1 |
| – Percent of Open Interest Shorts: | 20.4 | 65.7 | 8.1 |
| – Net Position: | 19,944 | -19,561 | -383 |
| – Gross Longs: | 28,199 | 7,009 | 2,891 |
| – Gross Shorts: | 8,255 | 26,570 | 3,274 |
| – Long to Short Ratio: | 3.4 to 1 | 0.3 to 1 | 0.9 to 1 |
| NET POSITION TREND: | |||
| – Strength Index Score (3 Year Range Pct): | 58.2 | 44.7 | 4.9 |
| – Strength Index Reading (3 Year Range): | Bullish | Bearish | Bearish-Extreme |
| NET POSITION MOVEMENT INDEX: | |||
| – 6-Week Change in Strength Index: | 0.5 | 1.5 | -14.8 |
Euro Currency Futures:
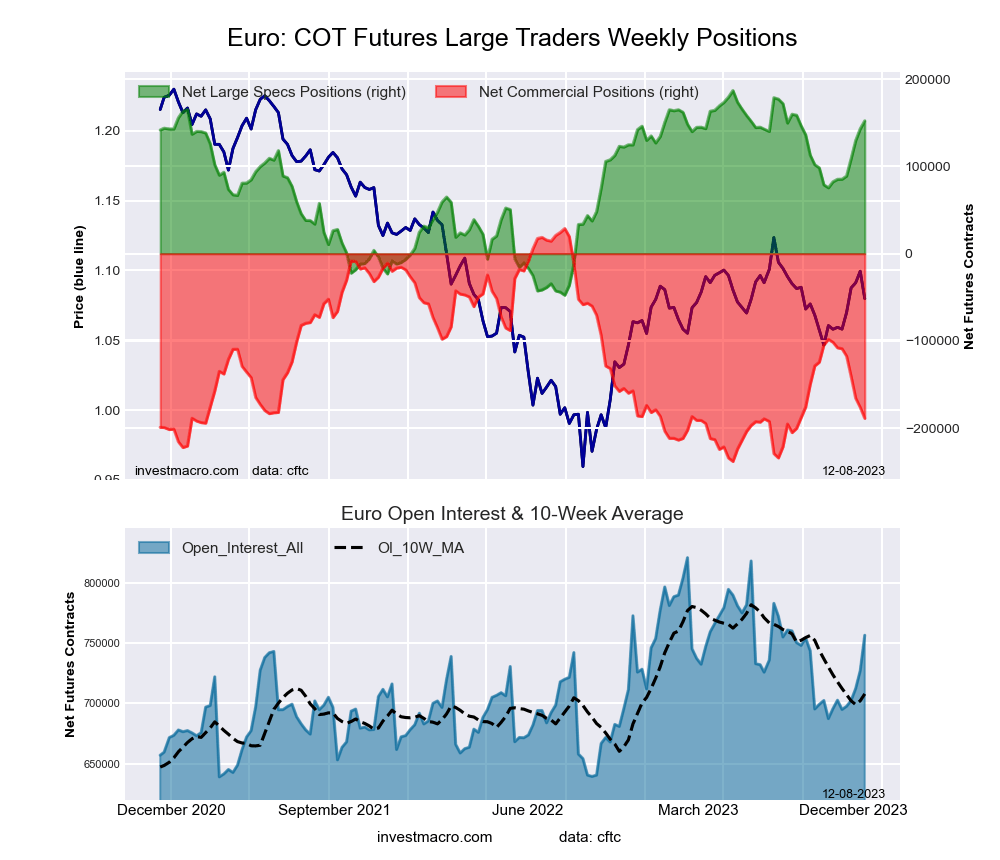 The Euro Currency large speculator standing this week totaled a net position of 152,360 contracts in the data reported through Tuesday. This was a weekly advance of 9,195 contracts from the previous week which had a total of 143,165 net contracts.
This week’s current strength score (the trader positioning range over the past three years, measured from 0 to 100) shows the speculators are currently Bullish-Extreme with a score of 85.2 percent. The commercials are Bearish-Extreme with a score of 18.5 percent and the small traders (not shown in chart) are Bearish with a score of 37.3 percent.
Price Trend-Following Model: Downtrend
Our weekly trend-following model classifies the current market price position as: Downtrend. The current action for the model is considered to be: Hold – Maintain Short Position.
| EURO Currency Statistics | SPECULATORS | COMMERCIALS | SMALL TRADERS |
| – Percent of Open Interest Longs: | 31.1 | 53.5 | 11.4 |
| – Percent of Open Interest Shorts: | 11.0 | 78.4 | 6.5 |
| – Net Position: | 152,360 | -188,929 | 36,569 |
| – Gross Longs: | 235,684 | 404,550 | 85,929 |
| – Gross Shorts: | 83,324 | 593,479 | 49,360 |
| – Long to Short Ratio: | 2.8 to 1 | 0.7 to 1 | 1.7 to 1 |
| NET POSITION TREND: | |||
| – Strength Index Score (3 Year Range Pct): | 85.2 | 18.5 | 37.3 |
| – Strength Index Reading (3 Year Range): | Bullish-Extreme | Bearish-Extreme | Bearish |
| NET POSITION MOVEMENT INDEX: | |||
| – 6-Week Change in Strength Index: | 28.6 | -30.3 | 22.1 |
British Pound Sterling Futures:
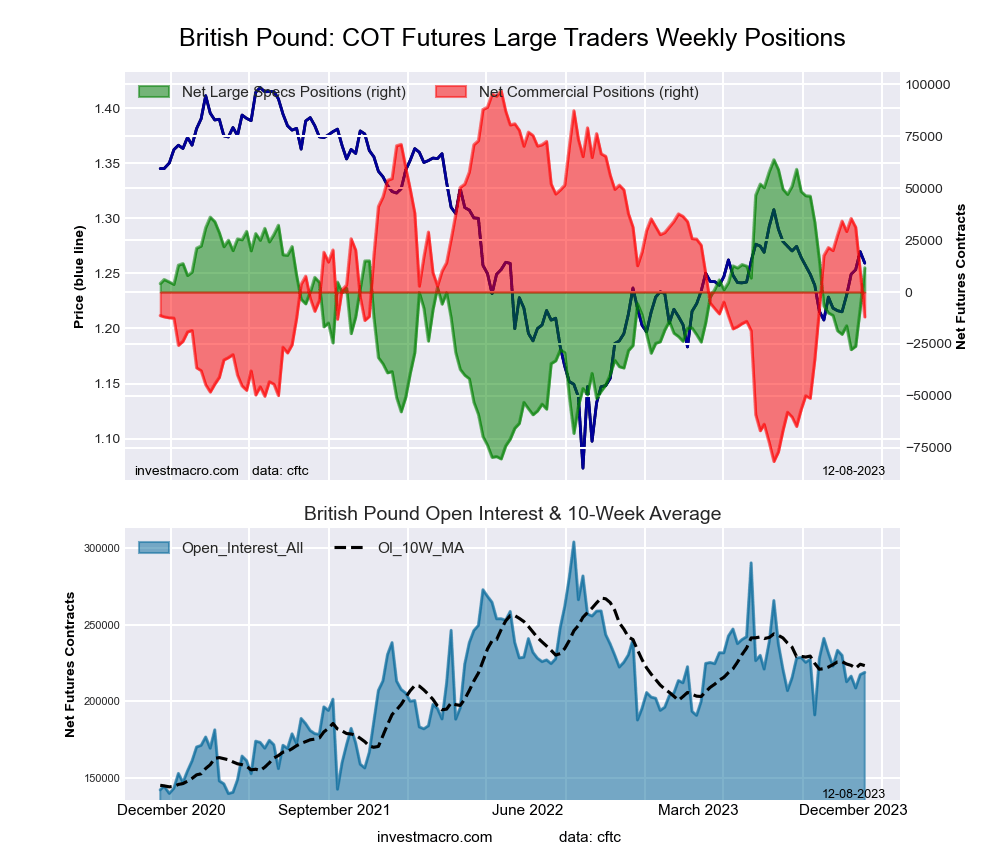 The British Pound Sterling large speculator standing this week totaled a net position of 11,665 contracts in the data reported through Tuesday. This was a weekly gain of 19,560 contracts from the previous week which had a total of -7,895 net contracts.
This week’s current strength score (the trader positioning range over the past three years, measured from 0 to 100) shows the speculators are currently Bullish with a score of 63.9 percent. The commercials are Bearish with a score of 39.0 percent and the small traders (not shown in chart) are Bullish with a score of 58.6 percent.
Price Trend-Following Model: Weak Downtrend (Possible Trend Change)
Our weekly trend-following model classifies the current market price position as: Weak Downtrend. The current action for the model is considered to be: Hold – Maintain Short Position.
| BRITISH POUND Statistics | SPECULATORS | COMMERCIALS | SMALL TRADERS |
| – Percent of Open Interest Longs: | 30.3 | 49.9 | 13.1 |
| – Percent of Open Interest Shorts: | 25.0 | 55.3 | 12.9 |
| – Net Position: | 11,665 | -11,983 | 318 |
| – Gross Longs: | 66,359 | 109,112 | 28,621 |
| – Gross Shorts: | 54,694 | 121,095 | 28,303 |
| – Long to Short Ratio: | 1.2 to 1 | 0.9 to 1 | 1.0 to 1 |
| NET POSITION TREND: | |||
| – Strength Index Score (3 Year Range Pct): | 63.9 | 39.0 | 58.6 |
| – Strength Index Reading (3 Year Range): | Bullish | Bearish | Bullish |
| NET POSITION MOVEMENT INDEX: | |||
| – 6-Week Change in Strength Index: | 21.0 | -22.0 | 17.7 |
Japanese Yen Futures:
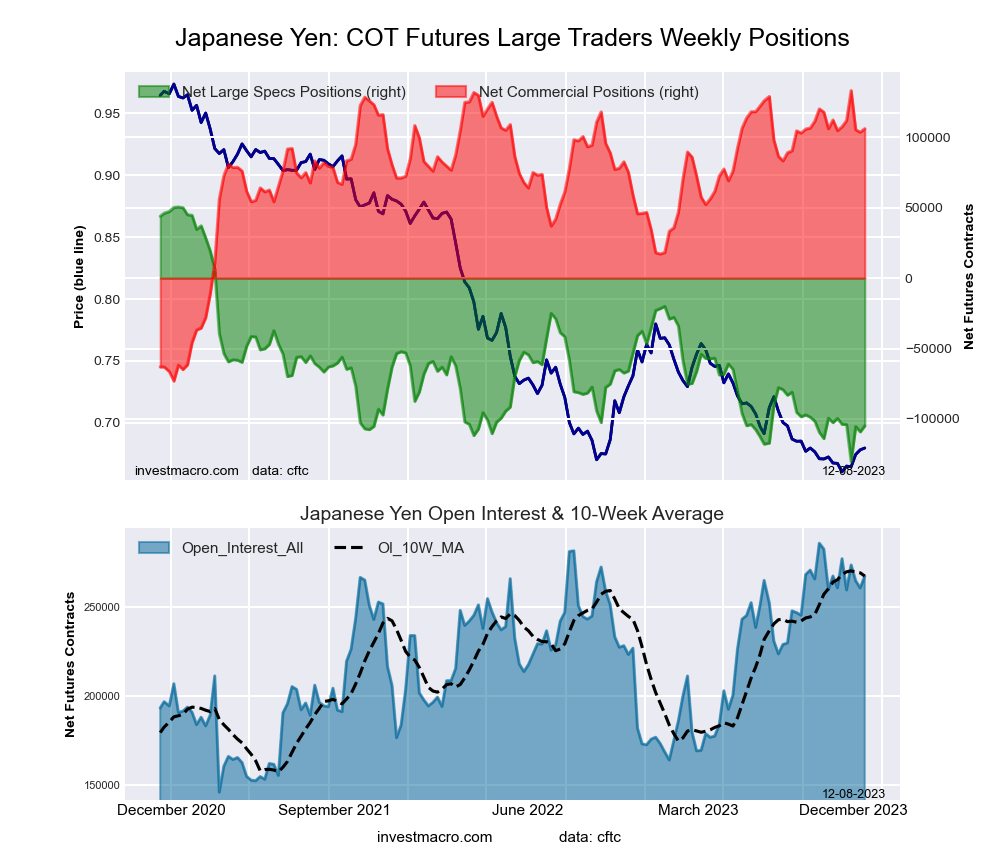 The Japanese Yen large speculator standing this week totaled a net position of -104,956 contracts in the data reported through Tuesday. This was a weekly gain of 4,281 contracts from the previous week which had a total of -109,237 net contracts.
This week’s current strength score (the trader positioning range over the past three years, measured from 0 to 100) shows the speculators are currently Bearish-Extreme with a score of 14.0 percent. The commercials are Bullish-Extreme with a score of 86.9 percent and the small traders (not shown in chart) are Bullish with a score of 50.9 percent.
Price Trend-Following Model: Weak Downtrend (Possible Trend Change)
Our weekly trend-following model classifies the current market price position as: Weak Downtrend. The current action for the model is considered to be: Hold – Maintain Short Position.
| JAPANESE YEN Statistics | SPECULATORS | COMMERCIALS | SMALL TRADERS |
| – Percent of Open Interest Longs: | 10.6 | 68.8 | 15.7 |
| – Percent of Open Interest Shorts: | 49.8 | 29.1 | 16.1 |
| – Net Position: | -104,956 | 106,218 | -1,262 |
| – Gross Longs: | 28,266 | 184,156 | 41,899 |
| – Gross Shorts: | 133,222 | 77,938 | 43,161 |
| – Long to Short Ratio: | 0.2 to 1 | 2.4 to 1 | 1.0 to 1 |
| NET POSITION TREND: | |||
| – Strength Index Score (3 Year Range Pct): | 14.0 | 86.9 | 50.9 |
| – Strength Index Reading (3 Year Range): | Bearish-Extreme | Bullish-Extreme | Bullish |
| NET POSITION MOVEMENT INDEX: | |||
| – 6-Week Change in Strength Index: | -2.9 | 0.7 | 8.0 |
Swiss Franc Futures:
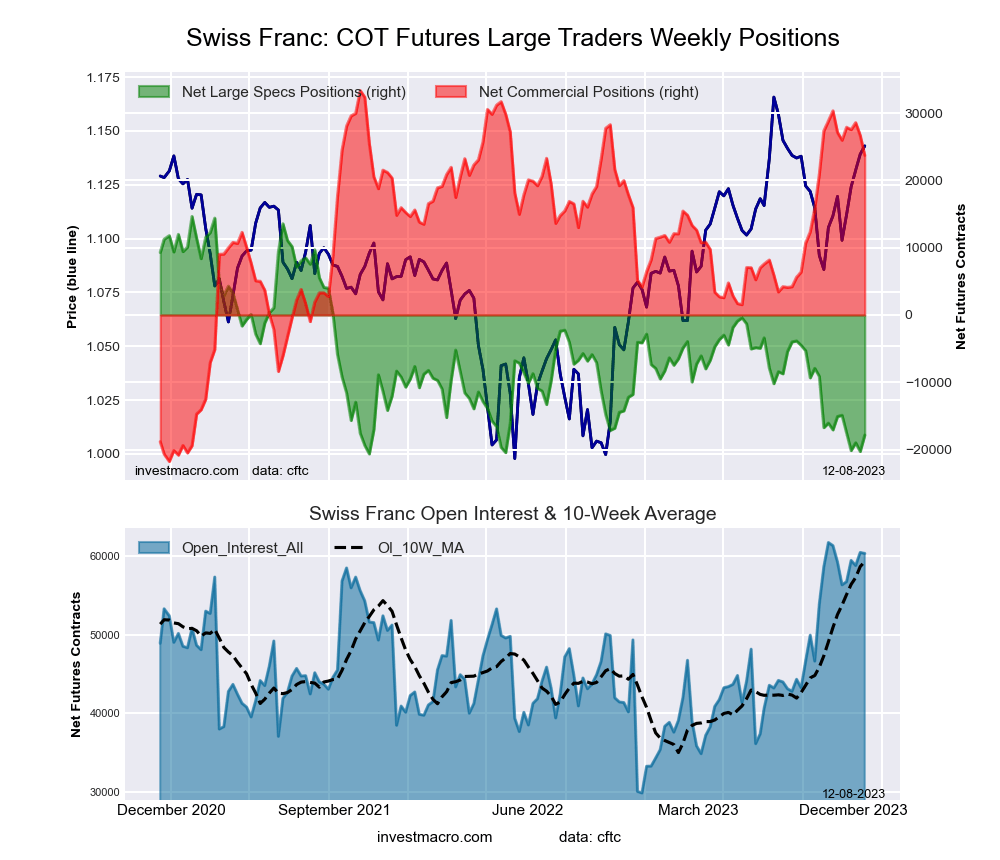 The Swiss Franc large speculator standing this week totaled a net position of -17,852 contracts in the data reported through Tuesday. This was a weekly increase of 2,437 contracts from the previous week which had a total of -20,289 net contracts.
This week’s current strength score (the trader positioning range over the past three years, measured from 0 to 100) shows the speculators are currently Bearish-Extreme with a score of 7.9 percent. The commercials are Bullish-Extreme with a score of 82.5 percent and the small traders (not shown in chart) are Bearish with a score of 40.1 percent.
Price Trend-Following Model: Weak Downtrend (Possible Trend Change)
Our weekly trend-following model classifies the current market price position as: Weak Downtrend. The current action for the model is considered to be: Hold – Maintain Short Position.
| SWISS FRANC Statistics | SPECULATORS | COMMERCIALS | SMALL TRADERS |
| – Percent of Open Interest Longs: | 6.2 | 69.9 | 21.0 |
| – Percent of Open Interest Shorts: | 35.8 | 30.6 | 30.7 |
| – Net Position: | -17,852 | 23,713 | -5,861 |
| – Gross Longs: | 3,732 | 42,164 | 12,655 |
| – Gross Shorts: | 21,584 | 18,451 | 18,516 |
| – Long to Short Ratio: | 0.2 to 1 | 2.3 to 1 | 0.7 to 1 |
| NET POSITION TREND: | |||
| – Strength Index Score (3 Year Range Pct): | 7.9 | 82.5 | 40.1 |
| – Strength Index Reading (3 Year Range): | Bearish-Extreme | Bullish-Extreme | Bearish |
| NET POSITION MOVEMENT INDEX: | |||
| – 6-Week Change in Strength Index: | -7.8 | -6.2 | 22.3 |
Canadian Dollar Futures:
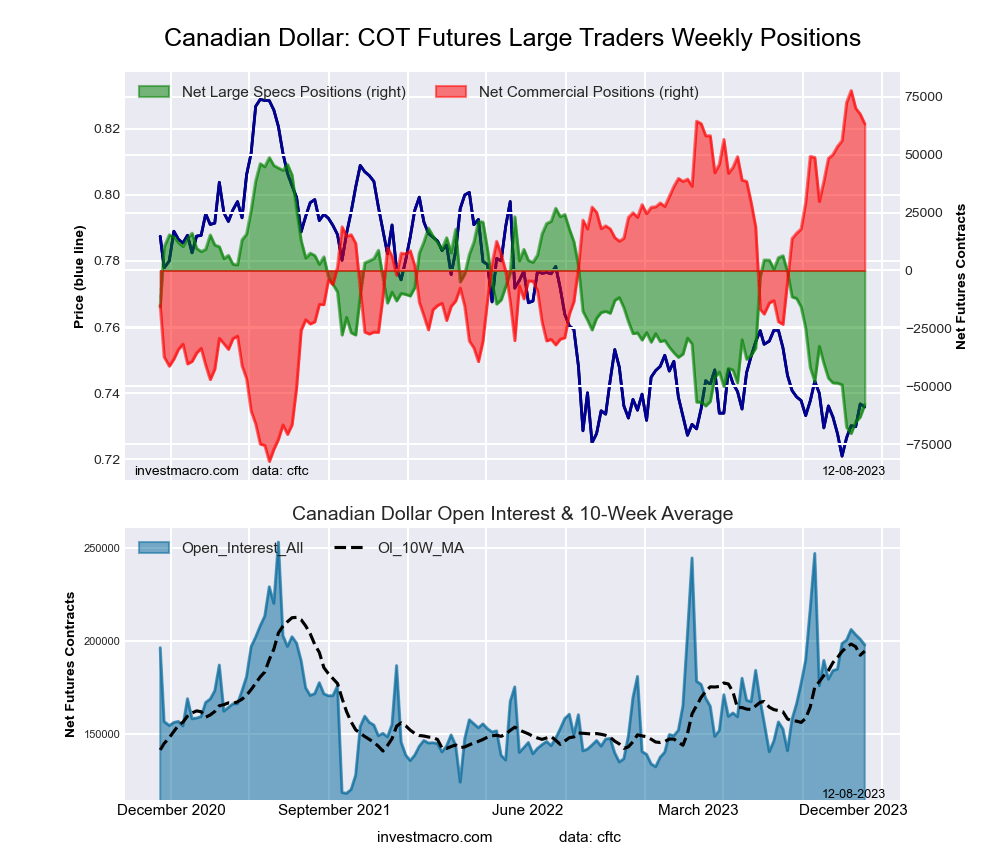 The Canadian Dollar large speculator standing this week totaled a net position of -57,848 contracts in the data reported through Tuesday. This was a weekly boost of 5,394 contracts from the previous week which had a total of -63,242 net contracts.
This week’s current strength score (the trader positioning range over the past three years, measured from 0 to 100) shows the speculators are currently Bearish-Extreme with a score of 10.5 percent. The commercials are Bullish-Extreme with a score of 91.0 percent and the small traders (not shown in chart) are Bearish-Extreme with a score of 10.7 percent.
Price Trend-Following Model: Weak Downtrend (Possible Trend Change)
Our weekly trend-following model classifies the current market price position as: Weak Downtrend. The current action for the model is considered to be: Hold – Maintain Short Position.
| CANADIAN DOLLAR Statistics | SPECULATORS | COMMERCIALS | SMALL TRADERS |
| – Percent of Open Interest Longs: | 10.0 | 71.4 | 14.7 |
| – Percent of Open Interest Shorts: | 39.2 | 39.4 | 17.4 |
| – Net Position: | -57,848 | 63,290 | -5,442 |
| – Gross Longs: | 19,753 | 141,259 | 29,036 |
| – Gross Shorts: | 77,601 | 77,969 | 34,478 |
| – Long to Short Ratio: | 0.3 to 1 | 1.8 to 1 | 0.8 to 1 |
| NET POSITION TREND: | |||
| – Strength Index Score (3 Year Range Pct): | 10.5 | 91.0 | 10.7 |
| – Strength Index Reading (3 Year Range): | Bearish-Extreme | Bullish-Extreme | Bearish-Extreme |
| NET POSITION MOVEMENT INDEX: | |||
| – 6-Week Change in Strength Index: | -7.7 | 6.0 | -1.1 |
Australian Dollar Futures:
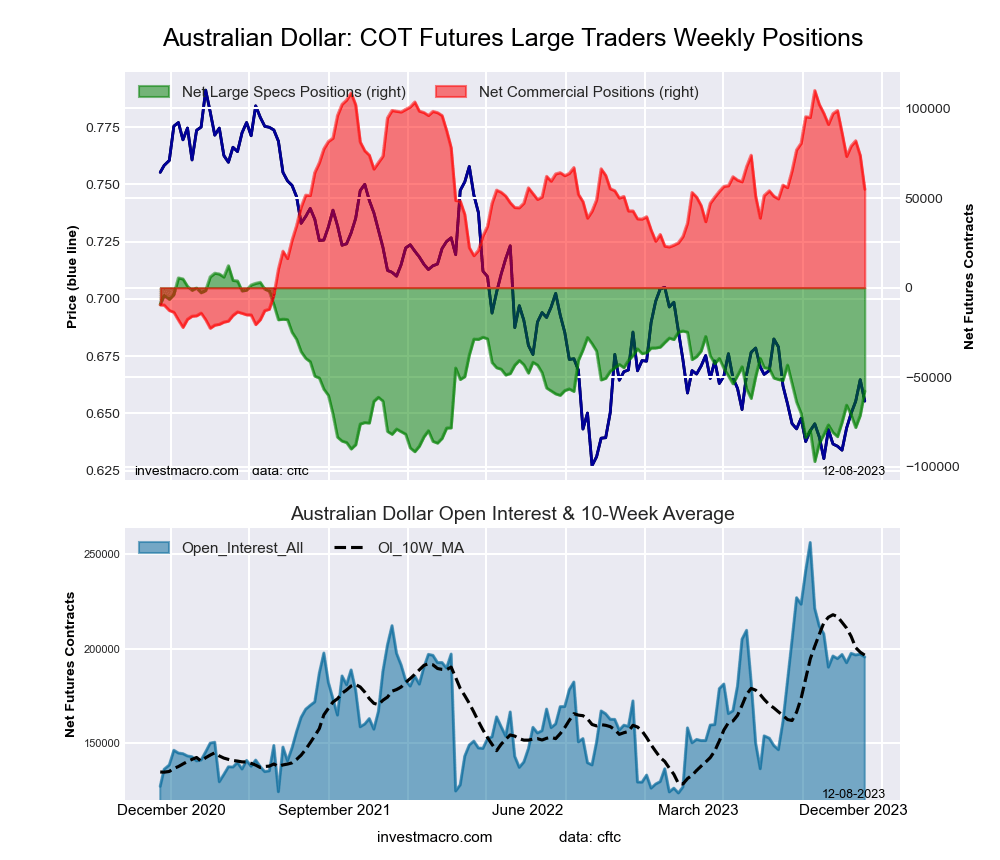 The Australian Dollar large speculator standing this week totaled a net position of -57,681 contracts in the data reported through Tuesday. This was a weekly increase of 13,538 contracts from the previous week which had a total of -71,219 net contracts.
This week’s current strength score (the trader positioning range over the past three years, measured from 0 to 100) shows the speculators are currently Bearish with a score of 36.0 percent. The commercials are Bullish with a score of 58.4 percent and the small traders (not shown in chart) are Bullish with a score of 59.2 percent.
Price Trend-Following Model: Weak Downtrend (Possible Trend Change)
Our weekly trend-following model classifies the current market price position as: Weak Downtrend. The current action for the model is considered to be: Hold – Maintain Short Position.
| AUSTRALIAN DOLLAR Statistics | SPECULATORS | COMMERCIALS | SMALL TRADERS |
| – Percent of Open Interest Longs: | 16.8 | 63.6 | 13.6 |
| – Percent of Open Interest Shorts: | 46.3 | 35.5 | 12.2 |
| – Net Position: | -57,681 | 54,899 | 2,782 |
| – Gross Longs: | 32,886 | 124,388 | 26,639 |
| – Gross Shorts: | 90,567 | 69,489 | 23,857 |
| – Long to Short Ratio: | 0.4 to 1 | 1.8 to 1 | 1.1 to 1 |
| NET POSITION TREND: | |||
| – Strength Index Score (3 Year Range Pct): | 36.0 | 58.4 | 59.2 |
| – Strength Index Reading (3 Year Range): | Bearish | Bullish | Bullish |
| NET POSITION MOVEMENT INDEX: | |||
| – 6-Week Change in Strength Index: | 23.3 | -33.1 | 45.2 |
New Zealand Dollar Futures:
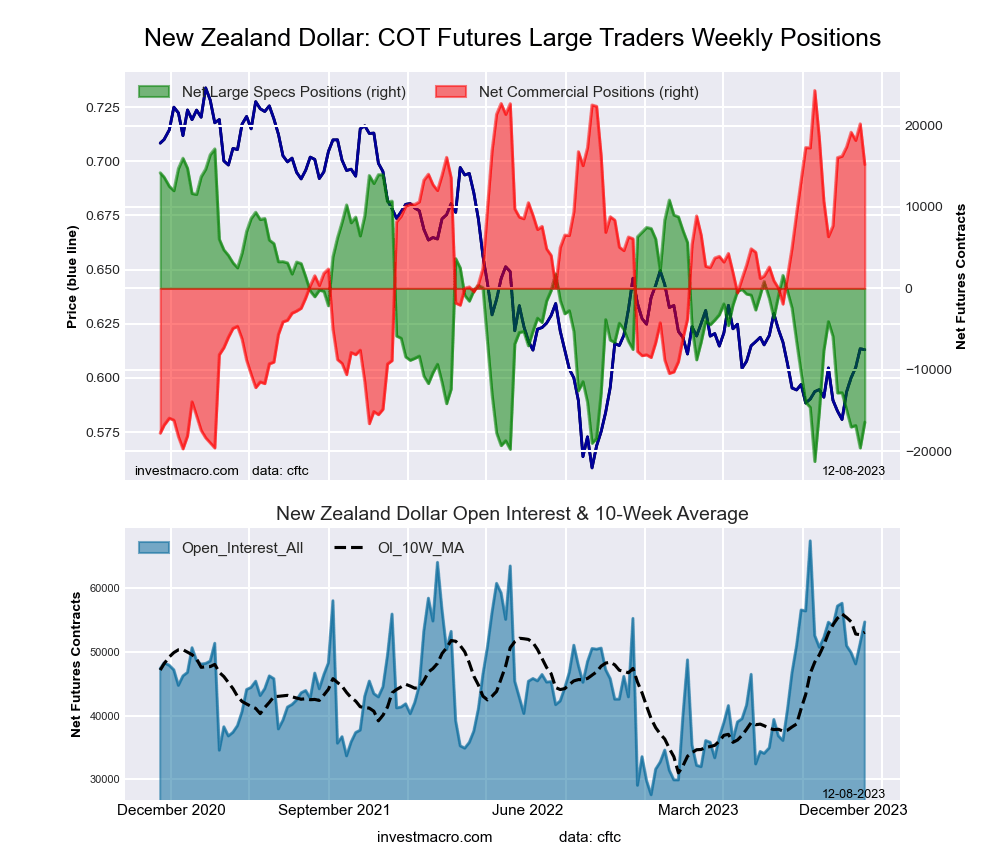 The New Zealand Dollar large speculator standing this week totaled a net position of -16,450 contracts in the data reported through Tuesday. This was a weekly advance of 3,159 contracts from the previous week which had a total of -19,609 net contracts.
This week’s current strength score (the trader positioning range over the past three years, measured from 0 to 100) shows the speculators are currently Bearish-Extreme with a score of 12.6 percent. The commercials are Bullish with a score of 79.4 percent and the small traders (not shown in chart) are Bullish with a score of 64.7 percent.
Price Trend-Following Model: Weak Downtrend (Possible Trend Change)
Our weekly trend-following model classifies the current market price position as: Weak Downtrend. The current action for the model is considered to be: Hold – Maintain Short Position.
| NEW ZEALAND DOLLAR Statistics | SPECULATORS | COMMERCIALS | SMALL TRADERS |
| – Percent of Open Interest Longs: | 21.6 | 66.4 | 9.0 |
| – Percent of Open Interest Shorts: | 51.6 | 38.6 | 6.7 |
| – Net Position: | -16,450 | 15,215 | 1,235 |
| – Gross Longs: | 11,796 | 36,358 | 4,902 |
| – Gross Shorts: | 28,246 | 21,143 | 3,667 |
| – Long to Short Ratio: | 0.4 to 1 | 1.7 to 1 | 1.3 to 1 |
| NET POSITION TREND: | |||
| – Strength Index Score (3 Year Range Pct): | 12.6 | 79.4 | 64.7 |
| – Strength Index Reading (3 Year Range): | Bearish-Extreme | Bullish | Bullish |
| NET POSITION MOVEMENT INDEX: | |||
| – 6-Week Change in Strength Index: | -9.4 | -1.9 | 52.7 |
Mexican Peso Futures:
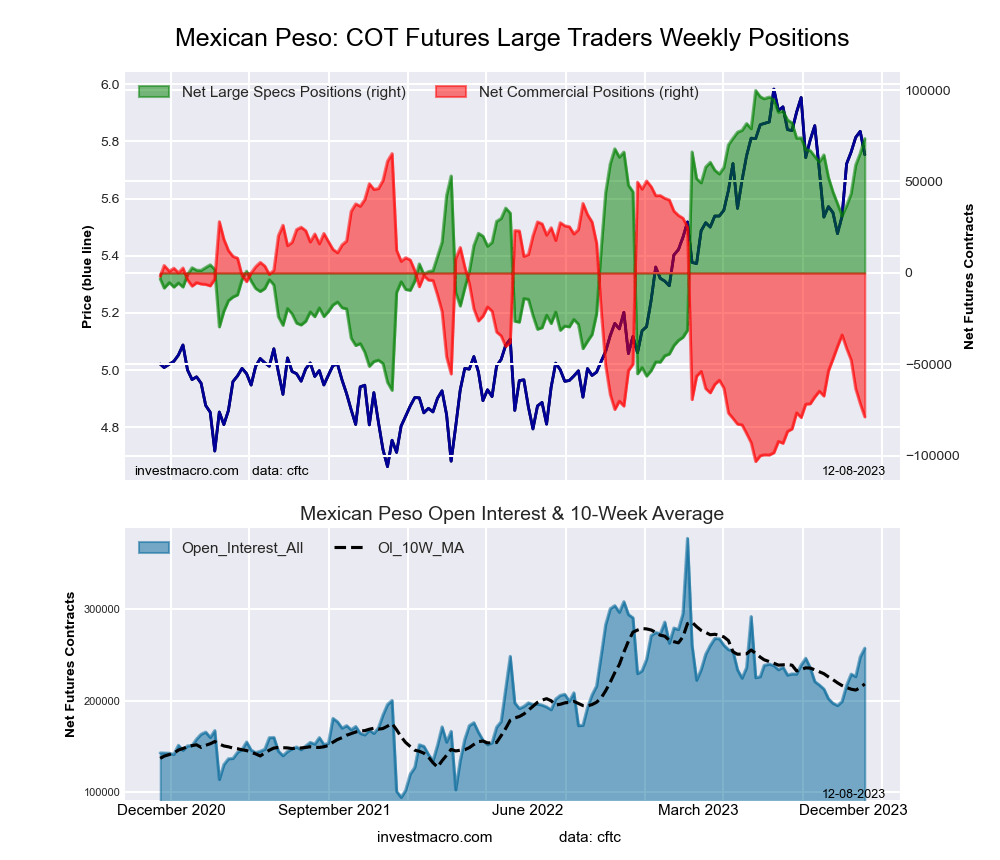 The Mexican Peso large speculator standing this week totaled a net position of 73,456 contracts in the data reported through Tuesday. This was a weekly increase of 7,971 contracts from the previous week which had a total of 65,485 net contracts.
This week’s current strength score (the trader positioning range over the past three years, measured from 0 to 100) shows the speculators are currently Bullish-Extreme with a score of 84.0 percent. The commercials are Bearish-Extreme with a score of 14.5 percent and the small traders (not shown in chart) are Bearish with a score of 44.2 percent.
Price Trend-Following Model: Downtrend
Our weekly trend-following model classifies the current market price position as: Downtrend. The current action for the model is considered to be: Hold – Maintain Short Position.
| MEXICAN PESO Statistics | SPECULATORS | COMMERCIALS | SMALL TRADERS |
| – Percent of Open Interest Longs: | 42.4 | 51.8 | 2.7 |
| – Percent of Open Interest Shorts: | 13.8 | 82.4 | 0.7 |
| – Net Position: | 73,456 | -78,636 | 5,180 |
| – Gross Longs: | 108,921 | 133,063 | 6,872 |
| – Gross Shorts: | 35,465 | 211,699 | 1,692 |
| – Long to Short Ratio: | 3.1 to 1 | 0.6 to 1 | 4.1 to 1 |
| NET POSITION TREND: | |||
| – Strength Index Score (3 Year Range Pct): | 84.0 | 14.5 | 44.2 |
| – Strength Index Reading (3 Year Range): | Bullish-Extreme | Bearish-Extreme | Bearish |
| NET POSITION MOVEMENT INDEX: | |||
| – 6-Week Change in Strength Index: | 21.7 | -22.8 | 18.2 |
Brazilian Real Futures:
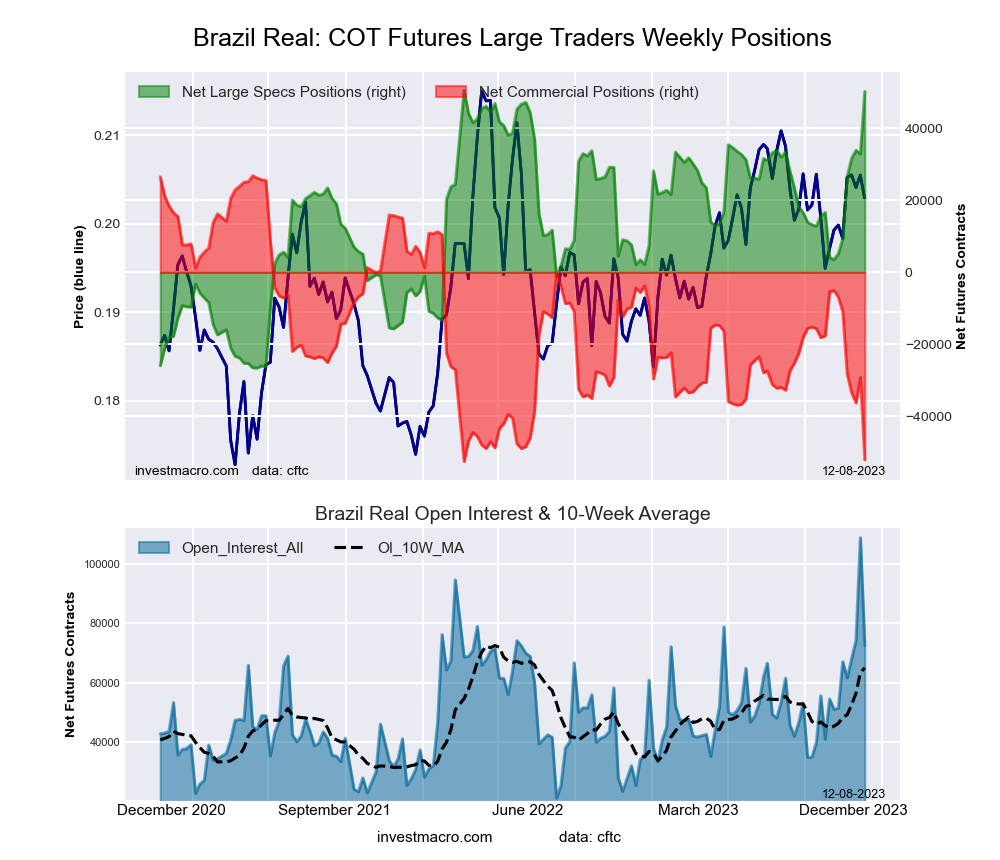 The Brazilian Real large speculator standing this week totaled a net position of 50,244 contracts in the data reported through Tuesday. This was a weekly boost of 17,363 contracts from the previous week which had a total of 32,881 net contracts.
This week’s current strength score (the trader positioning range over the past three years, measured from 0 to 100) shows the speculators are currently Bullish-Extreme with a score of 99.7 percent. The commercials are Bearish-Extreme with a score of 0.6 percent and the small traders (not shown in chart) are Bullish with a score of 51.6 percent.
Price Trend-Following Model: Weak Downtrend (Possible Trend Change)
Our weekly trend-following model classifies the current market price position as: Weak Downtrend. The current action for the model is considered to be: Hold – Maintain Short Position.
| BRAZIL REAL Statistics | SPECULATORS | COMMERCIALS | SMALL TRADERS |
| – Percent of Open Interest Longs: | 74.0 | 21.2 | 4.7 |
| – Percent of Open Interest Shorts: | 4.7 | 93.1 | 2.2 |
| – Net Position: | 50,244 | -52,089 | 1,845 |
| – Gross Longs: | 53,674 | 15,368 | 3,437 |
| – Gross Shorts: | 3,430 | 67,457 | 1,592 |
| – Long to Short Ratio: | 15.6 to 1 | 0.2 to 1 | 2.2 to 1 |
| NET POSITION TREND: | |||
| – Strength Index Score (3 Year Range Pct): | 99.7 | 0.6 | 51.6 |
| – Strength Index Reading (3 Year Range): | Bullish-Extreme | Bearish-Extreme | Bullish |
| NET POSITION MOVEMENT INDEX: | |||
| – 6-Week Change in Strength Index: | 58.5 | -56.9 | 1.2 |
Bitcoin Futures:
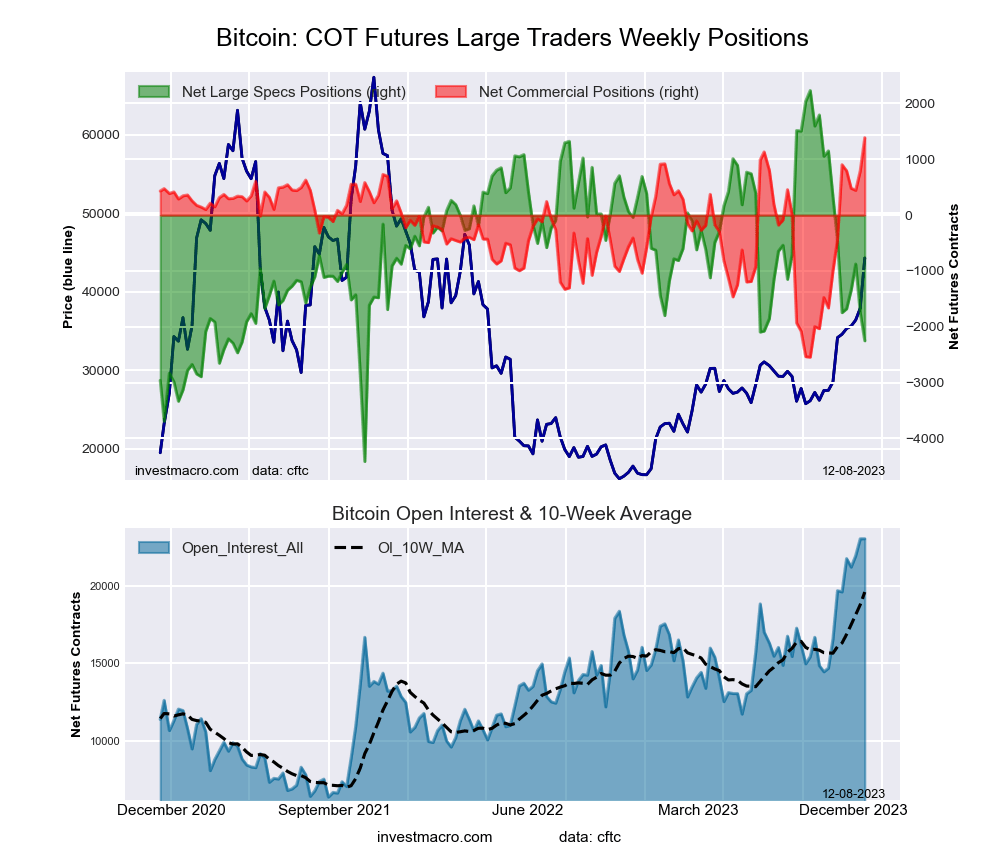 The Bitcoin large speculator standing this week totaled a net position of -2,250 contracts in the data reported through Tuesday. This was a weekly fall of -505 contracts from the previous week which had a total of -1,745 net contracts.
This week’s current strength score (the trader positioning range over the past three years, measured from 0 to 100) shows the speculators are currently Bearish with a score of 32.5 percent. The commercials are Bullish-Extreme with a score of 100.0 percent and the small traders (not shown in chart) are Bearish with a score of 32.6 percent.
Price Trend-Following Model: Strong Uptrend
Our weekly trend-following model classifies the current market price position as: Strong Uptrend. The current action for the model is considered to be: Hold – Maintain Long Position.
| BITCOIN Statistics | SPECULATORS | COMMERCIALS | SMALL TRADERS |
| – Percent of Open Interest Longs: | 77.7 | 8.2 | 7.1 |
| – Percent of Open Interest Shorts: | 87.5 | 2.2 | 3.4 |
| – Net Position: | -2,250 | 1,387 | 863 |
| – Gross Longs: | 17,907 | 1,895 | 1,641 |
| – Gross Shorts: | 20,157 | 508 | 778 |
| – Long to Short Ratio: | 0.9 to 1 | 3.7 to 1 | 2.1 to 1 |
| NET POSITION TREND: | |||
| – Strength Index Score (3 Year Range Pct): | 32.5 | 100.0 | 32.6 |
| – Strength Index Reading (3 Year Range): | Bearish | Bullish-Extreme | Bearish |
| NET POSITION MOVEMENT INDEX: | |||
| – 6-Week Change in Strength Index: | -27.0 | 46.4 | -0.7 |
Article By InvestMacro – Receive our weekly COT Newsletter
*COT Report: The COT data, released weekly to the public each Friday, is updated through the most recent Tuesday (data is 3 days old) and shows a quick view of how large speculators or non-commercials (for-profit traders) were positioned in the futures markets.
The CFTC categorizes trader positions according to commercial hedgers (traders who use futures contracts for hedging as part of the business), non-commercials (large traders who speculate to realize trading profits) and nonreportable traders (usually small traders/speculators) as well as their open interest (contracts open in the market at time of reporting). See CFTC criteria here.

- Geopolitical and macroeconomic conditions continue to pressure market sentiment Jul 20, 2026
- USD/JPY Poised to Continue Gains as Expensive Oil and Lack of Support Weigh on Yen Jul 20, 2026
- COT Metals Charts: Weekly Speculator Bets led by Copper & Steel Jul 18, 2026
- COT Bonds Charts: Weekly Speculator Bets led by 2-Year, SOFR 3M & 5-Year Bonds Jul 18, 2026
- COT Energy Charts: Weekly Speculator Bets led by Brent Oil & Heating Oil Jul 18, 2026
- COT Soft Commodities Charts: Weekly Speculator Bets led by Wheat, Corn & Soybean Meal Jul 18, 2026
- The Bank of Canada kept its interest rate unchanged. Platinum prices reached a three‑week high Jul 16, 2026
- Stock indices rose after the release of US inflation data. China’s GDP slowed sharply Jul 15, 2026
- GBP/USD Awaits Political News: What Will Happen Next Jul 15, 2026
- USD/JPY Holds at Highs: Pressure Lingers on Yen Jul 14, 2026