If finalized, the Proposed Transaction would create a Nasdaq-listed, U.S.-owned and controlled artificial intelligence (AI) infrastructure company, merging low-cost domestic energy with advanced semiconductor packaging and materials to meet the rising demand for AI compute capacity.
JEV said it is strategically positioned at the crossroads of energy and AI, utilizing its robust energy framework and renewable innovations to provide reliable, cost-effective power for AI data centers.
The proposed transaction aims to integrate Smartkem’s patented organic semiconductor platform into Jericho’s infrastructure to accelerate: energy-efficient AI data centers designed for next-generation workloads, advanced AI chip packaging that minimizes power consumption and heat, low-power optical data transmission for faster interconnects, and conformable sensors for environmental monitoring and operational resilience, Jericho noted in the release.
“AI compute growth is driving unprecedented demand for U.S. power and infrastructure,” Jericho Chief Executive Officer Brian Williamson said. “By combining JEV’s scalable energy platform with Smartkem’s semiconductor breakthroughs, we can deliver a new generation of faster, efficient, and more resilient AI data centers.”
Ian Jenks, chairman and CEO of Smartkem, added, “This proposed transaction positions Smartkem’s technology at the center of the largest technology build-out of our era. We believe this combination provides the pathway for our patented materials to reach their full commercial potential inside next-generation AI infrastructure.”
“Together, JEV and Smartkem are developing a unified U.S. platform for AI data centers that pairs energy resilience with advanced semiconductors, a vertically integrated strategy aimed at driving sustainable growth and creating value for shareholders,” said Anthony Amato, strategic advisor to Smartkem.
According to Jericho, some highlights of the proposed transaction include establishing a fully integrated platform covering energy supply and AI data center infrastructure and positioning the combined company to capitalize on the forecasted growth in U.S. power demand for AI data centers.
The combination of JEV’s scalable energy and infrastructure expertise with Smartkem’s patented organic semiconductor materials and OTFT technologies will drive innovation and enhance data center efficiency, JEV said.
The transaction “ensures strategic technology assets are developed, deployed, and scaled under U.S. ownership for global AI infrastructure partners,” the release said.
It also combines two experience management teams “focused on commercializing disruptive innovations at scale.”
Terms of the Proposed Transaction
Under the LOI, the proposed transaction is structured as an all-stock business combination, executed through either a share exchange or statutory merger, Jericho said. In this arrangement, Smartkem would be the surviving legal entity and continue as a publicly listed company on The Nasdaq Stock Market, becoming the “combined company.”
Upon closing, Jericho stockholders would own 65%, while Smartkem stockholders, prior to the transaction, would own 35% of the fully diluted equity securities of the combined company, subject to certain adjustments.
Brian Williamson, currently the CEO of Jericho, would assume the role of CEO for the combined company, according to the release. The board of directors would be reconstituted to include a majority of members designated by Jericho, in compliance with Nasdaq and SEC requirements.
Both companies will require significant additional capital to negotiate the proposed transaction, obtain necessary stockholder approvals, and complete the transaction. Closing is contingent on several conditions, including negotiating a definitive agreement, satisfactory due diligence, board and stockholder approvals, and Nasdaq’s approval for continued listing.
Smartkem and Jericho have agreed to a 60-day exclusivity period to negotiate the terms of a definitive agreement. This period can be terminated by either party under certain conditions, including if Smartkem does not purchase Jericho common shares valued at least US$500,000 by November 30, 2025. While the LOI is active, Smartkem will purchase Jericho common shares from treasury, subject to certain conditions.
The transaction terms outlined in the LOI are expected to be replaced by a definitive agreement. The final legal structure may be adjusted based on tax, corporate, securities, and accounting considerations.
About Smartkem
Smartkem is revolutionizing electronics with a new class of transistors developed using its proprietary semiconductor materials, Jericho said in the release. Its TRUFLEX® semiconductor polymers enable low-temperature printing processes compatible with existing manufacturing infrastructure, delivering low-cost, high-performance displays. The platform is applicable in various display technologies, including MicroLED, LCD, and AMOLED, as well as advanced computer and AI chip packaging, sensors, and logic.
Smartkem designs and develops its materials at its R&D facility in Manchester, U.K., and offers prototyping services at the Centre for Process Innovation (CPI) in Sedgefield, U.K. It also operates a field application office in Hsinchu, Taiwan, near its collaboration partner, The Industrial Technology Research Institute (ITRI).
Smartkem is developing a commercial-scale production process and Electronic Design Automation (EDA) tools to demonstrate the commercial viability of manufacturing a new generation of displays using its materials.
The company holds an extensive IP portfolio, including 140 granted patents across 17 patent families, 14 pending patents, and 40 codified trade secrets. For more information, visit the Smartkem website or follow them on LinkedIn.
JEV’s Data Center Initiative
Earlier this year, Jericho launched its data center initiative, strategically leveraging its expansive 41,000-acre portfolio of active oil and gas joint venture properties in Oklahoma. By harnessing abundant, low-cost on-site natural gas, JEV is transforming its energy assets into secure, scalable, high-performance AI computing hubs tailored for the AI era.
JEV’s build-to-suit (BTS) data centers capitalize on the company’s extensive network of over 60 miles of gas, power, and water infrastructure, along with prime positioning on a U.S. fiber “superhighway,” to offer unparalleled connectivity and performance.
In July, Jericho announced a memorandum of understanding (MOU) with M2 Development Solutions LLC to accelerate the development of AI data centers across the United States. Finalized on July 6, the agreement expands Jericho’s reach beyond its Oklahoma asset base into Ohio and Nevada, utilizing M2’s large-scale development sites.
The Ohio location spans 400 acres and includes access to utility power and on-site natural gas power generation assets. In Nevada, the 3,700-acre site offers a diverse energy mix, including utility power access, on-site geothermal and solar capabilities, and natural gas-fed power generation. These features provide energy diversification options at a scale suitable for AI data center operations, which demand substantial and reliable power sources.
“Our partnership with M2 is a transformative step in executing our AI data center strategy,” said Williamson at the time. “Integrating M2’s gigawatt-scale sites accelerates our ability to deliver scalable, energy-efficient infrastructure for modern AI workloads.”
The Catalyst: We’re Consuming More Electricity Than Ever
In a significant shift from nearly two decades of stagnant U.S. load growth, Americans are now consuming more electricity than ever, according to a report by ICF International. The rapid expansion of data centers to support AI technology, along with a surge in new manufacturing and oil and gas production, is driving a notable increase in industrial electricity demand.
Additionally, electric vehicles, heat pumps, and other energy-intensive products are further contributing to this growth. ICF’s analysis suggests that U.S. electricity demand is expected to rise by 25% by 2030 and by 78% by 2050, compared to 2023 levels. This surge in demand has significant implications for the reliability and affordability of electricity. For residential customers, electricity rates could increase by 15% to 40% by 2030, depending on the market. By 2050, some rates might even double.
In a piece for U.S. Global Investors dated July 25, Frank Holmes compared the current AI advancements to the scale and ambition of the defense expansion during the Reagan era or the shale boom of the 2010s.
According to Grand View Research, the global data center market size was estimated at US$347.6 billion in 2024 and is projected to reach US$652.01 billion by 2030, growing at a compound annual growth rate (CAGR) of 11.2% from 2025 to 2030. “The rapid adoption of digital transformation initiatives, cloud computing, and emerging technologies such as artificial intelligence (AI), machine learning (ML), and the Internet of Things (IoT) have substantially increased demand,” Holmes noted.
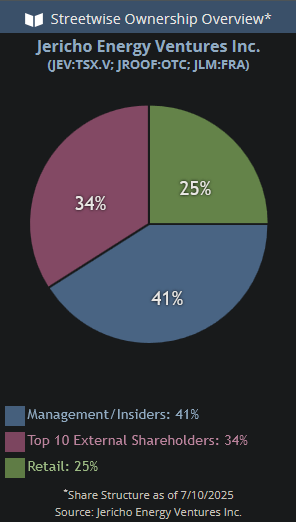
Ownership and Share Structure
Around 41% of Jericho’s shares are held by management and insiders, the company said. They include CEO Brian Williamson, who owns 1.38%; founder Allen Wilson, who owns 0.99%; and board member Nicholas Baxter, who owns 0.49%; according to Refinitiv’s latest research.
Around 34% of shares are held by the company’s “Top 10 external shareholders.” The rest is in retail.
JEV’s market cap is CA$35.07 million, and it trades in a 52-week range of CA$0.08 and CA$0.21. It has 304.03 million shares outstanding, about 220.98 million floating.
Important Disclosures:
- As of the date of this article, officers and/or employees of Streetwise Reports LLC (including members of their household) own securities of Jericho Energy Ventures Inc.
- Steve Sobek wrote this article for Streetwise Reports LLC and provides services to Streetwise Reports as an employee.
- This article does not constitute investment advice and is not a solicitation for any investment. Streetwise Reports does not render general or specific investment advice and the information on Streetwise Reports should not be considered a recommendation to buy or sell any security. Each reader is encouraged to consult with his or her personal financial adviser and perform their own comprehensive investment research. By opening this page, each reader accepts and agrees to Streetwise Reports’ terms of use and full legal disclaimer. Streetwise Reports does not endorse or recommend the business, products, services or securities of any company.
For additional disclosures, please click here.


 A crowd gathers outside the New York Stock Exchange following the ‘Great Crash’ of October 1929.