Ichimoku Cloud Analysis 22.07.2022 (EURUSD, XAUUSD, NZDUSD)

Article By RoboForex.com

XAUUSD, “Gold vs US Dollar”

As we can see in the H4 chart, XAUUSD has formed a Harami reversal pattern not far from the resistance area. At the moment, the asset may reverse in the form of a new correctional impulse. In this case, the downside correctional target may be the support level at 1650.00. At the same time, the opposite scenario implies that the price may continue growing to reach 1740.00 without any pullbacks.

XAUUSD
Risk Warning: the result of previous trading operations do not guarantee the same results in the future

NZDUSD, “New Zealand vs US Dollar”

As we can see in the H4 chart, NZDUSD has formed a Hammer reversal pattern close to the support area. At the moment, the asset may reverse in the form of another ascending impulse. In this case, the upside target may be at 0.6290. After that, the asset may break the resistance level and continue moving upwards. However, an alternative scenario implies that the price may fall to reach 0.6190 before resuming its growth towards the resistance level.

NZDUSD
Risk Warning: the result of previous trading operations do not guarantee the same results in the future

GBPUSD, “Great Britain Pound vs US Dollar”

As we can see in the H4 chart, GBPUSD has formed a Harami reversal pattern near the resistance level. At the moment, the pair may reverse in the form of a new descending impulse. In this case, the downside target may be the support area at 1.1845. Later, the market may break this level and continue falling. Still, there might be an alternative scenario, in which the asset may correct to reach the resistance level at 1.2055 first and then resume the descending tendency.

GBPUSD

Article By RoboForex.com

Attention!
Forecasts presented in this section only reflect the author’s private opinion and should not be considered as guidance for trading. RoboForex LP bears no responsibility for trading results based on trading recommendations described in these analytical reviews.

Japanese Candlesticks Analysis 22.07.2022 (XAUUSD, NZDUSD, GBPUSD)

Article By RoboForex.com

XAUUSD, “Gold vs US Dollar”

As we can see in the H4 chart, XAUUSD has formed a Harami reversal pattern not far from the resistance area. At the moment, the asset may reverse in the form of a new correctional impulse. In this case, the downside correctional target may be the support level at 1650.00. At the same time, the opposite scenario implies that the price may continue growing to reach 1740.00 without any pullbacks.

XAUUSD
Risk Warning: the result of previous trading operations do not guarantee the same results in the future

NZDUSD, “New Zealand vs US Dollar”

As we can see in the H4 chart, NZDUSD has formed a Hammer reversal pattern close to the support area. At the moment, the asset may reverse in the form of another ascending impulse. In this case, the upside target may be at 0.6290. After that, the asset may break the resistance level and continue moving upwards. However, an alternative scenario implies that the price may fall to reach 0.6190 before resuming its growth towards the resistance level.

NZDUSD
Risk Warning: the result of previous trading operations do not guarantee the same results in the future

GBPUSD, “Great Britain Pound vs US Dollar”

As we can see in the H4 chart, GBPUSD has formed a Harami reversal pattern near the resistance level. At the moment, the pair may reverse in the form of a new descending impulse. In this case, the downside target may be the support area at 1.1845. Later, the market may break this level and continue falling. Still, there might be an alternative scenario, in which the asset may correct to reach the resistance level at 1.2055 first and then resume the descending tendency.

GBPUSD

Article By RoboForex.com

Attention!
Forecasts presented in this section only reflect the author’s private opinion and should not be considered as guidance for trading. RoboForex LP bears no responsibility for trading results based on trading recommendations described in these analytical reviews.

How record-setting heat waves in cities across UK, US and mainland Europe could punish economies already reeling from inflation

By Derek Lemoine, University of Arizona 

Hundreds of millions of people struggled to keep cool amid a sweltering summer heat wave as cities across the U.S. and mainland Europe experienced record-high temperatures. In the U.K., thermometers topped 104 Fahrenheit (40 degrees Celsius) on July 19, 2022, the highest ever recorded.

While all this broiling heat is surely punishing on a personal level, it also has significant impacts on the broader economy.

As an economist who has studied the effects of weather and climate change, I have examined a large body of work that links heat to economic outcomes. Here are four ways extreme heat hurts the economy.

1. Growth takes a hit

Research has found that extreme heat can directly hurt economic growth.

For example, a 2018 study found that the economies of U.S. states tend to grow at a slower pace during relatively hot summers. The data shows that annual economic growth falls 0.15 to 0.25 percentage points for every 1 degree Fahrenheit (0.56 C) that a state’s average summer temperature is above normal.

Laborers in weather-exposed industries such as construction work fewer hours when it’s hotter. But higher summer temperatures also reduce growth in many industries that tend to involve indoor work, including retail, services and finance. Workers are less productive when it’s hotter out.

2. Crop yields drop

Agriculture is obviously exposed to weather: After all, crops grow outdoors.

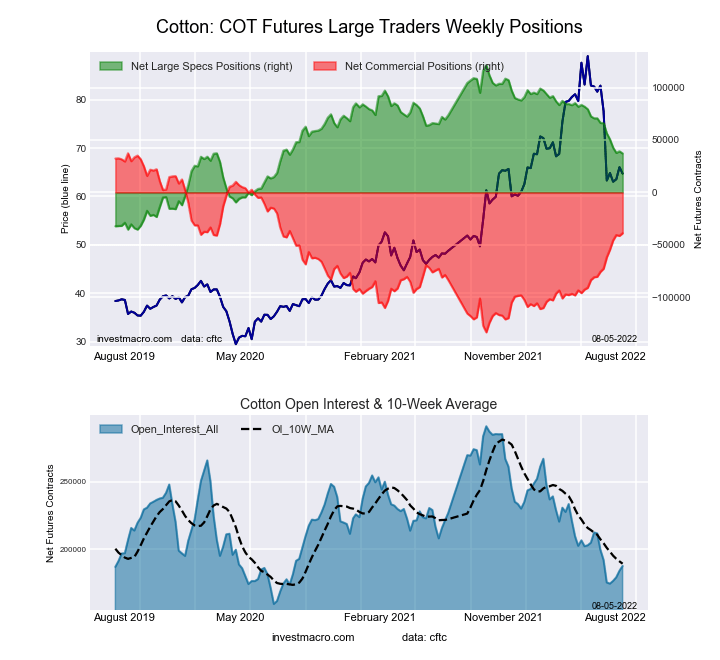
While temperatures up to around 85 F to 90 F (29-32 C) can benefit crop growth, yields fall sharply when thermostats rise further. Some of the crops that can be hit hard by extreme heat include corn, soybeans and cotton. These reductions in yields could be costly for U.S. agriculture.
For example, a recent study I conducted found that an additional 2 degrees C (3.6 F) of global warming would eliminate profits from an average acre of farmland in the eastern U.S.

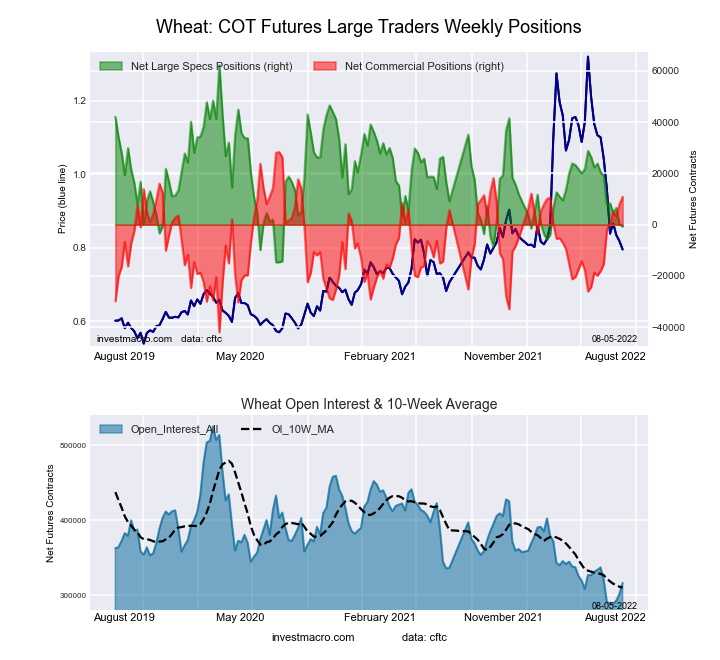
A prominent example of this was the collapse of the Russian wheat harvest in response to the country’s 2010 heat wave, which raised wheat prices throughout the world.

3. Energy use soars

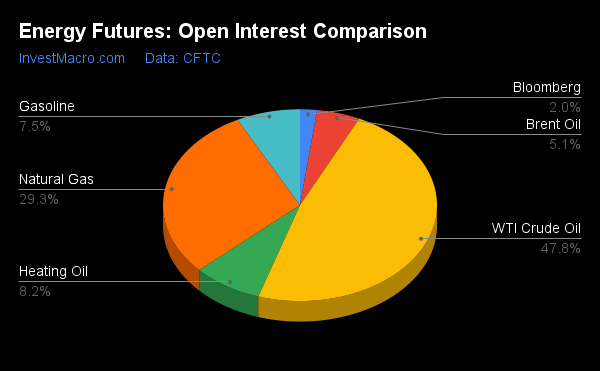
Of course, when it’s hot, energy use goes up as people and businesses run their air conditioners and other cooling equipment at full blast.

A 2011 study found that just one extra day with temperatures above 90 F (32 C) increases annual household energy use by 0.4%. More recent research shows that energy use increases the most in places that tend to be hotter, probably because more households have air conditioning.

This increase in electricity use on hot days stresses electric grids right when people depend on them most, as seen in California and Texas during past heat waves. Blackouts can be quite costly for the economy, as inventories of food and other goods can spoil and many businesses either have to run generators or shut down. For instance, the 2019 California blackouts cost an estimated US$10 billion.

4. Education and earnings suffer

A long-term impact of increasingly hotter weather involves how it affects children’s ability to learn – and thus their future earnings.

Research has shown that hot weather during the school year reduces test scores. Math scores decrease more and more as the temperature rises beyond 70 F (21 C). Reading scores are more resistant to high temperatures, which this research claims is consistent with how different regions of the brain respond to heat.

One study suggested that students in schools that lack air conditioning learn 1% less for every 1 degree Fahrenheit (0.56 C) increase in the school year’s average temperature. It also found that minority students are especially affected by hotter school years, as their schools are more likely to lack air conditioning.
Lost learning results in lower lifetime earnings and hurts future economic growth.

The impact of extreme heat on development, in fact, begins before we’re even born. Research has found that adults who were exposed to extreme heat as fetuses earn less during their lifetimes. Each extra day with average temperature above 90 F (32 C) reduces earnings 30 years later by 0.1%.

Air conditioning can help – to a point

Air conditioning can offset some of these effects.

For example, studies have found that having a working air conditioner means fewer people die, student learning isn’t compromised and extreme heat outside during pregnancy doesn’t hurt fetuses.

Not everyone has air conditioners, however, especially in states such as Oregon and countries such as the U.K. that have more temperate climates but have nonetheless recently experienced unusually extreme temperatures. And many people can’t afford to own or operate them. Survey data from 2017 found that around half of homes in the U.S. Pacific Northwest
lacked air conditioning. And about 42% of U.S. classrooms lack an air conditioner.

While heat waves are shown to induce more households to install air conditioning, it’s hardly a panacea. By 2100, higher use of air conditioning could increase residential energy consumption by 83% globally. If that energy comes from fossil fuels, it could end up amplifying the heat waves that are causing the higher demand in the first place.

And in the U.S. South, where air conditioning is omnipresent, hotter-than-usual summers still take the greatest toll on states’ economic growth.

In other words, as temperatures rise, economies will continue to suffer.

This is an updated version of an article originally published on Aug. 2, 2021.The Conversation

About the Author:

Derek Lemoine, Associate Professor of Economics, University of Arizona

This article is republished from The Conversation under a Creative Commons license. Read the original article.


The Analytical Overview of the Main Currency Pairs on 2022.07.22

By JustForex

The EUR/USD currency pair

Technical indicators of the currency pair:
  • Prev Open: 1.0176
  • Prev Close: 1.0228
  • % chg. over the last day: +0.51%

The European Central Bank unexpectedly raised the interest rate by 0.5%, although Christine Lagarde had indicated that the first increase would be 0.25%. The ECB report indicates that the decision is based on an updated assessment of inflation risks, as rising prices are a growing concern for households and companies. The future trajectory of interest rates will depend on new inflation data. ECB policymakers also agreed to provide additional assistance to the currency bloc’s 19 heavily indebted countries, including Italy, with a new bond-buying scheme designed to limit their rising borrowing costs and thus limit financial fragmentation. Against this news, the euro strengthened significantly.

Trading recommendations
  • Support levels: 1.0188, 1.0154, 1.0106, 1.0035, 1.0000
  • Resistance levels: 1.0284, 1.0365, 1.0415, 1.050

From the technical point of view, the trend on the EUR/USD currency pair on the hourly time frame is bullish. The price is forming a wide balance, and the MACD indicator has become inactive, but the buyer’s pressure remains. Under such market conditions, it is best to look for buy trades on intraday time frames from the support level of 1.0188 or 1.0106, but only with confirmation. Sell trades can be considered from the resistance level of 1.0284, but only after additional confirmation and only with short targets.

Alternative scenario: if the price breaks down through the 1.0000 support level and fixes below, the downtrend will likely resume.

EUR/USD
News feed for 2022.07.22:
  • – Eurozone France Manufacturing PMI (m/m) at 10:15 (GMT+3);
  • – Eurozone France Services PMI (m/m) at 10:15 (GMT+3);
  • – Eurozone German Manufacturing PMI (m/m) at 10:30 (GMT+3);
  • – Eurozone German Services PMI (m/m) at 10:30 (GMT+3);
  • – Eurozone Manufacturing PMI (m/m) at 11:00 (GMT+3);
  • – Eurozone Services PMI (m/m) at 11:00 (GMT+3);
  • – US Manufacturing PMI (m/m) at 16:45 (GMT+3);
  • – US Services PMI (m/m) at 16:45 (GMT+3).

The GBP/USD currency pair

Technical indicators of the currency pair:
  • Prev Open: 1.1974
  • Prev Close: 1.1999
  • % chg. over the last day: -0.21%

In the UK, investors are watching the race for Prime Minister’s seat. Former Treasury Secretary Rishi Sunak and Foreign Secretary Liz Truss made it to the last round of the contest to become party leaders. A number of reports will also be released today. Traders expect a slowdown in the UK Manufacturing PMI for June and a decline in retail sales. If the data is worse than forecast, the British pound may react with a decline.

Trading recommendations
  • Support levels: 1.1955, 1.1907, 1.1803
  • Resistance levels: 1.2065, 1.2137

From the technical point of view, the trend on the GBP/USD currency pair on the hour time is bullish. The price has slightly corrected and is trading at the level of the moving averages. The MACD indicator has become inactive. Under such market conditions, it is best to look for buy trades on intraday time frames from the support level of 1.1955 or 1.1907, but only with confirmation. Sell trades can be considered intraday from the resistance level of 1.2065, but only after additional confirmation and with short targets.

Alternative scenario: if the price breaks down through the 1.1803 support level and fixes below, the downtrend will likely resume.

GBP/USD
News feed for 2022.07.22:
  • – UK Retail Sales (m/m) at 09:00 (GMT+3);
  • – UK Manufacturing PMI (m/m) at 11:30 (GMT+3);
  • – UK Services PMI (m/m) at 11:30 (GMT+3).

The USD/JPY currency pair

Technical indicators of the currency pair:
  • Prev Open: 138.13
  • Prev Close: 137.34
  • % chg. over the last day: -0.57%

Japan’s key inflation indicator has further exceeded the Bank of Japan’s target of 2%. According to data released Friday by the Ministry of Internal Affairs, core consumer prices (excluding food and fuel prices) reached an annualized rate of 2.2%. The result was in line with economists’ estimates. Despite the continued rise in prices, the Bank of Japan is unlikely to budge anytime soon, as the Bank of Japan remains unconvinced that inflation in the country is sustainable. Bank of Japan Governor Kuroda has repeatedly said that current cost inflation is unsustainable and that the central bank needs constant easing until it is demand-driven and accompanied by sustained wage growth. But wage growth has not kept pace with inflation, with May data showing that real wages are down 1.8% from a year ago.

Trading recommendations
  • Support levels: 137.11, 136.48, 135.92, 135.40, 134.64, 134.11
  • Resistance levels: 138.25, 138.56, 140.29

From the technical point of view, the medium-term trend on the USD/JPY currency pair is bullish. But the price has corrected to the priority change level and traded below the moving averages, indicating temporary sellers pressure. Under such market conditions, buy trades can be sought intraday from the support level of 137.11, but with confirmation. For sell deals, traders can consider the resistance level of 138.25, but only with additional confirmation and short targets.

Alternative scenario: If the price fixes below 137.11, the downtrend will likely resume.

USD/JPY
News feed for 2022.07.22:
  • – Japan National Core Consumer Price Index at 02:30 (GMT+3).

The USD/CAD currency pair

Technical indicators of the currency pair:
  • Prev Open: 1.2879
  • Prev Close: 1.2864
  • % chg. over the last day: -0.11%

The Canadian dollar is a commodity currency and is highly dependent on instruments such as the dollar index and oil. Both the US Dollar Index and oil quotes decreased yesterday. As a result, the USD/CAD currency pair traded in a volatile corridor. Volatility in the market increased due to a sharp increase in the ECB rate, which led to a sharp rise in the euro and a decline in the dollar index. Today the retail sales report will be published in Canada. Analysts are predicting an increase in value. If the actual value is better than the forecast, the Canadian dollar may strengthen even more (USD/CAD decline).

Trading recommendations
  • Support levels: 1.2853, 1.2781
  • Resistance levels: 1.2934, 1.3006, 1.3085, 1.3154

In terms of technical analysis, the trend on the USD/CAD currency pair is bearish. The price is forming a balance and trades at the levels of the moving average lines. The MACD indicator has become inactive. Under such market conditions, it is best to consider sell deals from the resistance level of 1.2934, but with confirmation. Buy trades should be viewed on the lower time frames from the support level 1.2853, but only with confirmation and short targets.

Alternative scenario: if the price breaks out and consolidates above the 1.3085 resistance level, the uptrend will likely resume.

USD/CAD
News feed for 2022.07.22:
  • – Canada Retail Sales (m/m) at 15:30 (GMT+3).

By JustForex


This article reflects a personal opinion and should not be interpreted as an investment advice, and/or offer, and/or a persistent request for carrying out financial transactions, and/or a guarantee, and/or a forecast of future events.

Week Ahead: Lower dollar if Fed surprises with “smaller” 50bps hike

By ForexTime

Are you ready for yet another jumbo-sized Fed rate hike?

Markets have been preparing for such an outcome at the upcoming FOMC policy decision, which will star in next week’s economic calendar

Monday, July 25

  • EUR: Germany July IFO business climate
  • GBP: UK PM candidates’ debate – Rishi Sunak vs. Liz Truss

Tuesday, July 26

  • JPY: Bank of Japan June meeting minutes
  • USD: US July consumer confidence
  • IMF releases updated world economic outlook
  • Alphabet 2Q earnings

Wednesday, July 27

  • AUD: Australia Q2 CPI
  • CNH: China June industrial profits
  • USD: Fed rate decision
  • US crude: EIA weekly oil inventory report
  • Meta Platforms 2Q earnings

Thursday, July 28

  • AUD: Australia June retail sales
  • EUR: Germany July CPI, Eurozone July economic and consumer confidence
  • USD: US Q2 GDP, weekly jobless claims
  • Amazon 2Q earnings
  • Apple 2Q earnings

Friday, July 29

  • JPY: Japan June unemployment, retail sales, industrial production; July Tokyo CPI
  • EUR: Eurozone July CPI, Q2 GDP
  • USD: US June personal income and spending, PCE core deflator, July consumer sentiment
  • Exxon 2Q earnings
  • Chevron 2Q earnings


Markets have fully priced in a second consecutive 75-basis point hike at next week’s FOMC policy meeting, as the US central bank continues its battle against the hottest inflation in 40 years.

However, that 75bps hike is a relative step down from the 100-basis point hike that some segments of the markets were expecting. Hence the recent unwinding of gains in the equally-weighted USD index. Still, this instrument is well within its uptrend since Q1 2022.

Note that this index compares the US dollar’s performance against six of its major peers, all in equal weights:

  • Euro
  • British Pound
  • Swiss Franc
  • Australian Dollar
  • New Zealand Dollar
  • Canadian Dollar


Any other outcome that deviates from the 75bps script would be a surprise.

  • DOVISH: A “mere” 50bps hike, though still twice the size of the traditional 25bps rate adjustments per meeting deployed by central bankers worldwide, should prompt more declines in the USD index, potentially moving it closer to its 50-day simple moving average (SMA) around the 1.175 region.
  • HAWKISH: Although the bar has been set high for a hawkish outcome at next week’s meeting, a 100bps shocker would reinvigorate dollar bulls into sending this USD index back above the 1.20 line. More dollar gains may also ensue if Fed Chair Jerome Powell, during his press conference, refuses to rule out a 100bps hike at upcoming meetings.


Ultimately, policymakers at the US central bank, as well as market participants, will continue to be guided by the inflation data.

And on that point, after the FOMC meeting concludes, next Friday’s release of the June PCE deflator will be closely watched, considering that it’s the Fed’s preferred way of measuring inflation.

The PCE deflator is forecasted to come in at 6.6% in June, which would mean that it has posted a reading of 6% or higher for every month so far this year. 6.6% is also more than three times the Fed’s 2% target, underscoring the tremendous task that the Fed is up against.

Further evidence of stubbornly elevated price pressures is set to force the Fed into triggering even more jumbo-sized rate hikes over the coming months. Such hawkish expectations could then see the USD index being restored to the last cycle high at 1.21859, or perhaps even higher.

Overall, as long as the Fed keeps the “pedal to the metal” while leaving other major central banks struggling to catch up with their own rate hikes, that should leave the buck with an easier path to climb even higher.


Forex-Time-LogoArticle by ForexTime

ForexTime Ltd (FXTM) is an award winning international online forex broker regulated by CySEC 185/12 www.forextime.com

The European Central Bank surprised the markets. Political crisis in Italy

By JustForex

The US stock indices increased yesterday on the technology sector’s growth, as better-than-expected Tesla earnings supported the sector. The Dow Jones (US30) added 0.51% at the close, while the S&P 500 (US500) increased by 0.99%. The Technology Index NASDAQ (US100) jumped by 1.36%.

Shares of Tesla Inc (TSLA) jumped by 9.7% yesterday, giving confidence to the entire industry and the sector. Shares of Snap Inc (SNAP) fell by 24% in over-the-counter trading Thursday as the company said third-quarter revenue growth was flat and its results were affected by Apple’s privacy changes. Shares of American Airlines (AAL) fell by 7% on the report, even as the company projected third-quarter earnings thanks to increased demand for travel services.

Biden tested positive for coronavirus. The US president has moderate symptoms and is working remotely.

Stock markets in Europe traded flat Thursday. German DAX (DE30) decreased by 0.27% yesterday, French CAC 40 (FR40) added 0.27%, Spanish IBEX 35 (ES35) lost 0.20%, British FTSE 100 (UK100) was up by 0.09%.

The European Central Bank unexpectedly raised its interest rate by 0.5%, even though Christine Lagarde had promised the first increase of 0.25%. The ECB report indicates that the decision is based on an updated assessment of inflation risks, as rising prices are a growing concern for households and companies. The future trajectory of interest rates will depend on the new data. ECB policymakers also agreed to provide additional assistance to the currency bloc’s 19 heavily indebted countries, including Italy, with a new bond-buying scheme designed to limit their rising borrowing costs and thus limit financial fragmentation.

Investors are also closely watching the political situation in Italy, as Prime Minister Mario Draghi resigned on Thursday, and the president accepted his resignation, followed by the dissolution of parliament.

The Nord Stream 1 pipeline reopened after a 10-day hiatus. Germany’s grid regulator has indicated that they are back to a capacity level of 40%. With the resumption of gas flows through Nord Stream, investors are more conciliatory on the part of Russia to continue supplying oil and petroleum products to Europe in the coming weeks or months.

Oil prices have fallen below $100 after a massive inventory build-up in the United States. But demand remains strong in mid-summer, so with production levels lagging, traders should not expect a significant drop in prices.

Asian markets mostly rose yesterday. Japan’s Nikkei 225 (JP225) gained 2.67%, Hong Kong’s Hang Seng (HK50) added 1.11%, and Australia’s S&P/ASX 200 (AU200) closed by 1.65% higher.

Japan’s key inflation indicator was even higher than the Bank of Japan’s target of 2%. According to data released on Friday by the Ministry of the Interior, core consumer prices (excluding food and fuel prices) reached an annualized rate of 2.2%. The result was in line with economists’ estimates. Despite the continued rise in prices, the Bank of Japan is unlikely to budge anytime soon, as the Bank of Japan remains unconvinced that inflation in the country is sustainable. The BoJ Governor Kuroda has repeatedly said that current cost inflation is unsustainable and that the central bank needs constant easing until it is demand-driven and accompanied by sustained wage growth. But wage growth has not kept pace with inflation, with May data showing that real wages are down 1.8% from a year ago.

In Australia, a NAB report showed that the RBA would raise rates to 2.85% by the end of the year. Since the monetary rate is still well below “neutral,” this indicates continued rapid normalization in the coming months. This means a 50 bp interest rate hike at each of the next two meetings and then a pause to assess the impact of the rate hike.

S&P 500 (F) (US500) 3,998.95 +39.05 (+0.99%)

Dow Jones (US30) 32,036.90 +162.06 (+0.51%)

DAX (DE40) 13,246.64 −35.34 (−0.27%)

FTSE 100 (UK100) 7,270.51 +6.20 (+0.085%)

USD Index 106.77 −0.31 (−0.29%)

Important events for today:
  • – Australia Manufacturing PMI (m/m) at 02:00 (GMT+3);
  • – Japan National Core Consumer Price Index at 02:30 (GMT+3);
  • – UK Retail Sales (m/m) at 09:00 (GMT+3);
  • – Eurozone France Manufacturing PMI (m/m) at 10:15 (GMT+3);
  • – Eurozone France Services PMI (m/m) at 10:15 (GMT+3);
  • – Eurozone German Manufacturing PMI (m/m) at 10:30 (GMT+3);
  • – Eurozone German Services PMI (m/m) at 10:30 (GMT+3);
  • – Eurozone Manufacturing PMI (m/m) at 11:00 (GMT+3);
  • – Eurozone Services PMI (m/m) at 11:00 (GMT+3);
  • – UK Manufacturing PMI (m/m) at 11:30 (GMT+3);
  • – UK Services PMI (m/m) at 11:30 (GMT+3);
  • – Canada Retail Sales (m/m) at 15:30 (GMT+3);
  • – US Manufacturing PMI (m/m) at 16:45 (GMT+3);
  • – US Services PMI (m/m) at 16:45 (GMT+3).

By JustForex


This article reflects a personal opinion and should not be interpreted as an investment advice, and/or offer, and/or a persistent request for carrying out financial transactions, and/or a guarantee, and/or a forecast of future events.

From in-crowds to power couples, network science uncovers the hidden structure of community dynamics

By Mayank Kejriwal, University of Southern California 

– The world is a networked place, literally and figuratively. The field of network science is used today to understand phenomena as diverse as the spread of misinformation, West African trade and protein-protein interactions in cells.

Network science has uncovered several universal properties of complex social networks, which in turn has made it possible to learn details of particular networks. For example, the network consisting of the international financial corruption scheme uncovered by the Panama Papers investigation has an unusual lack of connections among its parts.

But understanding the hidden structures of key elements of social networks, such as subgroups, has remained elusive. My colleagues and I have found two complex patterns in these networks that can help researchers better understand the hierarchies and dynamics of these elements. We found a way to detect powerful “inner circles” in large organizations simply by studying networks that map emails being sent among employees.

We demonstrated the utility of our methods by applying them to the famous Enron network. Enron was an energy trading company that perpetrated fraud on a massive scale. Our study further showed that the method can potentially be used to detect people who wield enormous soft power in an organization regardless of their official title or position. This could be useful for historical, sociological and economic research, as well as government, legal and media investigations.

From pencil and paper to artificial intelligence

Sociologists have been constructing and studying smaller social networks in careful field experiments for at least 80 years, well before the advent of the internet and online social networks. The concept is so simple that it can be drawn on paper: Entities of interest – people, businesses, countries – are nodes represented as points, and relationships between pairs of nodes are links represented as lines drawn between the points.

Two sets of dots with lines connecting some of the dots
An abstract network, at left, shows lines between points representing relationships. The network on the right shows a small fragment of a real-world network of West African traders, based on data from Oliver J. Walther. https://doi.org/10.1080/00220388.2015.1010152.
Mayank Kejriwal, CC BY-ND

Using network science to study human societies and other complex systems took on new meaning in the late 1990s when researchers discovered some universal properties of networks. Some of these universal properties have since entered mainstream pop culture. One concept is the Six Degrees of Kevin Bacon, based on the famous empirical finding that any two people on Earth are six or fewer links apart. Similarly, versions of statements such as “the rich get richer” and “winner takes all” have also been replicated in some networks.

These global properties, meaning ones applying to the entire network, seemingly emerge from the myopic and local actions of independent nodes. When I connect with someone on LinkedIn, I am certainly not thinking of the global consequences of my connection on the LinkedIn network. Yet my actions, along with those of many others, eventually lead to predictable, rather than random, outcomes about how the network will evolve.

My colleagues and I have used network science to study human trafficking in the U.K., the structure of noise in artificial intelligence systems’ outputs, and financial corruption in the Panama Papers.

Groups have their own structure

Along with studying emergent properties like the Six Degrees of Kevin Bacon, researchers have also used network science to focus on problems such as community detection. Stated simply, can a set of rules, otherwise known as an algorithm, automatically discover groups or communities within a collection of people?

Today there are hundreds, if not thousands, of community detection algorithms, some relying on advanced AI methods. They are used for many purposes, including finding communities of interest and uncovering malicious groups on social media. Such algorithms encode intuitive assumptions, such as the expectation that nodes belonging to the same group are more densely connected to one another than nodes belonging to different groups.

Although an exciting line of work, community detection does not study the internal structure of communities. Should communities be thought of only as collections of nodes in networks? And what about communities that are small but particularly influential, such as inner circles and in-crowds?

Two hypothetical structures for influential groups

In a manner of speaking, you likely already have some inkling of the structure of very small groups in social networks. The truth of the adage that “a friend of my friend is also my friend” can be tested statistically in friendship networks by counting the number of triangles in the network and determining whether this number is higher than chance alone could explain. And indeed, many social network studies have been used to verify the claim.

Unfortunately, the concept starts breaking down when extended to groups with more than three members. Although motifs have been well studied in both algorithmic computer science and biology, they have not been reliably linked to influential groups in real communication networks.

six sets of four dots each with different configurations of lines connecting the dots
Six examples of motifs with four nodes.
Mayank Kejriwal, CC BY-ND

Building on this tradition, my doctoral student Ke Shen and I found and presented two structures that seem elaborate but turn out to be quite common in real networks.

The first structure extends the triangle, not by adding more nodes, but by directly adding triangles. Specifically, there is a central triangle that is flanked by other peripheral triangles. Importantly, the third person in any peripheral triangle must not be linked to the third person on the central triangle, thereby excluding them from the true inner circle of influence.

The second structure is similar but assumes that there is no central triangle, and the inner circle is just a pair of nodes. A real-life example might be two co-founders of a startup like Sergey Brin and Larry Page of Google, or a power couple with joint interests, common in global politics, like Bill and Hillary Clinton.

Understanding influential groups in an infamous network

We tested our hypothesis on the Enron email network, which is well studied in network science, with nodes representing email addresses and links representing communication among those addresses. Despite being elaborate, not only were our proposed structures present in the network in greater numbers than chance alone would predict, but a qualitative analysis showed that there is merit to the claim that they represent influential groups.

Two diagrams of overlapping sets of triangles labeled with names of people
Examples of the two structures found in the Enron network. More such structures are present in the network and cannot be explained by chance alone.
Mayank Kejriwal, CC BY-ND

The main characters in the Enron saga are well documented by now. Intriguingly, some of these characters do not seem to have had much official influence but may have wielded significant soft power. An example is Sherri Reinartz-Sera, who was the longtime administrative assistant of Jeffrey K. Skilling, the former chief executive of Enron. Unlike Skilling, Sera was only mentioned in a New York Times article following investigative reporting that took place during the course of the scandal. However, our algorithm discovered an influential group with Sera occupying a central position.

Dissecting power dynamics

Society has intricate structures at the levels of individuals, friendships and communities. In-crowds are not just ragtag groups of characters talking to one another, or a single ringleader calling all the shots. Many in-crowds, or influential groups, have a sophisticated structure.

While much still remains to be discovered about such groups and their influence, network science can help uncover their complexity.The Conversation

About the Author:

Mayank Kejriwal, Research Assistant Professor of Industrial & Systems Engineering, University of Southern California

This article is republished from The Conversation under a Creative Commons license. Read the original article.

S&P 500 Bullish Divergence

By Ino.com

– Last September, I called the S&P 500 index to lose 30% according to the projection based on a comparative analysis.

The index price was at $4,459 that time. The deepest valley since then was established at $3,637 last month. 18% of the index value evaporated since the idea had been posted and 25% from the top of this January ($4,819).

The majority of you voted for 10%-20% retracement and this was the closest call so far as we cannot be sure whether it is over or not.

To remind you, I had put together two ETFs and the S&P 500 index (black). I chose Vanguard Value Index Fund ETF (VTV) (red) and Vanguard Growth Index Fund ETF (VUG) (blue). Let us check the updated comparison chart below.

SP500 VTV VUG Comparison Chart

Source: TradingView
 

The bearish alert appeared to me when the value stocks (VTV, red) stopped contributing to the rise of the broad index. Moreover, the gap between the latter and the growth stocks (VUG, blue) has widened tremendously.

The retracement targets for VUG and the S&P 500 were based on the corresponding level of underlying / less performing instrument: for VUG it was the S&P 500 and for the S&P 500 – VTV.

It is amazing how accurately the VUG target at $217 was hit last month as the ETF dropped even lower in the valley of $213. The concept played out precisely as the VUG bounced off the broad index, blue bars approached but did not overlap black bars.

The S&P 500 index almost closed the gap with the VTV last month, however the VTV itself also dropped and hence wasn’t caught up. The retracement target has been set at $3,200 last September and the lowest level has been seen since then was $3,637 last month.

Let us look at the S&P 500 chart below to see what could happen next.

SP500 Weekly Chart

Source: TradingView
 

The price has shaped a familiar model of the Falling Wedge (purple) within the current retracement. The amplitude of fluctuations decreases as the price approached the apex of the pattern.

The RSI indicator has already built the invisible Bullish Divergence as it can be seen only through its readings: 30.2 vs. 30.5, which means higher valley versus the lower bottom in the price chart.

This combination of narrowing trendlines and bullish diverging indicator could result in the possible breakup anytime soon. Would it be a reversal or a dead cat bounce?

I added two paths on the chart. The red zigzag shows how the Falling Wedge would play out in the first place. The target (purple flat line) is located at the widest part of the pattern added to the breakup point. It coincides with the 61.8% Fibonacci retracement level at $4,367. It could be a double resistance.

The following drop should complete the complex correction down to $3,185. This target was calculated by subtracting the size of the Falling Wedge from the target of that pattern. And again, this area corresponds amazingly with the 61.8% Fibonacci retracement level and the first chart target based on a comparison with VTV.

The green path implies the sideways consolidation that should keep within the existing range of $3,637-$4,819.

Intelligent trades!

Aibek Burabayev
INO.com Contributor

Disclosure: This contributor has no positions in any stocks mentioned in this article. This article is the opinion of the contributor themselves. The above is a matter of opinion provided for general information purposes only and is not intended as investment advice. This contributor is not receiving compensation (other than from INO.com) for their opinion.

By Ino.com – See our Trader Blog, INO TV Free & Market Analysis Alerts

Source: S&P 500 Bullish Divergence

Murrey Math Lines 21.07.2022 (USDCHF, GOLD)

Article By RoboForex.com

USDCHF, “US Dollar vs Swiss Franc”

As we can see in the H4 chart, having rebounded from the support at 3/8, USDCHF is consolidating. In this case, the pair is expected to grow towards the resistance at 5/8. However, this scenario may be cancelled if the price breaks 3/8 to the downside. After that, the instrument may move downwards to reach the support at 2/8.

USDCHFH4
Risk Warning: the result of previous trading operations do not guarantee the same results in the future

In the M15 chart, the pair may break the upside line of the VoltyChannel indicator and, as a result, continue its growth.

USDCHF_M15
Risk Warning: the result of previous trading operations do not guarantee the same results in the future

XAUUSD, “Gold vs US Dollar”

As we can see in the H4 chart, XAUUSD is trading inside the “oversold area”. In this case, the price is expected to test -2/8, rebound from it, and then resume moving upwards to reach the resistance at -1/8. However, this scenario may no longer be valid if the price breaks the support at -2/8 to the downside. After that, the lines in the chart will be redrawn, thus helping us to define new downside targets.

XAUUSD_H4
Risk Warning: the result of previous trading operations do not guarantee the same results in the future

In the M15 chart, the pair may break the upside line of the VoltyChannel indicator and, as a result, continue trading upwards.

XAUUSD_M15

Article By RoboForex.com

Attention!
Forecasts presented in this section only reflect the author’s private opinion and should not be considered as guidance for trading. RoboForex LP bears no responsibility for trading results based on trading recommendations described in these analytical reviews.

Japanese Candlesticks Analysis 21.07.2022 (EURUSD, USDJPY, EURGBP)

Article By RoboForex.com

USDCHF, “US Dollar vs Swiss Franc”

As we can see in the H4 chart, having rebounded from the support at 3/8, USDCHF is consolidating. In this case, the pair is expected to grow towards the resistance at 5/8. However, this scenario may be cancelled if the price breaks 3/8 to the downside. After that, the instrument may move downwards to reach the support at 2/8.

USDCHFH4
Risk Warning: the result of previous trading operations do not guarantee the same results in the future

In the M15 chart, the pair may break the upside line of the VoltyChannel indicator and, as a result, continue its growth.

USDCHF_M15
Risk Warning: the result of previous trading operations do not guarantee the same results in the future

XAUUSD, “Gold vs US Dollar”

As we can see in the H4 chart, XAUUSD is trading inside the “oversold area”. In this case, the price is expected to test -2/8, rebound from it, and then resume moving upwards to reach the resistance at -1/8. However, this scenario may no longer be valid if the price breaks the support at -2/8 to the downside. After that, the lines in the chart will be redrawn, thus helping us to define new downside targets.

XAUUSD_H4
Risk Warning: the result of previous trading operations do not guarantee the same results in the future

In the M15 chart, the pair may break the upside line of the VoltyChannel indicator and, as a result, continue trading upwards.

XAUUSD_M15

Article By RoboForex.com

Attention!
Forecasts presented in this section only reflect the author’s private opinion and should not be considered as guidance for trading. RoboForex LP bears no responsibility for trading results based on trading recommendations described in these analytical reviews.