
By InvestMacro | COT | Data Tables | COT Leaders | Downloads | COT Newsletter
Here are the latest charts and statistics for the Commitment of Traders (COT) data published by the Commodities Futures Trading Commission (CFTC).
The latest COT data is updated through Tuesday August 2nd and shows a quick view of how large traders (for-profit speculators and commercial entities) were positioned in the futures markets.
Weekly Speculator Changes: COT Week 31
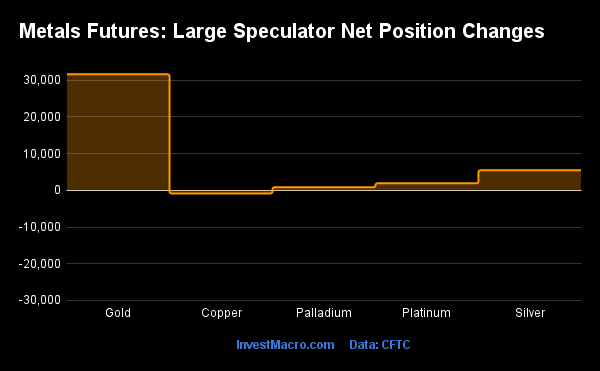
COT precious metals speculator bets were higher this week as four out of the five metals markets we cover had higher positioning this week while only one market recorded lower contracts.
Leading the gains for the precious metals markets was Gold (31,636 contracts) with Silver (5,474 contracts), Platinum (1,927 contracts) and Palladium (848 contracts) also having positive weeks.
Free Reports:
 Get our Weekly Commitment of Traders Reports - See where the biggest traders (Hedge Funds and Commercial Hedgers) are positioned in the futures markets on a weekly basis.
 Sign Up for Our Stock Market Newsletter – Get updated on News, Charts & Rankings of Public Companies when you join our Stocks Newsletter
The only metals markets with a weekly decline in speculator bets this week was Copper with a shortfall of -844 contracts.
Highlighting the metals markets data this week was a rebound in the Gold speculator bets. The speculative position for Gold Futures jumped this week by over +30,000 contracts and halted a streak of five straight weeks of declines. Speculator bets had dropped by a total of -70,597 contracts over the previous five weeks and those declines had brought the overall bullish position to a total of just +92,690 contracts. This marked the lowest overall speculator standing in the past one hundred and sixty-five weeks, dating back to May 28th of 2019 at the height of the COVID-19 pandemic panic. This week’s rebound brings the overall total back above the +120,000 contract level for the first time in four weeks. Gold futures prices have risen back around the $1,800 level after dropping to approximately $1,680 on July 21st.
Silver bets also had a rebound this week by over +5,000 contracts and put a stop to a five-week slide in speculator bets (total decline of -22,919 contracts). Silver’s positioning has been extremely weak in recent months and had fallen in thirteen out of the previous fourteen weeks through last week. This week’s rebound brought the overall Silver position out of a net bearish level after falling into a bearish position for the first time since June 4th of 2019, a span of 164 weeks. Silver futures prices, meanwhile, ended the week just below the important psychological $20 level after spending a few weeks falling hitting lows down near the $18 level.
| Aug-02-2022 | OI | OI-Index | Spec-Net | Spec-Index | Com-Net | COM-Index | Smalls-Net | Smalls-Index |
|---|---|---|---|---|---|---|---|---|
| WTI Crude | 1,606,910 | 3 | 253,752 | 0 | -272,866 | 100 | 19,114 | 42 |
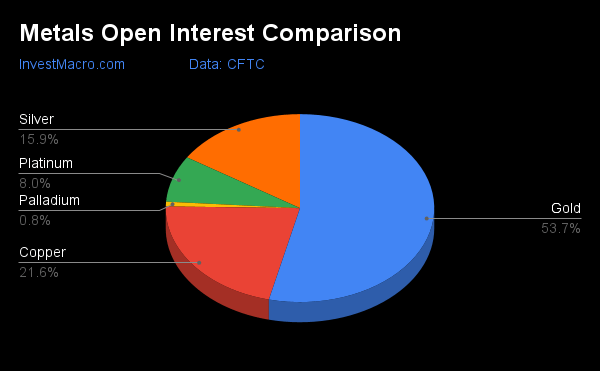
| Gold | 459,649 | 2 | 124,326 | 12 | -135,565 | 90 | 11,239 | 0 |
| Silver | 136,267 | 3 | 974 | 7 | -9,064 | 93 | 8,090 | 8 |
| Copper | 184,441 | 16 | -27,406 | 23 | 27,672 | 78 | -266 | 24 |
| Palladium | 6,945 | 3 | -2,560 | 8 | 2,743 | 90 | -183 | 33 |
| Platinum | 68,266 | 36 | -2,541 | 5 | -1,708 | 96 | 4,249 | 21 |
| Natural Gas | 984,570 | 5 | -124,973 | 41 | 87,596 | 58 | 37,377 | 69 |
| Brent | 171,751 | 17 | -32,782 | 56 | 31,835 | 46 | 947 | 22 |
| Heating Oil | 276,520 | 26 | 22,068 | 75 | -35,389 | 34 | 13,321 | 44 |
| Soybeans | 572,925 | 0 | 92,527 | 42 | -65,632 | 64 | -26,895 | 26 |
| Corn | 1,347,894 | 6 | 201,355 | 56 | -149,434 | 51 | -51,921 | 13 |
| Coffee | 207,740 | 12 | 27,284 | 62 | -27,968 | 44 | 684 | 6 |
| Sugar | 760,093 | 11 | 34,438 | 44 | -35,229 | 61 | 791 | 9 |
| Wheat | 316,244 | 12 | -725 | 18 | 10,888 | 75 | -10,163 | 58 |
Strength Scores
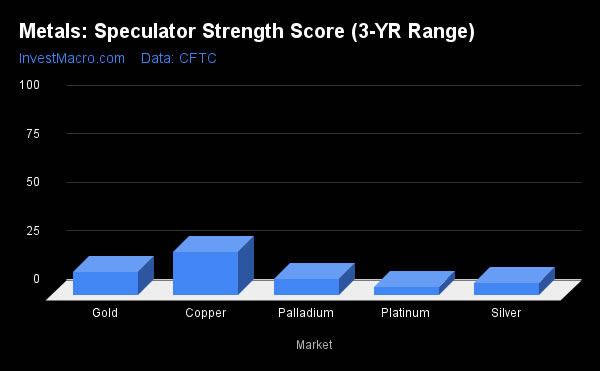
Strength scores (a measure of the 3-Year range of Speculator positions, from 0 to 100 where above 80 is extreme bullish and below 20 is extreme bearish) showed that the Copper (22.6 percent) continues to lead the metals although with a low score that is just outside an extreme bearish position (below 20 percent). Gold (12.1 percent), Palladium (8.4 percent), Silver (6.6 percent) and Platinum (4.6 percent) all have strength scores that remain in bearish extreme levels (below 20 percent) but all of these markets have improving scores compared to last week.
Strength Statistics:
Gold (12.1 percent) vs Gold previous week (0.0 percent)
Silver (6.6 percent) vs Silver previous week (0.0 percent)
Copper (22.6 percent) vs Copper previous week (23.2 percent)
Platinum (4.6 percent) vs Platinum previous week (2.0 percent)
Palladium (8.4 percent) vs Palladium previous week (3.7 percent)
Strength Trends
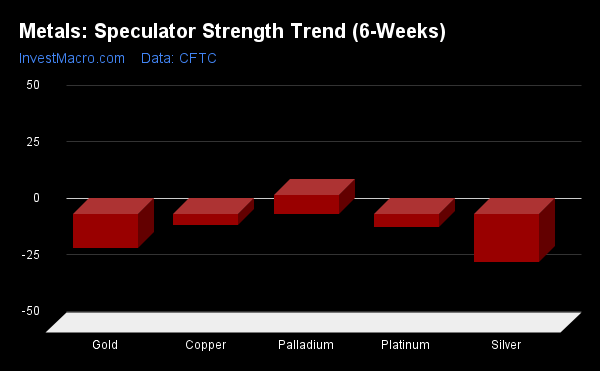
Strength Score Trends (or move index, calculates the 6-week changes in strength scores) showed that the Palladium (8.4 percent) leads the past six weeks trends for metals this week and is the only market currently with a positive six-week trend score. Silver (-21.2 percent) and Gold (-14.9 percent) lead the downside trend scores currently followed by Platinum (-5.5 percent) and Copper (-4.7 percent).
Move Statistics:
Gold (-14.9 percent) vs Gold previous week (-23.7 percent)
Silver (-21.2 percent) vs Silver previous week (-22.5 percent)
Copper (-4.7 percent) vs Copper previous week (-9.2 percent)
Platinum (-5.5 percent) vs Platinum previous week (-9.1 percent)
Palladium (8.4 percent) vs Palladium previous week (3.7 percent)
Individual Markets:
Gold Comex Futures:
 The Gold Comex Futures large speculator standing this week was a net position of 124,326 contracts in the data reported through Tuesday. This was a weekly boost of 31,636 contracts from the previous week which had a total of 92,690 net contracts.
This week’s current strength score (the trader positioning range over the past three years, measured from 0 to 100) shows the speculators are currently Bearish-Extreme with a score of 12.1 percent. The commercials are Bullish-Extreme with a score of 90.2 percent and the small traders (not shown in chart) are Bearish-Extreme with a score of 0.0 percent.
| Gold Futures Statistics | SPECULATORS | COMMERCIALS | SMALL TRADERS |
| – Percent of Open Interest Longs: | 52.7 | 27.8 | 8.2 |
| – Percent of Open Interest Shorts: | 25.6 | 57.3 | 5.7 |
| – Net Position: | 124,326 | -135,565 | 11,239 |
| – Gross Longs: | 242,128 | 127,700 | 37,481 |
| – Gross Shorts: | 117,802 | 263,265 | 26,242 |
| – Long to Short Ratio: | 2.1 to 1 | 0.5 to 1 | 1.4 to 1 |
| NET POSITION TREND: | |||
| – Strength Index Score (3 Year Range Pct): | 12.1 | 90.2 | 0.0 |
| – Strength Index Reading (3 Year Range): | Bearish-Extreme | Bullish-Extreme | Bearish-Extreme |
| NET POSITION MOVEMENT INDEX: | |||
| – 6-Week Change in Strength Index: | -14.9 | 18.5 | -33.9 |
Silver Comex Futures:
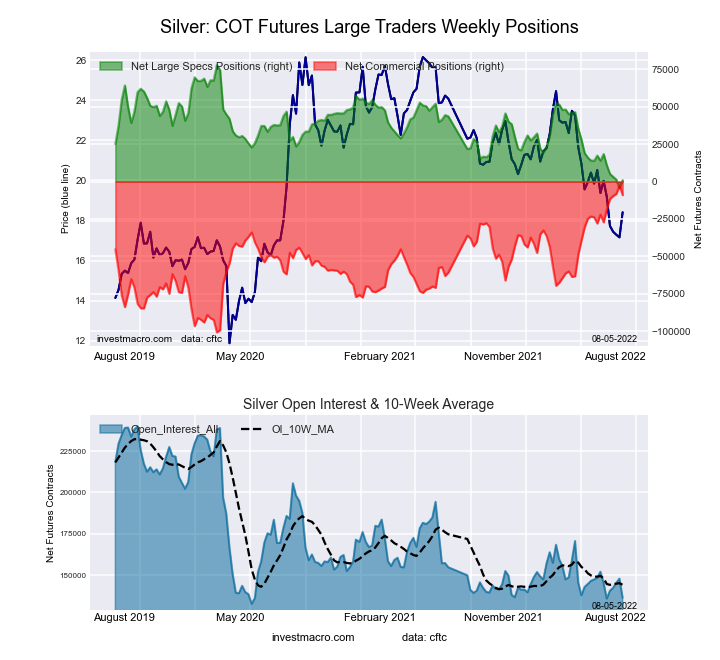 The Silver Comex Futures large speculator standing this week was a net position of 974 contracts in the data reported through Tuesday. This was a weekly lift of 5,474 contracts from the previous week which had a total of -4,500 net contracts.
This week’s current strength score (the trader positioning range over the past three years, measured from 0 to 100) shows the speculators are currently Bearish-Extreme with a score of 6.6 percent. The commercials are Bullish-Extreme with a score of 93.5 percent and the small traders (not shown in chart) are Bearish-Extreme with a score of 8.2 percent.
| Silver Futures Statistics | SPECULATORS | COMMERCIALS | SMALL TRADERS |
| – Percent of Open Interest Longs: | 36.1 | 40.8 | 16.3 |
| – Percent of Open Interest Shorts: | 35.4 | 47.4 | 10.4 |
| – Net Position: | 974 | -9,064 | 8,090 |
| – Gross Longs: | 49,220 | 55,536 | 22,198 |
| – Gross Shorts: | 48,246 | 64,600 | 14,108 |
| – Long to Short Ratio: | 1.0 to 1 | 0.9 to 1 | 1.6 to 1 |
| NET POSITION TREND: | |||
| – Strength Index Score (3 Year Range Pct): | 6.6 | 93.5 | 8.2 |
| – Strength Index Reading (3 Year Range): | Bearish-Extreme | Bullish-Extreme | Bearish-Extreme |
| NET POSITION MOVEMENT INDEX: | |||
| – 6-Week Change in Strength Index: | -21.2 | 18.5 | -3.6 |
Copper Grade #1 Futures:
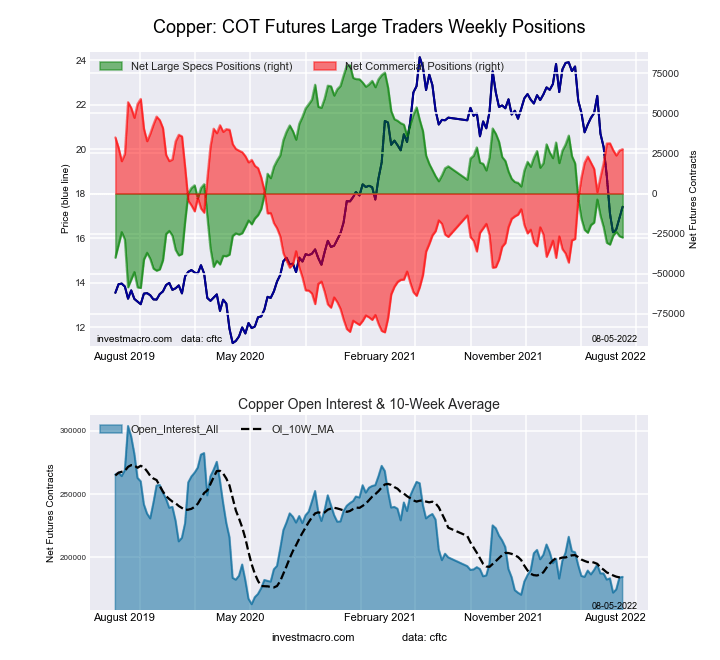 The Copper Grade #1 Futures large speculator standing this week was a net position of -27,406 contracts in the data reported through Tuesday. This was a weekly decline of -844 contracts from the previous week which had a total of -26,562 net contracts.
This week’s current strength score (the trader positioning range over the past three years, measured from 0 to 100) shows the speculators are currently Bearish with a score of 22.6 percent. The commercials are Bullish with a score of 78.5 percent and the small traders (not shown in chart) are Bearish with a score of 23.7 percent.
| Copper Futures Statistics | SPECULATORS | COMMERCIALS | SMALL TRADERS |
| – Percent of Open Interest Longs: | 27.3 | 45.8 | 7.3 |
| – Percent of Open Interest Shorts: | 42.1 | 30.8 | 7.4 |
| – Net Position: | -27,406 | 27,672 | -266 |
| – Gross Longs: | 50,317 | 84,447 | 13,430 |
| – Gross Shorts: | 77,723 | 56,775 | 13,696 |
| – Long to Short Ratio: | 0.6 to 1 | 1.5 to 1 | 1.0 to 1 |
| NET POSITION TREND: | |||
| – Strength Index Score (3 Year Range Pct): | 22.6 | 78.5 | 23.7 |
| – Strength Index Reading (3 Year Range): | Bearish | Bullish | Bearish |
| NET POSITION MOVEMENT INDEX: | |||
| – 6-Week Change in Strength Index: | -4.7 | 6.0 | -13.2 |
Platinum Futures:
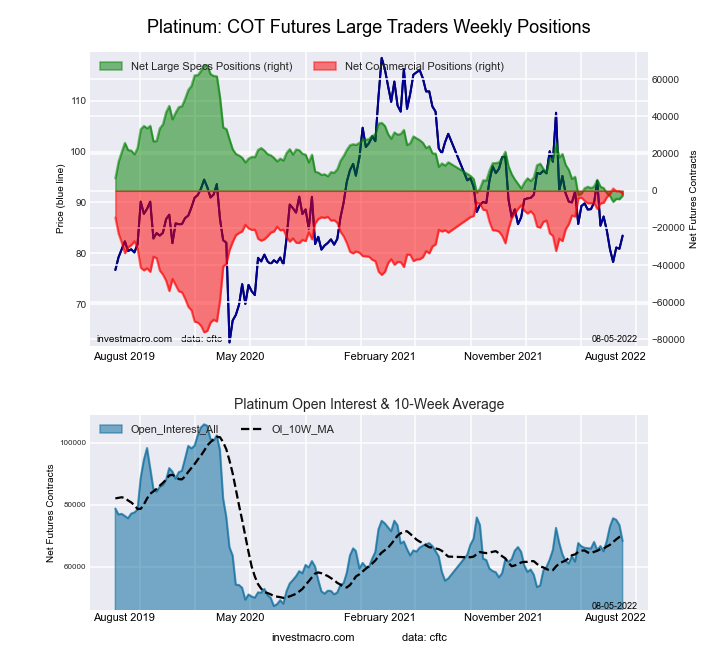 The Platinum Futures large speculator standing this week was a net position of -2,541 contracts in the data reported through Tuesday. This was a weekly rise of 1,927 contracts from the previous week which had a total of -4,468 net contracts.
This week’s current strength score (the trader positioning range over the past three years, measured from 0 to 100) shows the speculators are currently Bearish-Extreme with a score of 4.6 percent. The commercials are Bullish-Extreme with a score of 96.2 percent and the small traders (not shown in chart) are Bearish with a score of 21.2 percent.
| Platinum Futures Statistics | SPECULATORS | COMMERCIALS | SMALL TRADERS |
| – Percent of Open Interest Longs: | 42.0 | 38.9 | 11.2 |
| – Percent of Open Interest Shorts: | 45.7 | 41.4 | 5.0 |
| – Net Position: | -2,541 | -1,708 | 4,249 |
| – Gross Longs: | 28,648 | 26,551 | 7,673 |
| – Gross Shorts: | 31,189 | 28,259 | 3,424 |
| – Long to Short Ratio: | 0.9 to 1 | 0.9 to 1 | 2.2 to 1 |
| NET POSITION TREND: | |||
| – Strength Index Score (3 Year Range Pct): | 4.6 | 96.2 | 21.2 |
| – Strength Index Reading (3 Year Range): | Bearish-Extreme | Bullish-Extreme | Bearish |
| NET POSITION MOVEMENT INDEX: | |||
| – 6-Week Change in Strength Index: | -5.5 | 6.1 | -9.2 |
Palladium Futures:
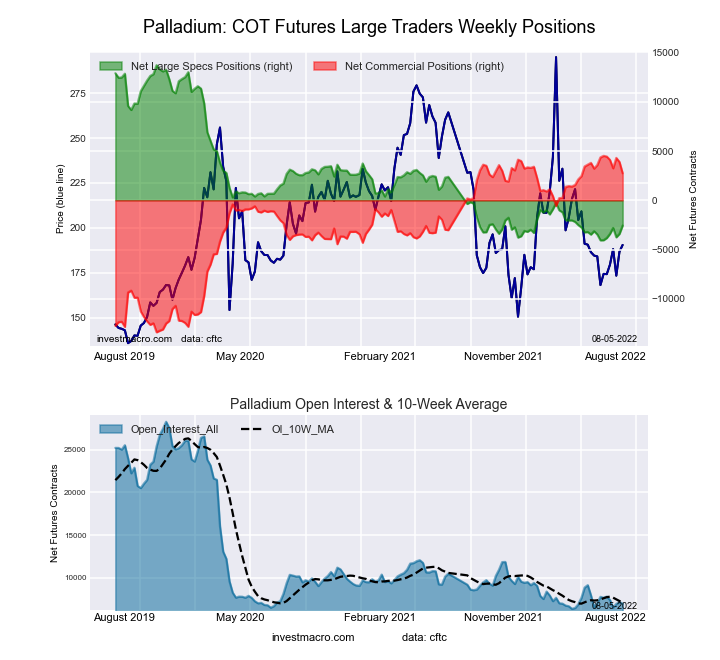 The Palladium Futures large speculator standing this week was a net position of -2,560 contracts in the data reported through Tuesday. This was a weekly lift of 848 contracts from the previous week which had a total of -3,408 net contracts.
This week’s current strength score (the trader positioning range over the past three years, measured from 0 to 100) shows the speculators are currently Bearish-Extreme with a score of 8.4 percent. The commercials are Bullish-Extreme with a score of 90.1 percent and the small traders (not shown in chart) are Bearish with a score of 33.3 percent.
| Palladium Futures Statistics | SPECULATORS | COMMERCIALS | SMALL TRADERS |
| – Percent of Open Interest Longs: | 13.9 | 63.4 | 15.1 |
| – Percent of Open Interest Shorts: | 50.8 | 23.9 | 17.8 |
| – Net Position: | -2,560 | 2,743 | -183 |
| – Gross Longs: | 965 | 4,400 | 1,051 |
| – Gross Shorts: | 3,525 | 1,657 | 1,234 |
| – Long to Short Ratio: | 0.3 to 1 | 2.7 to 1 | 0.9 to 1 |
| NET POSITION TREND: | |||
| – Strength Index Score (3 Year Range Pct): | 8.4 | 90.1 | 33.3 |
| – Strength Index Reading (3 Year Range): | Bearish-Extreme | Bullish-Extreme | Bearish |
| NET POSITION MOVEMENT INDEX: | |||
| – 6-Week Change in Strength Index: | 8.4 | -9.9 | 16.3 |
Article By InvestMacro – Receive our weekly COT Reports by Email
*COT Report: The COT data, released weekly to the public each Friday, is updated through the most recent Tuesday (data is 3 days old) and shows a quick view of how large speculators or non-commercials (for-profit traders) were positioned in the futures markets.
The CFTC categorizes trader positions according to commercial hedgers (traders who use futures contracts for hedging as part of the business), non-commercials (large traders who speculate to realize trading profits) and nonreportable traders (usually small traders/speculators) as well as their open interest (contracts open in the market at time of reporting).See CFTC criteria here.

- COT Metals Charts: Weekly Speculator Bets led by Copper & Steel Jul 18, 2026
- COT Bonds Charts: Weekly Speculator Bets led by 2-Year, SOFR 3M & 5-Year Bonds Jul 18, 2026
- COT Energy Charts: Weekly Speculator Bets led by Brent Oil & Heating Oil Jul 18, 2026
- COT Soft Commodities Charts: Weekly Speculator Bets led by Wheat, Corn & Soybean Meal Jul 18, 2026
- The Bank of Canada kept its interest rate unchanged. Platinum prices reached a three‑week high Jul 16, 2026
- Stock indices rose after the release of US inflation data. China’s GDP slowed sharply Jul 15, 2026
- GBP/USD Awaits Political News: What Will Happen Next Jul 15, 2026
- USD/JPY Holds at Highs: Pressure Lingers on Yen Jul 14, 2026
- Oil prices jumped 4% amid a new wave of escalation between the US and Iran Jul 13, 2026
- EUR/USD: US Inflation Will Determine Everything Jul 13, 2026