
By InvestMacro | COT | Data Tables | COT Leaders | Downloads | COT Newsletter
Here are the latest charts and statistics for the Commitment of Traders (COT) data published by the Commodities Futures Trading Commission (CFTC).
The latest COT data is updated through Tuesday August 2nd and shows a quick view of how large traders (for-profit speculators and commercial entities) were positioned in the futures markets.
Weekly Speculator Changes
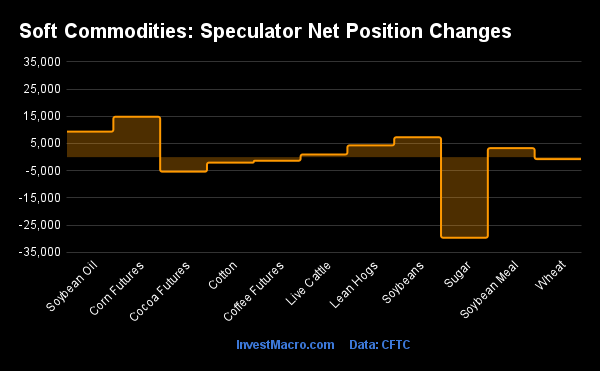
COT soft commodities speculator bets were mostly higher this week as six out of the eleven soft commodities markets we cover had higher positioning this week while the other five markets recorded lower contracts.
Leading the gains for soft commodities markets was Corn (14,827 contracts) with Soybean Oil (9,351 contracts), Soybeans (7,286 contracts), Lean Hogs (4,296 contracts), Soybean Meal (3,269 contracts) and Live Cattle (962 contracts) also having positive weeks.
Free Reports:
 Download Our Metatrader 4 Indicators – Put Our Free MetaTrader 4 Custom Indicators on your charts when you join our Weekly Newsletter
 Get our Weekly Commitment of Traders Reports - See where the biggest traders (Hedge Funds and Commercial Hedgers) are positioned in the futures markets on a weekly basis.
The softs markets leading the declines in speculator bets this week were Sugar (-29,665 contracts) and Cocoa (-5,365 contracts) with Cotton (-2,035 contracts), Coffee (-1,357 contracts) and Wheat (-750 contracts) also seeing lower bets on the week.
| Aug-02-2022 | OI | OI-Index | Spec-Net | Spec-Index | Com-Net | COM-Index | Smalls-Net | Smalls-Index |
|---|---|---|---|---|---|---|---|---|
| WTI Crude | 1,606,910 | 3 | 253,752 | 0 | -272,866 | 100 | 19,114 | 42 |
| Gold | 459,649 | 2 | 124,326 | 12 | -135,565 | 90 | 11,239 | 0 |
| Silver | 136,267 | 3 | 974 | 7 | -9,064 | 93 | 8,090 | 8 |
| Copper | 184,441 | 16 | -27,406 | 23 | 27,672 | 78 | -266 | 24 |
| Palladium | 6,945 | 3 | -2,560 | 8 | 2,743 | 90 | -183 | 33 |
| Platinum | 68,266 | 36 | -2,541 | 5 | -1,708 | 96 | 4,249 | 21 |
| Natural Gas | 984,570 | 5 | -124,973 | 41 | 87,596 | 58 | 37,377 | 69 |
| Brent | 171,751 | 17 | -32,782 | 56 | 31,835 | 46 | 947 | 22 |
| Heating Oil | 276,520 | 26 | 22,068 | 75 | -35,389 | 34 | 13,321 | 44 |
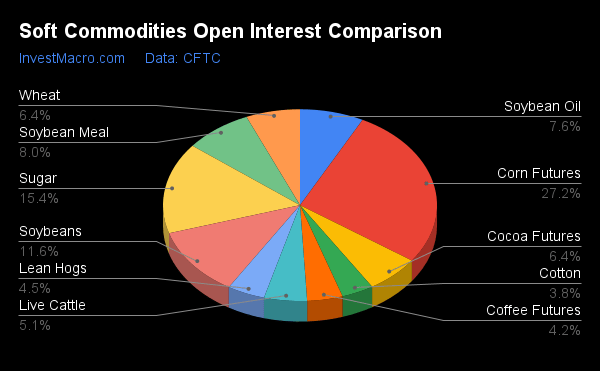
| Soybeans | 572,925 | 0 | 92,527 | 42 | -65,632 | 64 | -26,895 | 26 |
| Corn | 1,347,894 | 6 | 201,355 | 56 | -149,434 | 51 | -51,921 | 13 |
| Coffee | 207,740 | 12 | 27,284 | 62 | -27,968 | 44 | 684 | 6 |
| Sugar | 760,093 | 11 | 34,438 | 44 | -35,229 | 61 | 791 | 9 |
| Wheat | 316,244 | 12 | -725 | 18 | 10,888 | 75 | -10,163 | 58 |
Strength Scores
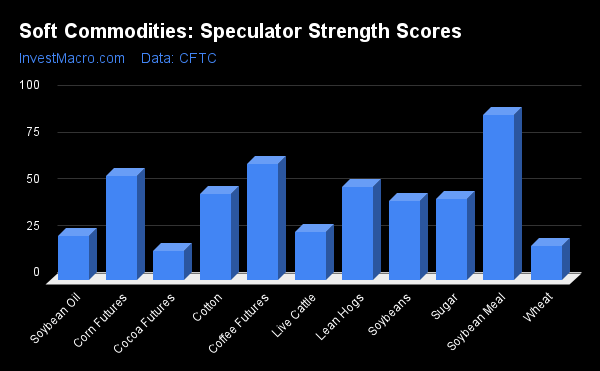
Strength Scores (a normalized measure of Speculator positions over a 3-Year range, from 0 to 100 where above 80 is extreme bullish and below 20 is extreme bearish) showed that Soybean Meal (88.6 percent) leads the soft commodity markets currently – up from last week (86.8 percent) and remaining in a bullish extreme position (above 80 percent). Coffee (62.4 percent), Corn (55.8 percent) and Lean Hogs (50.0 percent) come in as the next highest soft commodity markets and all are above the midpoint (50 percent) of their three-year ranges. On the downside, Cocoa (15.7 percent) and Wheat (18.1 percent) come in at the weakest strength levels currently and are both in extreme bearish readings (below 20 percent).
Strength Statistics:
Corn (55.8 percent) vs Corn previous week (53.9 percent)
Sugar (43.7 percent) vs Sugar previous week (49.8 percent)
Coffee (62.4 percent) vs Coffee previous week (63.6 percent)
Soybeans (42.3 percent) vs Soybeans previous week (40.1 percent)
Soybean Oil (23.8 percent) vs Soybean Oil previous week (17.4 percent)
Soybean Meal (88.6 percent) vs Soybean Meal previous week (86.8 percent)
Live Cattle (25.6 percent) vs Live Cattle previous week (24.4 percent)
Lean Hogs (50.0 percent) vs Lean Hogs previous week (45.3 percent)
Cotton (46.3 percent) vs Cotton previous week (47.6 percent)
Cocoa (15.7 percent) vs Cocoa previous week (21.0 percent)
Wheat (18.1 percent) vs Wheat previous week (19.1 percent)
Strength Trends
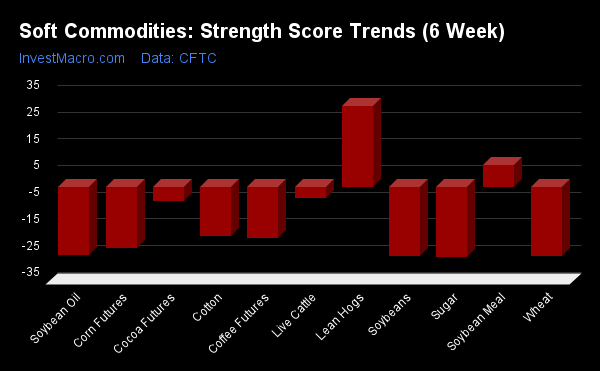
Strength Score Trends (or move index, calculates the 6-week changes in strength scores) showed that the Lean Hogs (30.1 percent) leads the past six weeks trends for soft commodity markets. Soybean Meal (8.0 percent) comes in as the only other positive mover in the latest trends data and this, overall, shows the weakening sentiment for soft commodity speculators over the past six weeks after starting the year with strong bullish sentiment. On the downside, Sugar (-26.4 percent) leads the negative trend scores currently with Soybeans (-26.1 percent), Wheat (-25.8 percent) and Soybean Oil (-25.6 percent) following as the next markets with lower trend scores.
Strength Trend Statistics:
Corn (-22.8 percent) vs Corn previous week (-27.2 percent)
Sugar (-26.4 percent) vs Sugar previous week (-21.9 percent)
Coffee (-19.1 percent) vs Coffee previous week (-15.8 percent)
Soybeans (-26.1 percent) vs Soybeans previous week (-29.6 percent)
Soybean Oil (-25.6 percent) vs Soybean Oil previous week (-36.0 percent)
Soybean Meal (8.0 percent) vs Soybean Meal previous week (9.8 percent)
Live Cattle (-4.1 percent) vs Live Cattle previous week (4.0 percent)
Lean Hogs (30.1 percent) vs Lean Hogs previous week (30.5 percent)
Cotton (-18.4 percent) vs Cotton previous week (-17.3 percent)
Cocoa (-5.2 percent) vs Cocoa previous week (6.6 percent)
Wheat (-25.8 percent) vs Wheat previous week (-26.6 percent)
Individual Markets:
CORN Futures:
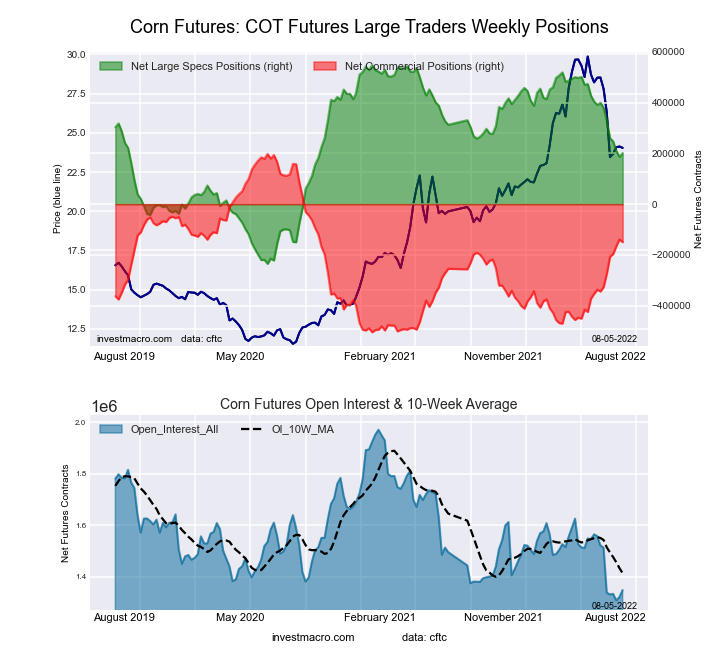 The CORN large speculator standing this week resulted in a net position of 201,355 contracts in the data reported through Tuesday. This was a weekly increase of 14,827 contracts from the previous week which had a total of 186,528 net contracts.
This week’s current strength score (the trader positioning range over the past three years, measured from 0 to 100) shows the speculators are currently Bullish with a score of 55.8 percent. The commercials are Bullish with a score of 50.6 percent and the small traders (not shown in chart) are Bearish-Extreme with a score of 13.2 percent.
| CORN Futures Statistics | SPECULATORS | COMMERCIALS | SMALL TRADERS |
| – Percent of Open Interest Longs: | 25.7 | 48.0 | 9.2 |
| – Percent of Open Interest Shorts: | 10.8 | 59.1 | 13.0 |
| – Net Position: | 201,355 | -149,434 | -51,921 |
| – Gross Longs: | 346,483 | 647,342 | 123,650 |
| – Gross Shorts: | 145,128 | 796,776 | 175,571 |
| – Long to Short Ratio: | 2.4 to 1 | 0.8 to 1 | 0.7 to 1 |
| NET POSITION TREND: | |||
| – Strength Index Score (3 Year Range Pct): | 55.8 | 50.6 | 13.2 |
| – Strength Index Reading (3 Year Range): | Bullish | Bullish | Bearish-Extreme |
| NET POSITION MOVEMENT INDEX: | |||
| – 6-Week Change in Strength Index: | -22.8 | 25.2 | 1.0 |
SUGAR Futures:
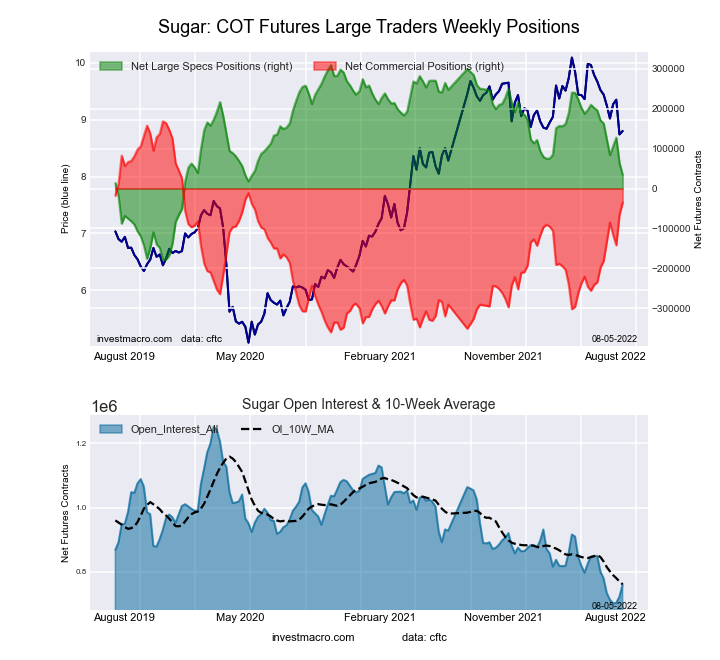 The SUGAR large speculator standing this week resulted in a net position of 34,438 contracts in the data reported through Tuesday. This was a weekly reduction of -29,665 contracts from the previous week which had a total of 64,103 net contracts.
This week’s current strength score (the trader positioning range over the past three years, measured from 0 to 100) shows the speculators are currently Bearish with a score of 43.7 percent. The commercials are Bullish with a score of 61.5 percent and the small traders (not shown in chart) are Bearish-Extreme with a score of 8.8 percent.
| SUGAR Futures Statistics | SPECULATORS | COMMERCIALS | SMALL TRADERS |
| – Percent of Open Interest Longs: | 24.0 | 53.1 | 8.6 |
| – Percent of Open Interest Shorts: | 19.5 | 57.7 | 8.5 |
| – Net Position: | 34,438 | -35,229 | 791 |
| – Gross Longs: | 182,484 | 403,319 | 65,198 |
| – Gross Shorts: | 148,046 | 438,548 | 64,407 |
| – Long to Short Ratio: | 1.2 to 1 | 0.9 to 1 | 1.0 to 1 |
| NET POSITION TREND: | |||
| – Strength Index Score (3 Year Range Pct): | 43.7 | 61.5 | 8.8 |
| – Strength Index Reading (3 Year Range): | Bearish | Bullish | Bearish-Extreme |
| NET POSITION MOVEMENT INDEX: | |||
| – 6-Week Change in Strength Index: | -26.4 | 27.7 | -21.5 |
COFFEE Futures:
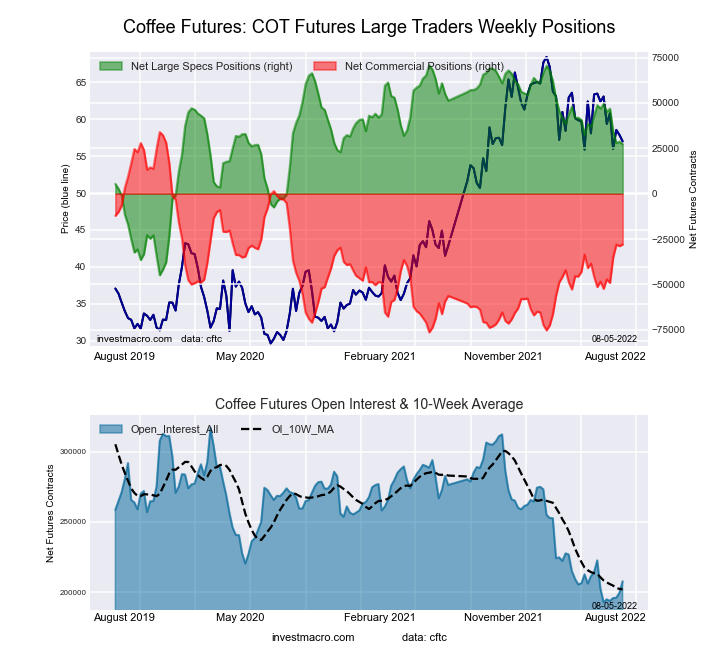 The COFFEE large speculator standing this week resulted in a net position of 27,284 contracts in the data reported through Tuesday. This was a weekly decline of -1,357 contracts from the previous week which had a total of 28,641 net contracts.
This week’s current strength score (the trader positioning range over the past three years, measured from 0 to 100) shows the speculators are currently Bullish with a score of 62.4 percent. The commercials are Bearish with a score of 43.9 percent and the small traders (not shown in chart) are Bearish-Extreme with a score of 5.8 percent.
| COFFEE Futures Statistics | SPECULATORS | COMMERCIALS | SMALL TRADERS |
| – Percent of Open Interest Longs: | 21.4 | 54.7 | 3.9 |
| – Percent of Open Interest Shorts: | 8.3 | 68.2 | 3.6 |
| – Net Position: | 27,284 | -27,968 | 684 |
| – Gross Longs: | 44,520 | 113,679 | 8,153 |
| – Gross Shorts: | 17,236 | 141,647 | 7,469 |
| – Long to Short Ratio: | 2.6 to 1 | 0.8 to 1 | 1.1 to 1 |
| NET POSITION TREND: | |||
| – Strength Index Score (3 Year Range Pct): | 62.4 | 43.9 | 5.8 |
| – Strength Index Reading (3 Year Range): | Bullish | Bearish | Bearish-Extreme |
| NET POSITION MOVEMENT INDEX: | |||
| – 6-Week Change in Strength Index: | -19.1 | 22.1 | -21.0 |
SOYBEANS Futures:
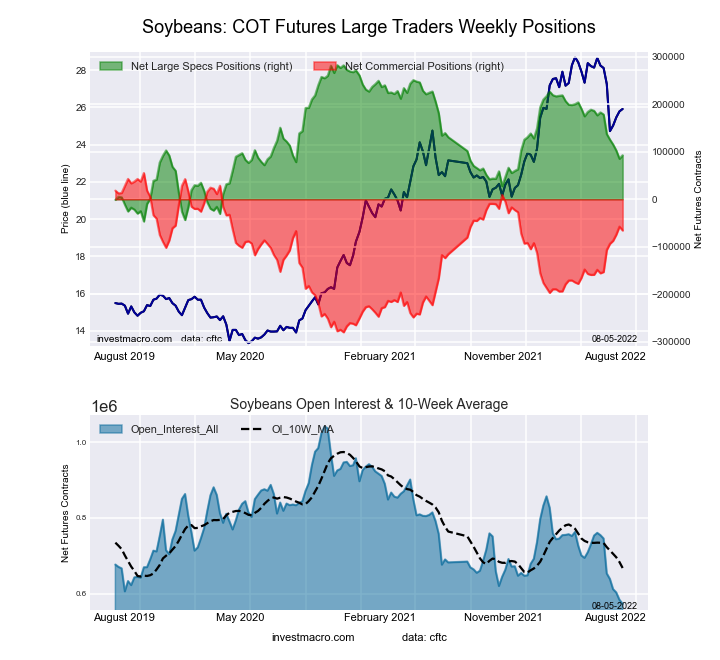 The SOYBEANS large speculator standing this week resulted in a net position of 92,527 contracts in the data reported through Tuesday. This was a weekly boost of 7,286 contracts from the previous week which had a total of 85,241 net contracts.
This week’s current strength score (the trader positioning range over the past three years, measured from 0 to 100) shows the speculators are currently Bearish with a score of 42.3 percent. The commercials are Bullish with a score of 63.9 percent and the small traders (not shown in chart) are Bearish with a score of 25.6 percent.
| SOYBEANS Futures Statistics | SPECULATORS | COMMERCIALS | SMALL TRADERS |
| – Percent of Open Interest Longs: | 25.6 | 54.0 | 6.5 |
| – Percent of Open Interest Shorts: | 9.4 | 65.5 | 11.1 |
| – Net Position: | 92,527 | -65,632 | -26,895 |
| – Gross Longs: | 146,533 | 309,594 | 36,964 |
| – Gross Shorts: | 54,006 | 375,226 | 63,859 |
| – Long to Short Ratio: | 2.7 to 1 | 0.8 to 1 | 0.6 to 1 |
| NET POSITION TREND: | |||
| – Strength Index Score (3 Year Range Pct): | 42.3 | 63.9 | 25.6 |
| – Strength Index Reading (3 Year Range): | Bearish | Bullish | Bearish |
| NET POSITION MOVEMENT INDEX: | |||
| – 6-Week Change in Strength Index: | -26.1 | 26.1 | -2.5 |
SOYBEAN OIL Futures:
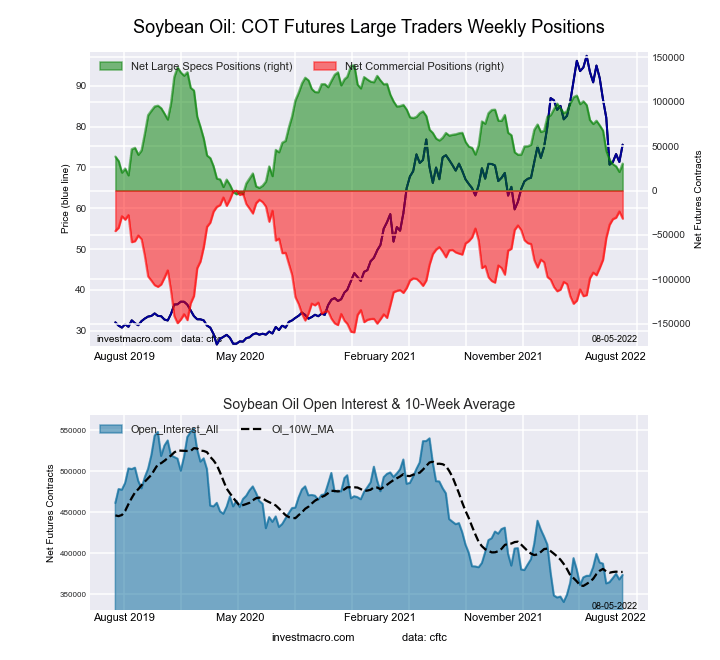 The SOYBEAN OIL large speculator standing this week resulted in a net position of 30,381 contracts in the data reported through Tuesday. This was a weekly rise of 9,351 contracts from the previous week which had a total of 21,030 net contracts.
This week’s current strength score (the trader positioning range over the past three years, measured from 0 to 100) shows the speculators are currently Bearish with a score of 23.8 percent. The commercials are Bullish-Extreme with a score of 80.3 percent and the small traders (not shown in chart) are Bearish-Extreme with a score of 18.0 percent.
| SOYBEAN OIL Futures Statistics | SPECULATORS | COMMERCIALS | SMALL TRADERS |
| – Percent of Open Interest Longs: | 18.0 | 57.6 | 6.5 |
| – Percent of Open Interest Shorts: | 9.9 | 66.1 | 6.2 |
| – Net Position: | 30,381 | -31,605 | 1,224 |
| – Gross Longs: | 67,218 | 215,402 | 24,405 |
| – Gross Shorts: | 36,837 | 247,007 | 23,181 |
| – Long to Short Ratio: | 1.8 to 1 | 0.9 to 1 | 1.1 to 1 |
| NET POSITION TREND: | |||
| – Strength Index Score (3 Year Range Pct): | 23.8 | 80.3 | 18.0 |
| – Strength Index Reading (3 Year Range): | Bearish | Bullish-Extreme | Bearish-Extreme |
| NET POSITION MOVEMENT INDEX: | |||
| – 6-Week Change in Strength Index: | -25.6 | 29.0 | -34.0 |
SOYBEAN MEAL Futures:
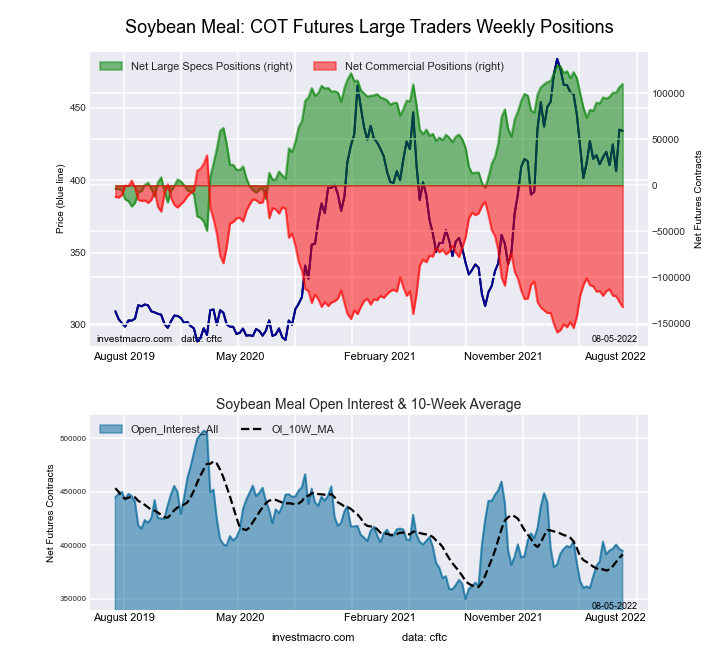 The SOYBEAN MEAL large speculator standing this week resulted in a net position of 109,776 contracts in the data reported through Tuesday. This was a weekly lift of 3,269 contracts from the previous week which had a total of 106,507 net contracts.
This week’s current strength score (the trader positioning range over the past three years, measured from 0 to 100) shows the speculators are currently Bullish-Extreme with a score of 88.6 percent. The commercials are Bearish-Extreme with a score of 14.2 percent and the small traders (not shown in chart) are Bearish with a score of 49.0 percent.
| SOYBEAN MEAL Futures Statistics | SPECULATORS | COMMERCIALS | SMALL TRADERS |
| – Percent of Open Interest Longs: | 30.2 | 39.9 | 11.8 |
| – Percent of Open Interest Shorts: | 2.4 | 73.4 | 6.1 |
| – Net Position: | 109,776 | -132,172 | 22,396 |
| – Gross Longs: | 119,342 | 157,419 | 46,629 |
| – Gross Shorts: | 9,566 | 289,591 | 24,233 |
| – Long to Short Ratio: | 12.5 to 1 | 0.5 to 1 | 1.9 to 1 |
| NET POSITION TREND: | |||
| – Strength Index Score (3 Year Range Pct): | 88.6 | 14.2 | 49.0 |
| – Strength Index Reading (3 Year Range): | Bullish-Extreme | Bearish-Extreme | Bearish |
| NET POSITION MOVEMENT INDEX: | |||
| – 6-Week Change in Strength Index: | 8.0 | -6.4 | -10.5 |
LIVE CATTLE Futures:
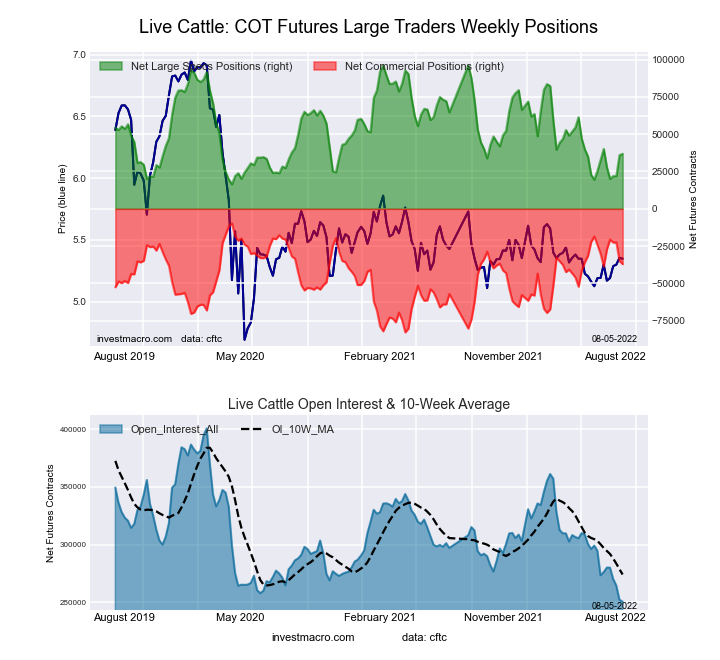 The LIVE CATTLE large speculator standing this week resulted in a net position of 36,889 contracts in the data reported through Tuesday. This was a weekly boost of 962 contracts from the previous week which had a total of 35,927 net contracts.
This week’s current strength score (the trader positioning range over the past three years, measured from 0 to 100) shows the speculators are currently Bearish with a score of 25.6 percent. The commercials are Bullish with a score of 62.6 percent and the small traders (not shown in chart) are Bullish-Extreme with a score of 82.3 percent.
| LIVE CATTLE Futures Statistics | SPECULATORS | COMMERCIALS | SMALL TRADERS |
| – Percent of Open Interest Longs: | 35.3 | 39.2 | 12.4 |
| – Percent of Open Interest Shorts: | 20.6 | 53.9 | 12.4 |
| – Net Position: | 36,889 | -37,027 | 138 |
| – Gross Longs: | 88,545 | 98,150 | 31,097 |
| – Gross Shorts: | 51,656 | 135,177 | 30,959 |
| – Long to Short Ratio: | 1.7 to 1 | 0.7 to 1 | 1.0 to 1 |
| NET POSITION TREND: | |||
| – Strength Index Score (3 Year Range Pct): | 25.6 | 62.6 | 82.3 |
| – Strength Index Reading (3 Year Range): | Bearish | Bullish | Bullish-Extreme |
| NET POSITION MOVEMENT INDEX: | |||
| – 6-Week Change in Strength Index: | -4.1 | 2.2 | 5.6 |
LEAN HOGS Futures:
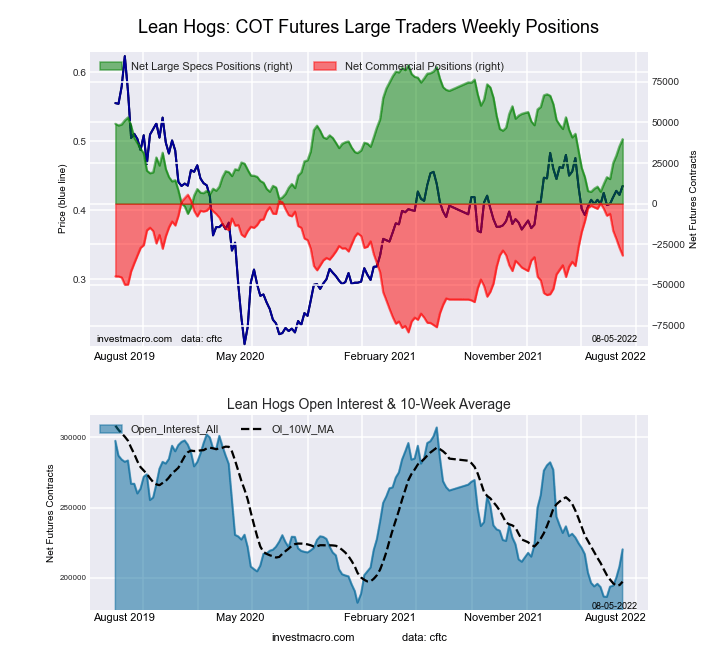 The LEAN HOGS large speculator standing this week resulted in a net position of 39,717 contracts in the data reported through Tuesday. This was a weekly boost of 4,296 contracts from the previous week which had a total of 35,421 net contracts.
This week’s current strength score (the trader positioning range over the past three years, measured from 0 to 100) shows the speculators are currently Bullish with a score of 50.0 percent. The commercials are Bullish with a score of 55.8 percent and the small traders (not shown in chart) are Bullish with a score of 55.8 percent.
| LEAN HOGS Futures Statistics | SPECULATORS | COMMERCIALS | SMALL TRADERS |
| – Percent of Open Interest Longs: | 39.3 | 34.3 | 9.5 |
| – Percent of Open Interest Shorts: | 21.3 | 48.8 | 13.1 |
| – Net Position: | 39,717 | -31,860 | -7,857 |
| – Gross Longs: | 86,616 | 75,563 | 20,898 |
| – Gross Shorts: | 46,899 | 107,423 | 28,755 |
| – Long to Short Ratio: | 1.8 to 1 | 0.7 to 1 | 0.7 to 1 |
| NET POSITION TREND: | |||
| – Strength Index Score (3 Year Range Pct): | 50.0 | 55.8 | 55.8 |
| – Strength Index Reading (3 Year Range): | Bullish | Bullish | Bullish |
| NET POSITION MOVEMENT INDEX: | |||
| – 6-Week Change in Strength Index: | 30.1 | -34.1 | 6.0 |
COTTON Futures:
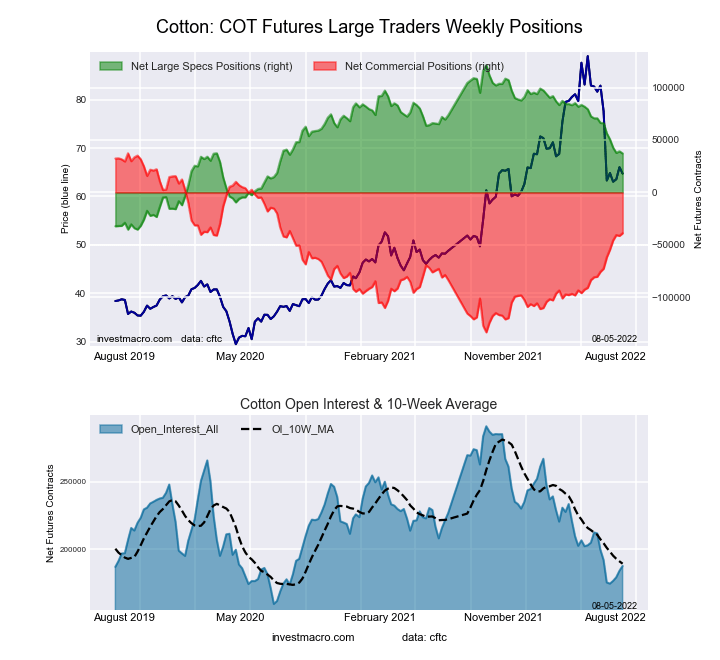 The COTTON large speculator standing this week resulted in a net position of 37,163 contracts in the data reported through Tuesday. This was a weekly reduction of -2,035 contracts from the previous week which had a total of 39,198 net contracts.
This week’s current strength score (the trader positioning range over the past three years, measured from 0 to 100) shows the speculators are currently Bearish with a score of 46.3 percent. The commercials are Bullish with a score of 56.1 percent and the small traders (not shown in chart) are Bearish with a score of 21.4 percent.
| COTTON Futures Statistics | SPECULATORS | COMMERCIALS | SMALL TRADERS |
| – Percent of Open Interest Longs: | 36.0 | 47.3 | 6.1 |
| – Percent of Open Interest Shorts: | 16.1 | 68.0 | 5.1 |
| – Net Position: | 37,163 | -38,884 | 1,721 |
| – Gross Longs: | 67,401 | 88,600 | 11,339 |
| – Gross Shorts: | 30,238 | 127,484 | 9,618 |
| – Long to Short Ratio: | 2.2 to 1 | 0.7 to 1 | 1.2 to 1 |
| NET POSITION TREND: | |||
| – Strength Index Score (3 Year Range Pct): | 46.3 | 56.1 | 21.4 |
| – Strength Index Reading (3 Year Range): | Bearish | Bullish | Bearish |
| NET POSITION MOVEMENT INDEX: | |||
| – 6-Week Change in Strength Index: | -18.4 | 20.1 | -31.8 |
COCOA Futures:
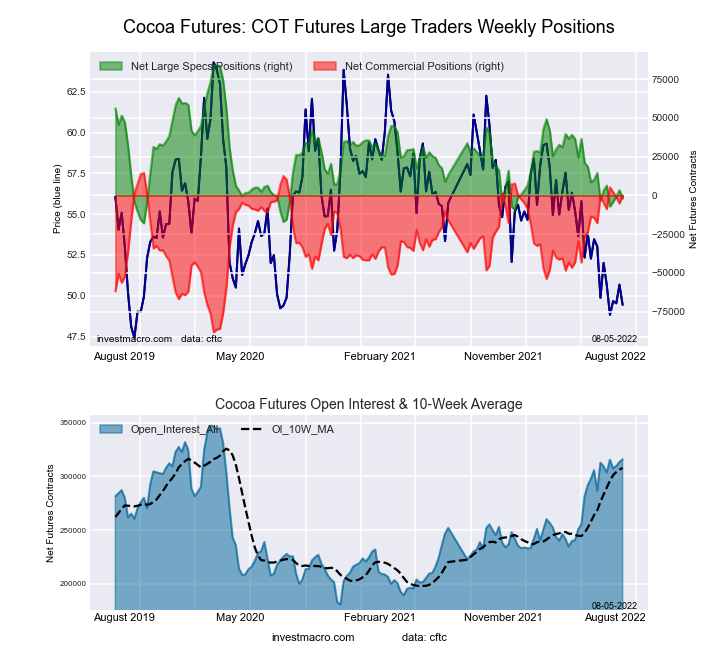 The COCOA large speculator standing this week resulted in a net position of -1,957 contracts in the data reported through Tuesday. This was a weekly reduction of -5,365 contracts from the previous week which had a total of 3,408 net contracts.
This week’s current strength score (the trader positioning range over the past three years, measured from 0 to 100) shows the speculators are currently Bearish-Extreme with a score of 15.7 percent. The commercials are Bullish-Extreme with a score of 86.0 percent and the small traders (not shown in chart) are Bearish-Extreme with a score of 15.4 percent.
| COCOA Futures Statistics | SPECULATORS | COMMERCIALS | SMALL TRADERS |
| – Percent of Open Interest Longs: | 29.4 | 45.6 | 4.1 |
| – Percent of Open Interest Shorts: | 30.0 | 45.6 | 3.5 |
| – Net Position: | -1,957 | 64 | 1,893 |
| – Gross Longs: | 92,787 | 144,155 | 12,923 |
| – Gross Shorts: | 94,744 | 144,091 | 11,030 |
| – Long to Short Ratio: | 1.0 to 1 | 1.0 to 1 | 1.2 to 1 |
| NET POSITION TREND: | |||
| – Strength Index Score (3 Year Range Pct): | 15.7 | 86.0 | 15.4 |
| – Strength Index Reading (3 Year Range): | Bearish-Extreme | Bullish-Extreme | Bearish-Extreme |
| NET POSITION MOVEMENT INDEX: | |||
| – 6-Week Change in Strength Index: | -5.2 | 4.8 | 3.4 |
WHEAT Futures:
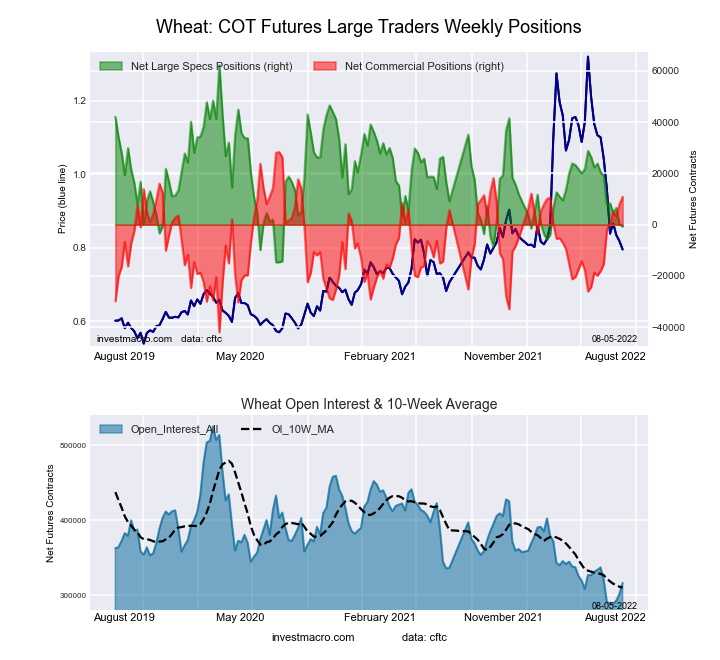 The WHEAT large speculator standing this week resulted in a net position of -725 contracts in the data reported through Tuesday. This was a weekly lowering of -750 contracts from the previous week which had a total of 25 net contracts.
This week’s current strength score (the trader positioning range over the past three years, measured from 0 to 100) shows the speculators are currently Bearish-Extreme with a score of 18.1 percent. The commercials are Bullish with a score of 75.2 percent and the small traders (not shown in chart) are Bullish with a score of 57.7 percent.
| WHEAT Futures Statistics | SPECULATORS | COMMERCIALS | SMALL TRADERS |
| – Percent of Open Interest Longs: | 30.3 | 40.4 | 8.8 |
| – Percent of Open Interest Shorts: | 30.5 | 37.0 | 12.1 |
| – Net Position: | -725 | 10,888 | -10,163 |
| – Gross Longs: | 95,807 | 127,784 | 27,981 |
| – Gross Shorts: | 96,532 | 116,896 | 38,144 |
| – Long to Short Ratio: | 1.0 to 1 | 1.1 to 1 | 0.7 to 1 |
| NET POSITION TREND: | |||
| – Strength Index Score (3 Year Range Pct): | 18.1 | 75.2 | 57.7 |
| – Strength Index Reading (3 Year Range): | Bearish-Extreme | Bullish | Bullish |
| NET POSITION MOVEMENT INDEX: | |||
| – 6-Week Change in Strength Index: | -25.8 | 37.4 | -33.8 |
Article By InvestMacro – Receive our weekly COT Reports by Email
*COT Report: The COT data, released weekly to the public each Friday, is updated through the most recent Tuesday (data is 3 days old) and shows a quick view of how large speculators or non-commercials (for-profit traders) were positioned in the futures markets.
The CFTC categorizes trader positions according to commercial hedgers (traders who use futures contracts for hedging as part of the business), non-commercials (large traders who speculate to realize trading profits) and nonreportable traders (usually small traders/speculators) as well as their open interest (contracts open in the market at time of reporting).See CFTC criteria here.

- Geopolitical and macroeconomic conditions continue to pressure market sentiment Jul 20, 2026
- USD/JPY Poised to Continue Gains as Expensive Oil and Lack of Support Weigh on Yen Jul 20, 2026
- COT Metals Charts: Weekly Speculator Bets led by Copper & Steel Jul 18, 2026
- COT Bonds Charts: Weekly Speculator Bets led by 2-Year, SOFR 3M & 5-Year Bonds Jul 18, 2026
- COT Energy Charts: Weekly Speculator Bets led by Brent Oil & Heating Oil Jul 18, 2026
- COT Soft Commodities Charts: Weekly Speculator Bets led by Wheat, Corn & Soybean Meal Jul 18, 2026
- The Bank of Canada kept its interest rate unchanged. Platinum prices reached a three‑week high Jul 16, 2026
- Stock indices rose after the release of US inflation data. China’s GDP slowed sharply Jul 15, 2026
- GBP/USD Awaits Political News: What Will Happen Next Jul 15, 2026
- USD/JPY Holds at Highs: Pressure Lingers on Yen Jul 14, 2026