The Final Act BEFORE a Housing Bubble Bursts

Here’s a time-tested indicator of trend turns in financial markets

By Elliott Wave International

Financial history shows that feverish foreign buying of a financial asset usually marks the end of that asset’s upward trend.

The reason why is that foreign buyers tend to enthusiastically jump on a trend after it’s already run its course — or nearly so.

You can find an example of this going as far back as Tulip Mania in Holland in the 1600s. But let’s stick with history which goes back just a generation or so, namely, the commercial real estate boom of the late 1980s.

Japan’s stock market had been racing higher and Japanese investors were pouring money into U.S. real estate. One of their prize purchases was Rockefeller Center in 1989. Mitsubishi paid $2 billion for this “Hope Diamond of world real estate.” By 1995, Rockefeller Center went bankrupt and Mitsubishi lost its entire investment.

Another case in point is the U.S. stock market in 2007.

The August 2007 Global Market Perspective, a monthly Elliott Wave International publication which covers 50-plus worldwide financial markets, showed this chart and said:

Foreigners jumped into the U.S. market like never before in May [2007]. The new record was a full third higher than the old one, which was set in February 2000, one month after the Dow Industrials’ 2000 peak. … The first five months of [2007] produced what was easily the biggest gusher of net foreign buying in history. The record suggests that falling prices lie directly ahead for the U.S. market.

Two months after that analysis was provided, the Dow Industrials topped, and then entered a bear market which lasted nearly a year and a half.

What does all of this have to do with today?

Get this: Chinese investors spent a record $6.1 billion on U.S. homes from April 2021 through March 2022, according to the National Association of Realtors.

Canada was second on the list — buyers there spent $5.5 billion on U.S. residential real estate. Buyers from India ranked third at $3.6 billion.

So this July Washington Post headline is not surprising:

The housing market, at last, appears to be cooling off

Here’s a quote from the Elliott Wave Theorist, a monthly publication which has provided analysis of financial markets and major cultural trends since 1979:

A burst in the U.S. housing bubble could have enormous repercussions in the world economy. The aggregate value of housing is far greater than that of the stock market, so fluctuations in house prices may have a much greater effect on consumer spending.

This was written in January 2006 — about six months before the peak in the prior housing bubble, which helped to usher in the Great Recession.

Another housing market indicator is none other than the stock market. In other words, the housing market tends to be correlated with the trend of the stock market.

Elliott wave analysis can help you anticipate what’s next for the stock market. If you need a refresher on the Elliott wave model, you are encouraged to read Frost & Prechter’s book, Elliott Wave Principle: Key to Market Behavior. Here’s a quote from this Wall Street classic:

In markets, progress ultimately takes the form of five waves of a specific structure. Three of these waves, which are labeled 1, 3 and 5, actually effect the directional movement. They are separated by two countertrend interruptions, which are labeled 2 and 4. The two interruptions are apparently a requisite for overall directional movement to occur.

You can delve deeper into the Wave Principle by reading the entire online version of the book for free!

The only requirement for free and unlimited access is a Club EWI membership, which is also free.

Club EWI is the world’s largest Elliott wave educational community and members enjoy complimentary access to a wealth of Elliott wave resources on financial markets, investing and trading without any obligations.

Simply follow the link to get started right away: Elliott Wave Principle: Key to Market Behaviorget instant access — free.

This article was syndicated by Elliott Wave International and was originally published under the headline The Final Act BEFORE a Housing Bubble Bursts. EWI is the world’s largest market forecasting firm. Its staff of full-time analysts led by Chartered Market Technician Robert Prechter provides 24-hour-a-day market analysis to institutional and private investors around the world.

What are Fibonacci Retracements? How can Traders use them for Trends Trading?

Fibonacci Retracements are a common technical analysis technique in financial trading based on a famous mathematical sequence. In this article, we touch on what Fibonacci Retracements are, what levels most traders or investors use and finally, we look at a few Fibonacci Retracements Trends Trading or Trend-following examples.


What are Fibonacci Retracements?

The Fibonacci Retracement indicator is a powerful tool that can help you make better trading decisions. It is one of the most common technical analysis techniques used for analyzing the financial markets. It is based on the Fibonacci sequence, which is a series of numbers that have a special relationship to each other. Many professional traders and analysts look to fibonacci retracements, also known as fibo levels or fib levels, to predict support and resistance price areas. Retracements can be used to detect potential turning points in price as well.

To analyze price using Fibonacci Retracements, traders will frequently look for retracement levels at 23.6%, 38.2%, 50%, and 61.8% of recent prices moves. These percentages represent possible areas of support or resistance where the price may retrace before continuing in the original direction. Traders may also use Fibonacci Retracements to identify potential price turning points by looking for reversals at these same levels.

fibonacci retracement software
 

Who was Fibonacci? What are Fibonacci Numbers?

Fibonacci was an Italian mathematician from Pisa, also known as Leonardo of Pisa, who is famous for his Fibonacci numbers, a mathematical sequence that happens to appear in many places including in nature and in statistics. Fibonacci did not invent this numeric sequence as it is believed to have originated in India. His 1202 book “Liber Abaci” introduced the sequence to Western European mathematics, and the Fibonacci sequence has been used ever since in mathematical and scientific contexts.

The Fibonacci sequence appears in nature, in the arrangement of leaves on a stem, the fruit sprouts of a pineapple, the flowering of an artichoke, an uncurling fern and the arrangement of a pine cone, as well as many other places. The Fibonacci sequence is also found in the spiral galaxies of the universe. In fact, the Fibonacci sequence can be found in everything from the smallest of organisms to the largest of structures in the cosmos.

fibonacci spiral golden ratioThe Fibonacci sequence is not just a mathematical curiosity. It has applications in engineering, computer science, biology and can be used to model or predict population growth. The Fibonacci sequence is used to generate efficient algorithms and, for our focus today, can be used to help with trading in the financial markets.

The Fibonacci sequence is actually a simple straight-forward pattern. Start with 0 and 1 and add them to get 1. Then use a pattern of adding each number to the preceding number to get the next number. Follow that pattern over and over and over again. 0 and 1 equals 1. Then add 1 and 1 to equal 2. Next, 2 and 1 equals 3 and so on. So the first fifteen Fibonacci numbers look like this: 0, 1, 1, 2, 3, 5, 8, 13, 21, 34, 55, 89, 144, 233, 377. As you can see, once you get past the first five or so numbers, they can start to really add up and they just keep on going.

There is also another notable aspect to the Fibonacci sequence that is famous as well – the golden ratio. Each of the numbers in Fibonacci sequence are approximately 1.618 larger than the preceding number. This number is considered the golden ratio and this fibonacci ratio can be found in many aspects of nature and in many mathematical, scientific and artistic constructions by humans. This golden ratio can also found in the proportions of the human body.
 

How to use Fibonacci in financial trading?

Ok, since we have a general understanding of the Fibonacci numbers, how can we use them to help in our trading? Well, to be honest, there are a lot of different ways that traders use Fibonacci numbers in financial trading, probably more than any one person could ever learn. Some use them to predict market movements, while others use them to set stop-losses or take-profits. There are those who use Fibonacci numbers for both, as well as traders who use different types of Fibonacci strategies.

trading fibonacciThe most common use for Fibonacci numbers that I see is to use them for support and resistance levels. This is where the Fibo Retracements indicator comes in. The Retracement indicator allows you to display specific levels on your chart that are derived from the Fibonacci sequence. This indicator, like most indicators, can be used in conjunction with other technical analysis tools, such as trend lines and moving averages, to help confirm trading signals.

The Fibo retracement indicator is a versatile tool that can be used by traders of all levels of experience as well. It can be very easy to use once you get the hang of it. Traders, investors and analysts of all stripes use the retracements because it allows them to specifically pinpoint areas that price may return to or bounce off of.

Retracements are extensively used in just about every major market including forex, stocks, bonds, commodities and cryptocurrencies. Fibo Retracement levels can also be used for short-term trading, day trading, swing trading or long-term trading strategies. By understanding how the indicator works and how to use it, traders can improve their chances of success in the financial markets.


How to Plot the Fibonacci Retracement Levels?

The Fibonacci Retracement tool, as the name implies, is used to identify retracement levels. A retracement is a temporary reversal in the direction of a price move. It is important to remember that Fibonacci Retracement levels are not exact. They are only potential support and resistance levels. It is also important to use other technical indicators to confirm whether a retracement is likely to occur.

The most frequent and most popular Fibonacci levels that are used on most technical indicators are at 0.00%, 23.6%, 38.2%, 50.0%, 61.8%, 76.4% and 100%.

To begin using Fibonacci Retracements, you will first have to add the indicator to your charting platform or trading software. Most modern trading platforms will have a built-in Fibonacci Retracement tool or indicator and trading education content that explains how to use it. The correct retracement tool also may be found under Fibonacci Strategies, depending on your platform or software.

fibonacci find the low and high levels

In the chart above, we have started our retracement from the recent low and extended it to the recent high. This was an up-trending market, so the 1.00 or 100% level is on the bottom and the 0% level is at the top. In this time-frame, price has retraced to the 61.8% level and resumed an up-trend.

Find the Recent High and Recent Low

When you find the Fibonacci Retracement tool or indicator, you will have to find a swing high and a swing low to start your analysis. Choose the highest high and the lowest low over a certain time-frame you would like to trade. Potentially on a daily chart, you could choose prices from the past month, two months or more to analyze.

If you are analyzing a down-trending market, take your indicator and drag it from the most recent highest high to the most recent lowest low. After doing this, you should see the 1.000 (or 100%) retracement level at the top and the 0.00% retracement level at the bottom. In between, you will see the 23.6, 38.2, 50.0, 61.8 and the 76.4 fib levels as well.

If you are analyzing an up-trending market, you will see the exact opposite where 100% is at the bottom and 0.00% is at the top. This will make sense if you think about it. If price at bottom is 100% and the 0% is at top and then if price drops all the way back down from 0% to the 100% level, then price has “retraced” 100% of its previous uptrend move (and the opposite for downtrends).


Using Fibonacci Retracements for Trend Following or Trend Trading Strategies

Now that you have the Retracement Indicator on your chart, let’s start to understand how to use it. One of the best ways to utilize Fibonacci Retracements for trading, in my opinion, is to jump on an established trend. I think this is the easiest way to use Fibos and the Retracements are the perfect tool for this type of trend following execution. You can hopefully get in on a strong trend and profit without having to spot the trade before everyone else does. Let’s look at what trends are and why would we want to trade trends.

Beginners: What are Trends and Why Trade them?

When it comes to trading, there are different approaches that can be taken in order to make a profit. Some traders focus on technical analysis and try to identify patterns in order to predict future price movements. Others focus on fundamental analysis and look at factors such as economic indicators in order to make trading decisions. And then there are those who focus on trends. In my opinion, the best types of trades combine multiple types of analysis that put the odds in a trader’s favor.

Trend trading, also known as momentum trading or trend following, is a strategy that involves buying assets that are rising in price and selling them when they start to fall or when the trend is exhausted. The idea is to ride the wave of a trend and make profits along the way. Traders who follow this strategy are commonly referred to as “trend followers.” Once a trend has identified a trend, traders will need to decide when to buy and when to sell. This decision will be based on a number of factors, including the trader’s risk tolerance and their time horizon.

It’s important to note that trend trading is not without its risks and there are a few things that trend traders need to be aware of. The first is that trends don’t last forever. Trends can reverse and when this happens, traders can find themselves on the wrong side of the trade. There will be times when the price of an asset starts to fall after it has been rising for some time. It’s important to have a exit strategy in place so that you can sell before the trend reverses. Another thing to keep in mind is that not all trends are created equal. Some trends are stronger than others and last longer. These are the trends that you want to focus on.


A Fibonacci Forex Retracement Trading Example: The Trend Pullback

As a general rule, if the market is in an uptrend and you believe it will continue, then you will want to look for opportunities to buy on the price pullback at the 23.6% or the 38.2% retracement levels. Depending on what the trend looks like (early trend, late trend?) and if you have other fundamental information that makes you feel the trend will continue (how strong are the fundamental factors?), this could include the 50.0% and the 61.8% retracement levels as well.

An Example: See this classic setup in the USD/JPY currency pair on the daily chart.

When the US Dollar strength against the Japanese yen pushed a USDJPY breakout above 116.35 in March of 2022, the bull trend was on in a strong way. Fundamental forces for this market included rising inflation, stronger bond yields for the USA versus Japan and the fact that the US Federal Reserve was sharply raising its benchmark interest rate while the Bank of Japan was standing pat and still had accommodating economic policies while most other central banks were going the other way.

Depending on when you noticed this trend and the underlying fundamental picture, you could have tried to jump on this strong trading action a few different times. However, perhaps the best method would have been using the Fibonacci Retracement in mid-to-late May 2022 with a buy order around the 23.6% retracement level (already acting as support a few times by mid-May). A stop-loss order to be placed at the 38.2% retracement or just below that psychological support level of 125.00.

Daily Chart: USDJPY


This trend reversed a little below the 23.6% retracement level, bounced up and kept going higher as the interest rate differential and central bank policies continued to diverge in favor of the US. Ultimately, the trend rose to a 20-year high for the USDJPY currency pair. This was above and beyond our Fibonacci Retracement Indicator that we placed on the chart (above 0 and going). The currency pair remains in an uptrend as of August 2022.


A Stock Market Trading Example: Trend Reversal with RSI Divergence

This next trade setup is more near and dear to my heart because I love RSI Divergence! It is a setup that happens in all markets from time to time and is very easy to see if you are looking for it. I will say that it is a setup that is much rarer (for good reason) than others like say a moving average crossover or a MACD signal. I see the RSI Divergence as a trend exhaustion indicator that signals the “possibility” of an imminent trend change (look for confirming factors, either sentiment or fundamentals as well). I also like to use the RSI Divergence on the weekly charts as I find it the most reliable but it does happen on all time frames.

What is a divergence? A divergence is the difference in price between two similar acting assets or in this case, between an indicator and price that usually go in the same direction. It is important because it can be used to signal a change in market conditions.

One thing of note on the chart below is – I am using a RSI smoothed average (red line – 3 periods) of the regular RSI (which is the skinny light line). This is just my preference as I like it better than just the basic RSI.

For some context, this first half of the year in 2022 had been a tough one for stocks. The overall narrative is that stocks are going down and going to keep going down as far as the eye can see. Inflation! Bond yields to the moon! Crypto death! Technology stocks are dead! Worst Recession in History Coming! These are some of the headlines I feel were being screamed at market watchers since January. Some may eventually come true but many are probably over-hyped and sensationalized.

The SPY peaked in January 2022 around the 480.00 price level and started on a its downward path. US Treasury bonds were dropping as well with inflation rising and the Federal Reserve raising the benchmark interest rate to combat that inflation. The 10-Year bonds yields were popping (yields move in opposite of bond prices) and hit a multi-year high in June 2022 right near the 3.50% level. Then a funny thing happened, both the SPY and 10-Year yields trends stalled out over the next bunch of weeks (both markets exhibited RSI Divergences).

Here is recent setup that happened in the S&P 500 ETF (SPY)

Weekly Chart: SPY


Using the Retracement Indicator from the high point (January 2022 recent peak) to the June low point (where price hit and then bounced around above this for the next four weeks while the RSI turned higher). Here we are looking for the opposite of our prior Forex example and hope to use the 23.6% key level as a launching point. Instead of betting on a trend continuation, we are using the RSI Divergence to indicate a trend exhaustion with the hopes that the trend is reversing.

As you can see from the chart, so far so good. The exiting point for this trade is a personal choice, but with prices rising, there are multiple fibo lines that could be used as exits as well as the 50-week moving average residing up ahead. This current setup could possibly be just a blip on a larger downtrend to come but hopefully illustrates a tactic to trade a trend reversal with the help of the RSI.

Fibonacci Trading Conclusion:

I hope this article has helped to give some perspective and examples on using the Fibonacci Retracement Indicator in the markets. Hopefully it will further your education and give you another good trading tool in your arsenal. I have found in my own trading that the best way to use this Fibonacci tool is in conjunction with different trading strategies, technical indicators, fundamental indicators and sentiment indicators. I feel it is best to utilize all different types of analysis that will give me unique clues to what is or what could be happening in the market. Overall, the Retracement Indicator is a valuable tool for technical analysts and is so popular for a reason – once you get the hang of it, it can be an easy addition to your trading toolkit.


Article by Taylor Wilman for InvestMacro

ETFs That Track Retail Investing Trends

By Ino.com

– Over the past few years, retail investors have shown they have the power (money) to take stock prices to ‘the moon’ if they operate as a group.

Last year it was GameStop (GME) and AMC (AMC).

Just a few weeks ago, it was AMTD Digital Inc (HKD), which was IPO’d in July and has had a trading range of $13.52 per share up to $2,555.30 per share since the initial public offer. HKD is currently trading in the low $200 range.

But just because retail investors can do something, does that mean they should? Are the retail crowd good stock pickers? And should you follow their lead?

At this time, we don’t know the answer to these questions. That is because we don’t have enough data on whether or not retail investors operating as a whole are good stock pickers. They have only really been flexing their muscle for a little more than a year.

Plus, when they started with GME and AMC, we were still in a bull market. But now, we are in a bear market. So it would be unfair to say the retail investor’s recent performance shows their lack of sophistication and that they don’t belong picking stocks.

A few Exchange Traded Funds track what retail investors are talking about on social media or buying in their brokerage accounts, and as of late, retail investor stock picks are not outperforming the market.

The VanEck Social Sentiment ETF (BUZZ), which tracks the top 75 companies with the most popular sentiment online based on a proprietary AI model to select stocks, is down 32% year-to-date.

The SoFi Social 50 ETF (SFYF), which tracks the 50 most widely held stocks in self-directed brokerage accounts of Sofi Securities, is down 25.55% year-to-date.

And the FOMO ETF (FOMO), which invests in the areas of the market that are currently in favor with retail and individual investors or currently ‘trending,’ is down 17.94% year-to-date.

For comparison, a few ETFs that are either managed by professional stock pickers or track the performance of hedge funds are also having a tough year.

The Motley Fool 100 Index ETF (TMFC), which invests in the top 100 stocks selected by Motley Fool analysts, is down 17.64% year-to-date.

The Global X Guru Index ETF (GURU), the Goldman Sachs Hedge Industry VIP ETF (GVIP), and the AlphaClone Alternative Alpha ETF (ALFA), all of which track and mimic the holdings of hedge funds; have produced negative year-to-date returns of 23.22%, 22.90%, and 21.66% respectively.

The performance of these professionally run ETFs shows that even the pros, who are getting paid millions to manage other people’s money, are, as a whole, performing just as poorly as the retail investors.

The S&P 500 is what many consider the ‘market,’ and the QQQ comprises the top 100 technology stocks on the NASDAQ.

However, the SPDR S&P 500 ETF (SPY) is down 12.09% year-to-date, while the Invesco QQQ ETF (QQQ) is down 18.59%. So these are great examples of alternative ETF investments investors could buy as opposed to BUZZ, SFYF, or FOMO.

Furthermore, based on the QQQ’s performance, there is an argument that it’s not that retail investors are poor at picking stocks but that technology stocks, which represent a large portion of the retail investor-focused ETFs, are having an overwhelmingly lousy year.

The performance of the S&P 500 in 2022 highlights the old argument that stock picking is not worth the time or energy professionals or retail investors dedicate to it.

But again, we are only eight months into the year, which is a tiny snapshot of time for long-term investors. And much of which has been during a bear market.

Historical data (Warren Buffett, Peter Lynch, Carl Icahn, Bill Miller) has shown that some investors can beat the market, and maybe the next great generational investor will come from the retail side, not Wall Street.

Regardless, investors interested in what other retail investors are buying and discussing on message boards may find BUZZ, SFYF, or FOMO attractive since they take the work out of tracking what other investors like and dislike.

My only suggestion would be to make one of these ETFs a small percentage of your total portfolio. The bulk of your portfolio should be in one of the S&P 500, NASDAQ, or other major index-focused ETFs.

Matt Thalman
INO.com Contributor
Follow me on Twitter @mthalman5513

Disclosure: This contributor did not hold a position in any investment mentioned above at the time this blog post was published. This article is the opinion of the contributor themselves. The above is a matter of opinion provided for general information purposes only and is not intended as investment advice. This contributor is not receiving compensation (other than from INO.com) for their opinion.

By Ino.com – See our Trader Blog, INO TV Free & Market Analysis Alerts

Source: ETFs That Track Retail Investing Trends

Mid-Week Technical Outlook: Pound Crosses In Focus

By ForexTime 

Sterling hijacked our attention on Wednesday after official data revealed that UK inflation hit double digits for the first time in 40 years!

Consumer prices rose 10.1% in July from a year ago after a 9.4% gain in June. This was the highest reading since February 1982 as prices rose for food, housing & utilities and alcoholic beverages among other products/services. Although this red-hot CPI report will reinforce expectations over the BoE aggressively raising interest rates, it will also create more uncertainty over the UK’s economic outlook.

We saw the Pound appreciate against most G10 currencies following the report as BoE rate hike bets jumped.

GBPUSD remains in wide range

The GBPUSD remains in a wide range despite the red-hot inflation figures. Support can be found at 1.2000 and resistance around 1.2155. A solid break under 1.2000 may open the doors towards 1.1900 and lower. Alternatively, a strong breakout above 1.2155 could spark a move towards 1.2250 and 1.2350.

GBPJPY set to push higher?

It has been a roller coaster ride on the GBPJPY. Prices have been volatile, choppy and all over the place. Prices are back above the 100-day Simple Moving Average and slowing approaching 164.00. A strong move above 164.00 signal an incline towards 166.00. If bears are able to pull the GBPJPY back below 162.00, the next level of interest cant be found at 160.00.

EURGBP in downtrend

The EURGBP remains in a bearish trend as there have been consistently lower lows and lower highs. Prices are trading below the 50,100 and 200-day Simple Moving Average while the MACD trades below zero. Sustained weakness below 0.8440 could encourage a selloff towards 0.8340. A breakout above 0.8440 is likely to encourage bulls to target 0.8500.

GBPAUD heading into resistance?

Pound bulls seem to be gaining momentum on the GBPAUD with prices pushing towards the 50-day Simple Moving Average. There could be some resistance here as the 100-day SMA resides just above. If these two obstacles can be cleared, prices may test the 1.7650 level and 1.7800, respectively. Should bulls tire and prices sink back below 1.7300, the next key point can be found at 1.7000.


Forex-Time-LogoArticle by ForexTime

ForexTime Ltd (FXTM) is an award winning international online forex broker regulated by CySEC 185/12 www.forextime.com


Murrey Math Lines 17.08.2022 (USDJPY, USDCAD)

Article By RoboForex.com

USDJPY, “US Dollar vs. Japanese Yen”

As we can see in the H4 chart, USDJPY is trading below the 200-day Moving Average to indicate a descending tendency. In this case, the price is expected to test the support at 5/8, break it, and then continue falling and reach 4/8. However, this scenario may no longer be valid if the price breaks the resistance at 6/8 to the upside. After that, the instrument may reverse and grow towards 7/8.

USDJPYH4
Risk Warning: the result of previous trading operations do not guarantee the same results in the future

In the M15 chart, the pair may break the downside line of the VoltyChannel indicator and, as a result, continue its decline.

USDJPY_M15
Risk Warning: the result of previous trading operations do not guarantee the same results in the future

USDCAD, “US Dollar vs Canadian Dollar”

In the H4 chart, after breaking the 200-day Moving Average, USDCAD is trading below it, thus indicating a possible descending tendency. In this case, the price is expected to break 2/8 and continue falling towards the support at 1/8. On the other hand, this scenario may no longer be valid if the pair breaks the resistance at 3/8 to the upside. After that, the instrument may reverse and grow to reach 5/8.

USDCAD_H4
Risk Warning: the result of previous trading operations do not guarantee the same results in the future

As we can see in the M15 chart, the pair has broken the downside line of the VoltyChannel indicator and, as a result, may continue trading downwards.

USDCAD_M15

Article By RoboForex.com

Attention!
Forecasts presented in this section only reflect the author’s private opinion and should not be considered as guidance for trading. RoboForex LP bears no responsibility for trading results based on trading recommendations described in these analytical reviews.

The cryptocurrency market digest (BTC). Overview for 17.08.2022

Article By RoboForex.com

The BTC is slowly falling. On Wednesday, the major crypto is moving to $23,832.

At the same time, the US stock market, which has a direct correlation with the BTC, continued rising yesterday, and the S&P 500 index even updated its highs. Why can’t the crypto market catch up with American exchanges? Probably, it’s because investors don’t believe in a stable growth of indices in the light of rate hikes.

In this context, today’s going to be a very interesting day. The US Fed is scheduled to release its Meeting Minutes. Market players will surely look through the document trying to find any hints at some kind of a slowdown in aggressive rate hikes now that the CPI has stopped skyrocketing. If there are such hints, the US stock market may rise with a vengeance, and the crypto market will follow.

From the technical point of view, there is an important resistance area for the BTC right now, $24,300-$24,500. If the asset breaks it, the price may continue growing to reach $26,000.

Coinbase will cooperate with BlackRock

Crypto exchange Coinbase entered into a partnership with investment management corporation BlackRock Inc. BlackRock retail and institutional investors will now have the chance to manage and trade cryptos in the Coinbase Prime platform.

Tornado Cash is banned in the US

The US Department of Treasury banned the popular cryptocurrency mixer Tornado Cash. The Office of Foreign Assets Control added the company to its sanction list.

Article By RoboForex.com

Attention!
Forecasts presented in this section only reflect the author’s private opinion and should not be considered as guidance for trading. RoboForex LP bears no responsibility for trading results based on trading recommendations described in these analytical reviews.

The Analytical Overview of the Main Currency Pairs on 2022.08.17

By JustForex

The EUR/USD currency pair

Technical indicators of the currency pair:
  • Prev Open: 1.0159
  • Prev Close: 1.0170
  • % chg. over the last day: +0.11%

Investors will be closely watching the FOMC minutes today, looking for new signals on how much a rate hike could come in September. Currently, federal funds futures traders are estimating a 60% chance of a 50 basis point hike and a 40% chance of a 75 basis point hike. The US Retail Sales data will also provide new insight into the condition of consumers. Sales are expected to rise 0.1% in July compared to June. Eurozone GDP for the quarter should also be on the list. Analysts expect the region’s economy to show 0.7% growth, which will be the last this year.

Trading recommendations
  • Support levels: 1.0136, 1.0112, 1.0035, 1.0000
  • Resistance levels: 1.0185, 1.0230, 1.0286, 1.0365, 1.0415, 1.050

From the technical point of view, the trend on the EUR/USD currency pair on the hourly time frame has changed to bearish. The price confidently broke through the priority change level and consolidated below the moving averages. The price is now trading in a narrow range ahead of the FOMC minutes. Under such market conditions, buy trades are best sought on intraday time frames from the support level of 1.0136, but with confirmation in the form of a reverse initiative. Sell trades can be considered from resistance levels of 1.0185 or 1.0230, but only after the additional confirmation.

Alternative scenario: if the price breaks out of the 1.0286 resistance level and fixes above, the uptrend will likely resume.

EUR/USD
News feed for 2022.08.17:
  • – Eurozone GDP (q/q) at 12:00 (GMT+3);
  • – US Retail Sales (m/m) at 15:30 (GMT+3);
  • – US FOMC Member Brainard Speaks at 16:30 (GMT+3);
  • – US FOMC Meeting Minutes (m/m) at 21:00 (GMT+3);
  • – US FOMC Member Bowman Speaks at 21:20 (GMT+3).

The GBP/USD currency pair

Technical indicators of the currency pair:
  • Prev Open: 1.2051
  • Prev Close: 1.2097
  • % chg. over the last day: +0.38%

British economists see a growing risk of recession due to a spike in inflation. Today’s inflation report may show an annualized rate of 9.8%, which is not yet the tip of the iceberg. A sub-par rate hike announced on August 4 is expected to be followed by a similar hike in September as policy makers struggle with double-digit inflation. A subsequent quarter-point hike in November would raise the Bank of England benchmark rate to 2.5%, above the previously projected peak of 2%. But there is also a high probability that the UK will avoid a recession: a slight slowdown in the fourth quarter may change to stagnation in the first months of 2023 and then resume modest growth. However, the risks of a recession are growing. The probability of recession is currently estimated at 75%.

Trading recommendations
  • Support levels: 1.2059, 1.2028, 1.2000
  • Resistance levels: 1.2167, 1.2215, 1.2294

From the technical point of view, the trend on the GBP/USD currency pair on the hourly time frame is bearish. The price is now trading at the levels of the moving averages. The MACD indicator has become positive, but buyer pressure is weak. It is best to look for sell trades from the resistance level of 1.2167, but only after the additional confirmation. Buy trades can be considered on intraday time frames from the support levels of 1.2059 or 1.2028, but only with confirmation.

Alternative scenario: if the price breaks out through the 1.2215 resistance level and fixes above, the uptrend will likely resume.

GBP/USD
News feed for 2022.08.17:
  • – UK Consumer Price Index (m/m) at 09:00 (GMT+3).

The USD/JPY currency pair

Technical indicators of the currency pair:
  • Prev Open: 133.33
  • Prev Close: 134.23
  • % chg. over the last day: +0.67%

The Japanese currency, which is affected by the difference between interest rates in the United States and Japan, rose last week on expectations that lower US inflation would mean less aggressive Fed tightening and therefore lower US yields. However, several Fed policymakers have recently been discussing the need for further rate hikes, so USD/JPY quotes are rising again. Fundamentally, no change in the monetary policy of either country is imminent at the moment.

Trading recommendations
  • Support levels: 133.47, 132.27, 131.08, 130.85
  • Resistance levels: 134.36, 136.02, 137.12

From the technical point of view, the medium-term trend on the currency pair USD/JPY is still bullish. The price has formed an accumulation zone above the 134.36 level and has now come to test this zone. But the sellers’ reaction is weak, so the price will likely continue to increase after a small pullback. Under such market conditions, buy trades can be sought from the support level of 133.47, but with additional confirmation. For sell deals, it is possible to consider the resistance level of 134.36. Still, only with additional confirmation in the form of a reverse initiative, as fundamentally, USD/JPY quotes are inclined to grow.

Alternative scenario: If the price fixes below 131.37, the downtrend will likely resume.

USD/JPY
There is no news feed for today.

The USD/CAD currency pair

Technical indicators of the currency pair:
  • Prev Open: 1.2902
  • Prev Close: 1.2842
  • % chg. over the last day: -0.47%

Canada’s Consumer Price Index for July was 7.6% y/y (forecast 7.6%), down from June’s 8.1% y/y. The core CPI was 6.1% y/y against expectations of 6.1% and 6.2% in June. Canada’s inflation is slowing, and consumer prices will likely have peaked. At the Bank of Canada’s last interest rate meeting on July 13, the Bank of Canada raised the rate by 100 bps to 2.5%, noting that inflation will remain around 8% for the next few months. The Canadian dollar has unexpectedly strengthened on inflation data, though usually, the reaction to such news is accompanied by a weakening of the national currency on expectations that the central bank will behave less aggressively. The next meeting of the Bank of Canada will be held on September 7.

Trading recommendations
  • Support levels: 1.2817, 1.2761
  • Resistance levels: 1.2903, 1.2927, 1.2965

From the point of view of technical analysis, the trend on the USD/CAD currency pair has changed to bullish. Now the price has corrected to the average value. Indicator MACD has become negative, but sellers’ pressure is weak. Under such market conditions, buy trades should be considered on the lower time frames from the support level of 1.2817 or 1.2761, but only with confirmation. It is better to consider the resistance level of 1.2903, but also with confirmation.

Alternative scenario: if the price breaks down and consolidates below the 1.2761 support level, the downtrend will likely resume.

USD/CAD
News feed for 2022.08.17:
  • – US Crude Oil Reserves (w/w) at 17:30 (GMT+3).

By JustForex


This article reflects a personal opinion and should not be interpreted as an investment advice, and/or offer, and/or a persistent request for carrying out financial transactions, and/or a guarantee, and/or a forecast of future events.

The Reserve Bank of New Zealand continues to raise rates aggressively. Inflation in Canada has peaked

By JustForex

The US Industrial Production for July reports a 0.6% month-over-month increase compared to the consensus forecast of 0.3%. This report provides more evidence that Q3 GDP should be good, but the outlook for Q4 looks tougher. The NY Empire manufacturing survey was weak on Monday and pointed to low year-end orders and activity. There are also growing problems with the real estate sector. The US housing starts fell by 9.6% m/m in July to an annualized rate of 1.446k compared to the consensus forecast of 1.527k. This is the weakest level since February 2021.

The US stock indices traded yesterday without a single trend. At Monday’s close, the Dow Jones Index (US30) added 0.71%, while the S&P 500 Index (US500) increased by 0.19%. The NASDAQ Technology Index (US100) lost 0.19%.

Inflation in Canada is down slightly but remains too high. Canada’s Consumer Price Index for July was 7.6% y/y (forecast 7.6%), down from June’s 8.1% y/y. The Core Consumer Price Index was 6.1% y/y versus expectations of 6.1% and 6.2% in June. The good news is that inflation appears to have peaked. The bad news is that inflation will likely remain too high for a while. In his speech, the Governor of the Bank of Canada pointed out that to combat inflation, the Bank needs to bring overall economic demand more in balance with supply. The Bank of Canada’s current goal is to cool the economy enough to bring inflation back to its target of 2%. Therefore, the Bank of Canada will seek to slow demand growth. This is what is called a soft landing. By drastically raising interest rates now, the Bank of Canada is trying to avoid the need for even higher interest rates and a sharper slowdown later.

Equity markets in Europe mostly rose yesterday. Germany’s DAX (DE30) gained 0.68% on Tuesday, France’s CAC 40 (FR40) gained 0.34%, Spain’s IBEX 35 (ES35) added 1.01%, Britain’s FTSE 100 (UK100) closed up by 0.36%.

On Tuesday, Germany secured a commitment from major gas importers to ensure that two floating liquefied natural gas (LNG) terminals are fully supplied this winter to reduce dependence on Russian fuel. Analysts expect a worst-case scenario for Europe this winter, which is why the US dollar remains so strong.

The latest UK labor market data for April-June 2022 showed a slight drop in the employment rate, and a slight increase in the unemployment rate, with the economic inactivity rate unchanged.

Oil hit a 6-month low as a potential deal with Iran scares oil investors. West Texas Intermediate, the US benchmark, was down by $2.88, or 3.2%. Brent, a London-listed global benchmark, decreased by $2.76, or 2.9%.

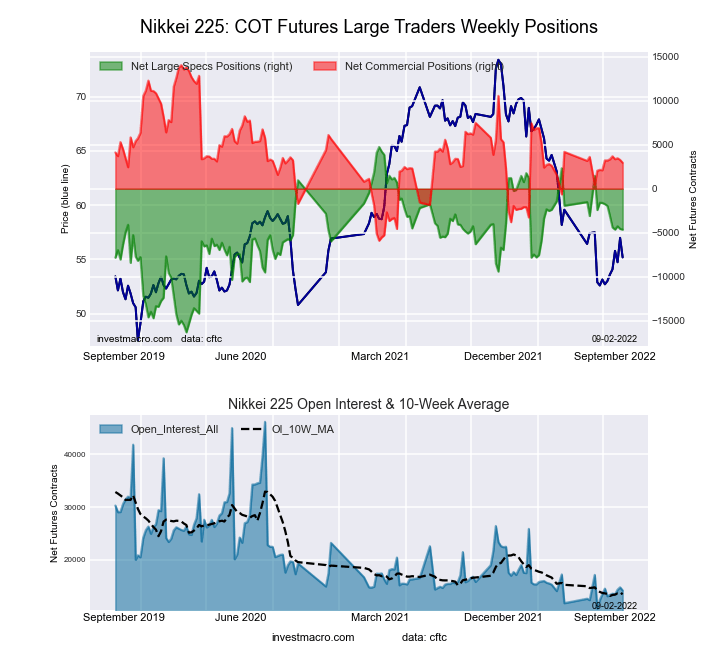
Asian markets traded flat yesterday. Japan’s Nikkei 225 (JP225) decreased by 0.01%, Hong Kong’s Hang Seng (HK50) lost 1.05%, and Australia’s S&P/ASX 200 (AU200) was up by 0.58%.

Japan’s trade deficit hit a record high in July as the impact of soaring commodity prices and a 24-year low in the yen exacerbated the obstacles to the country’s economic recovery. Because of its dependence on energy and food from abroad, Japan has faced sharply higher import costs amid the war in Ukraine and supply problems related to quarantine in China. The Finance Ministry said Wednesday that the trade deficit widened to 2.13 trillion yen ($15.9 billion). The trade balance has been in negative territory since 2015.

Minutes from the Reserve Bank of Australia’s (RBA) August policy meeting on Tuesday showed that Australia’s Central Bank still sees the need to raise interest rates further to prevent high inflation from locking in expectations.

The Reserve Bank of New Zealand raised its key interest rate by another half a percent to 3% and expected it to rise to at least 4%. New Zealand’s rate hike in the last ten months is the most aggressive tightening cycle in 30 years. Updated RBNZ forecasts on Wednesday showed that OCR will peak at 4.1% in the second quarter of 2023, compared with a May estimate of 3.95% in the third quarter of that year. Goldman Sachs Group Inc. sees a 30-35% chance of a recession in New Zealand over the next 12 months. In their view, the RBNZ is putting the brakes on too much, squeezing the housing market, and reducing consumer spending.

S&P 500 (F) (US500) 4,305.20 +8.06 (+0.19%)

Dow Jones (US30) 34,152.01 +239.57 (+0.71%)

DAX (DE40) 13,910.12 +93.51 (+0.68%)

FTSE 100 (UK100) 7,536.06 +26.91 (+0.36%)

USD Index 106.47 -0.08 (-0.07%)

Important events for today:
  • – Australia Wage Price Index (q/q) at 04:30 (GMT+3);
  • – New Zealand RBNZ Interest Rate Decision (m/m) at 05:00 (GMT+3);
  • – New Zealand RBNZ Monetary Policy Statement (m/m) at 05:00 (GMT+3);
  • – New Zealand RBNZ Press Conference at 06:00 (GMT+3);
  • – UK Consumer Price Index (m/m) at 09:00 (GMT+3);
  • – Eurozone GDP (q/q) at 12:00 (GMT+3);
  • – US Retail Sales (m/m) at 15:30 (GMT+3);
  • – US FOMC Member Brainard Speaks at 16:30 (GMT+3);
  • – US Crude Oil Reserves (w/w) at 17:30 (GMT+3);
  • – US FOMC Meeting Minutes (m/m) at 21:00 (GMT+3);
  • – US FOMC Member Bowman Speaks at 21:20 (GMT+3).

By JustForex


This article reflects a personal opinion and should not be interpreted as an investment advice, and/or offer, and/or a persistent request for carrying out financial transactions, and/or a guarantee, and/or a forecast of future events.

Ichimoku Cloud Analysis 16.08.2022 (GBPUSD, XAUUSD, USDCAD)

Article By RoboForex.com

GBPUSD, “Great Britain Pound vs US Dollar”

GBPUSD is no longer trading within the bullish channel. The instrument is currently moving below Ichimoku Cloud, thus indicating a descending tendency. The markets could indicate that the price may test the cloud’s downside border at 1.2115 and then resume moving downwards to reach 1.1775. Another signal in favour of a further downtrend will be a rebound from the rising channel’s downside border. However, the bearish scenario may no longer be valid if the price breaks the cloud’s upside border and fixes above 1.2235. In this case, the pair may continue growing towards 1.2325. To confirm a further downtrend, the price must break the downside border of a Double Top reversal pattern and fix below 1.1980.

GBPUSD
Risk Warning: the result of previous trading operations do not guarantee the same results in the future

XAUUSD, “Gold vs US Dollar”

XAUUSD is rebounding from the bullish channel’s downside border. The instrument is currently moving inside Ichimoku Cloud, thus indicating a sideways tendency. The markets could indicate that the price may test the cloud’s upside border at 1785.00 and then resume moving downwards to reach 1715.00. Another signal in favour of a further downtrend will be a rebound from the rising channel’s downside border. However, the bearish scenario may no longer be valid if the price breaks the cloud’s upside border and fixes above 1805.00. In this case, the pair may continue growing towards 1835.00.

XAUUSD
Risk Warning: the result of previous trading operations do not guarantee the same results in the future

USDCAD, “US Dollar vs Canadian Dollar”

USDCAD is testing the cloud’s upside border. The instrument is currently moving above Ichimoku Cloud, thus indicating an ascending tendency. The markets could indicate that the price may test the cloud’s downside border at 1.2820 and then resume moving upwards to reach 1.3150. Another signal in favour of a further uptrend will be a rebound from the downside border of an Inverted Head & Shoulders reversal pattern. However, the bullish scenario may no longer be valid if the price breaks the cloud’s downside border and fixes below 1.2745. In this case, the pair may continue falling towards 1.2655. To confirm a further uptrend, the price must break the bearish channel’s upside border and fix above 1.2965, thus completing the above-mentioned pattern.

USDCAD

Article By RoboForex.com

Attention!
Forecasts presented in this section only reflect the author’s private opinion and should not be considered as guidance for trading. RoboForex LP bears no responsibility for trading results based on trading recommendations described in these analytical reviews.

Gold And Silver: Is It A Trap?

By Ino.com

Back in June, I shared with you an alternative scenario for gold with a downside trigger on the trendline support.

I highlighted it with a purple color in the weekly gold futures chart below. This area is fortified with the red horizontal trendline based on the former valley of $1,678. Though, it’s a double support level.

Gold Futures Weekly

Source: TradingView
 

It is amazing how accurately the price bounced off that strong support. The metal took its chance to jump to the upside amid the falling yield of 10-year U.S. government bonds (10Y).

The easing inflation data limits the hawkish expectations on the Fed rate hikes. Though, the 10Y’s advance has been paused as the market took some gains amid uncertainty.

However, the real interest rate is still strongly negative at -6%. The labor market shows vitality according to statistics. This leaves the room for the Fed to keep tightening until something breaks down.

The 10Y bounced off recently from 2.6% to 2.85% and nobody knows if it’s a continuation or a consolidation.

The gold market has been trapped with the whole uncertainty as it has built a large sideways consolidation since August 2020.

As long as the gold futures price keeps both above the former valley of $1,678 and the trendline support there is a chance to see the retest of the all-time high of $2,089.

For a bullish setup, the price should chart the minor correction that should not drop below the recent valley followed by the breakup of the most recent minor top as shown with the blue zigzag.

The RSI is close to the neutral area and it should move above the “waterline” of 50 to support a further advance of the price.

Such a large consolidation could bring a hope for gold bulls for a really big gain, as size matters! The longer it takes the market to digest the uncertainty, the stronger will be the new base for a new launch of the price to the upside.

Let us watch to see if the price will keep its grip above current support otherwise it would be a trap.


Silver Futures Weekly

Source: TradingView
 

The silver chart was so bullish and so clean in my earlier update this March.

Much to the regret of silver bugs, the price couldn’t overcome the top of a junction at the confirmation level and then it rapidly lost its shine and a glory.

The drop in the second red leg down was sharper as was the Fed with a tightening. I relocated the labels of the red legs down as the structure got clearer over time. This is the tricky nature of corrections.

The silver futures have an ideal reaction on the chart. The volume profile has shown an amazingly accurate support in the second largest volume zone in the $18 area. The price bounced off right there. The 61.8% Fibonacci retracement is also here. The last valuable measurement is the size of red leg 2 compared to red leg 1 – the former is longer than the latter and that is a sign of sufficiency.
The most of you didn’t buy the target of $80 based on the giant Cup & Handle pattern and preferred the conservative targets within $40-$50 range.
Bulls should push the price above the nearest barrier of $22.6 first to overcome the volume gap pit where the silver futures price is now.
The RSI must break above the neutral level above 50. The final confirmation is located at the apex of the junction at $27.5. The new target based on a lower C point is located at $36.7.

The trap could evolve if the silver futures price drops below the most recent valley of $18.

Intelligent trades!

Aibek Burabayev
INO.com Contributor

Disclosure: This contributor has no positions in any stocks mentioned in this article. This article is the opinion of the contributor themselves. The above is a matter of opinion provided for general information purposes only and is not intended as investment advice. This contributor is not receiving compensation (other than from INO.com) for their opinion.

By Ino.com – See our Trader Blog, INO TV Free & Market Analysis Alerts

Source: Gold And Silver: Is It A Trap?