
By InvestMacro | COT | Data Tables | COT Leaders | Downloads | COT Newsletter
Here are the latest charts and statistics for the Commitment of Traders (COT) data published by the Commodities Futures Trading Commission (CFTC).
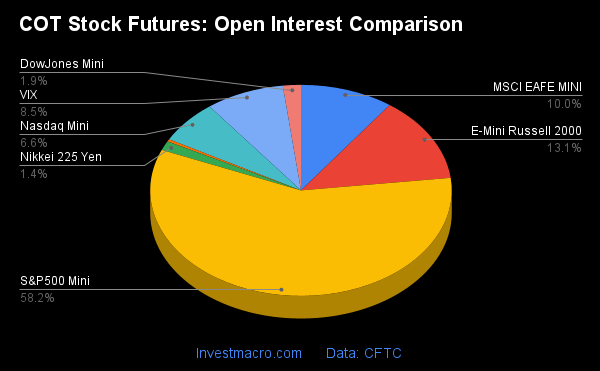
The latest COT data is updated through Tuesday August 30th (COT Week 35) and shows a quick view of how large traders (for-profit speculators and commercial entities) were positioned in the futures markets.
S&P500 Mini, VIX & EAFE Mini lead the Weekly Speculator Changes
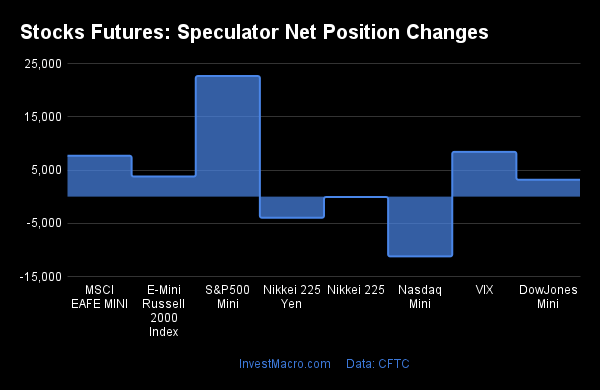
COT stock market speculator bets were mostly higher this week as five out of the seven stock markets we cover had higher positioning this week while the other two markets had lower contracts.
Leading the gains for stock markets was S&P500 Mini (22,644 contracts) with the VIX (8,410 contracts), MSCI EAFE Mini (7,680 contracts), Russell 2000 Mini (3,774 contracts) and the Dow Jones Industrial Average Mini (3,174 contracts) also showing a positive weeks.
Free Reports:
 Get our Weekly Commitment of Traders Reports - See where the biggest traders (Hedge Funds and Commercial Hedgers) are positioned in the futures markets on a weekly basis.
 Download Our Metatrader 4 Indicators – Put Our Free MetaTrader 4 Custom Indicators on your charts when you join our Weekly Newsletter
The stock markets leading the declines in speculator bets this week was the Nasdaq Mini (-11,226 contracts) with Nikkei 225 USD (-78 contracts), also registering lower bets on the week.
| Aug-30-2022 | OI | OI-Index | Spec-Net | Spec-Index | Com-Net | COM-Index | Smalls-Net | Smalls-Index |
|---|---|---|---|---|---|---|---|---|
| S&P500-Mini | 2,329,953 | 9 | -239,632 | 12 | 311,815 | 94 | -72,183 | 11 |
| Nikkei 225 | 14,151 | 10 | -4,641 | 55 | 2,949 | 44 | 1,692 | 50 |
| Nasdaq-Mini | 263,641 | 50 | 26,807 | 90 | -2,850 | 25 | -23,957 | 0 |
| DowJones-Mini | 77,430 | 38 | -1,420 | 36 | 3,027 | 63 | -1,607 | 30 |
| VIX | 338,590 | 38 | -97,935 | 60 | 101,485 | 39 | -3,550 | 74 |
| Nikkei 225 Yen | 56,933 | 39 | -319 | 33 | 19,462 | 78 | -19,143 | 35 |
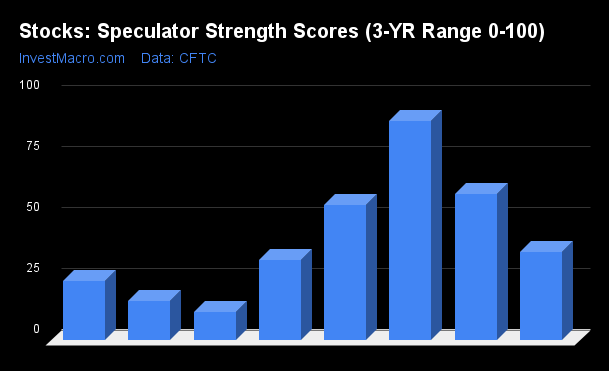
Nasdaq-Mini leads the Strength Scores
Strength Scores (a normalized measure of Speculator positions over a 3-Year range, from 0 to 100 where above 80 is extreme bullish and below 20 is extreme bearish) showed that the Nasdaq-Mini (90.0 percent) leads the stocks markets this week. The Nasdaq-Mini strength score is down from last week’s 96.3 percent but remains in a bullish extreme position (above 80 percent). The VIX (60.2 percent) comes in as the next highest stock market in strength scores.
On the downside, the S&P500-Mini (11.8 percent) comes in at the lowest strength level currently and is followed by the Russell2000-Mini (16.2 percent) with both markets residing in a bearish extreme level currently (below 20 percent).
Strength Statistics:
VIX (60.2 percent) vs VIX previous week (56.0 percent)
S&P500-Mini (11.8 percent) vs S&P500-Mini previous week (7.6 percent)
DowJones-Mini (36.4 percent) vs DowJones-Mini previous week (32.2 percent)
Nasdaq-Mini (90.0 percent) vs Nasdaq-Mini previous week (96.3 percent)
Russell2000-Mini (16.2 percent) vs Russell2000-Mini previous week (14.0 percent)
Nikkei USD (55.4 percent) vs Nikkei USD previous week (55.8 percent)
EAFE-Mini (24.4 percent) vs EAFE-Mini previous week (16.0 percent)
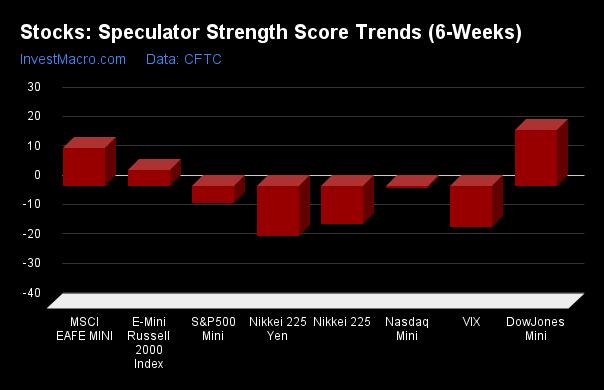
Dow Jones-Mini leads the 6-Week Strength Trends
Strength Score Trends (or move index, calculates the 6-week changes in strength scores) showed that the DowJones-Mini (19.2 percent) leads the past six weeks trends for stocks this week. The EAFE-Mini (13.0 percent) and the Russell 2000-Mini (5.4 percent) fill out the other positive movers in the latest trends data.
The VIX (-14.0 percent) leads the downside trend scores currently while the next market with lower trend scores were the Nikkei USD (-12.8 percent) followed by the S&P500-Mini (-5.8 percent).
——————–
Strength Trend Statistics:
VIX (-14.0 percent) vs VIX previous week (-20.0 percent)
S&P500-Mini (-5.8 percent) vs S&P500-Mini previous week (-8.7 percent)
DowJones-Mini (19.2 percent) vs DowJones-Mini previous week (20.3 percent)
Nasdaq-Mini (-0.7 percent) vs Nasdaq-Mini previous week (10.4 percent)
Russell2000-Mini (5.4 percent) vs Russell2000-Mini previous week (12.8 percent)
Nikkei USD (-12.8 percent) vs Nikkei USD previous week (-13.4 percent)
EAFE-Mini (13.0 percent) vs EAFE-Mini previous week (0.5 percent)
Individual Markets:
VIX Volatility Futures:
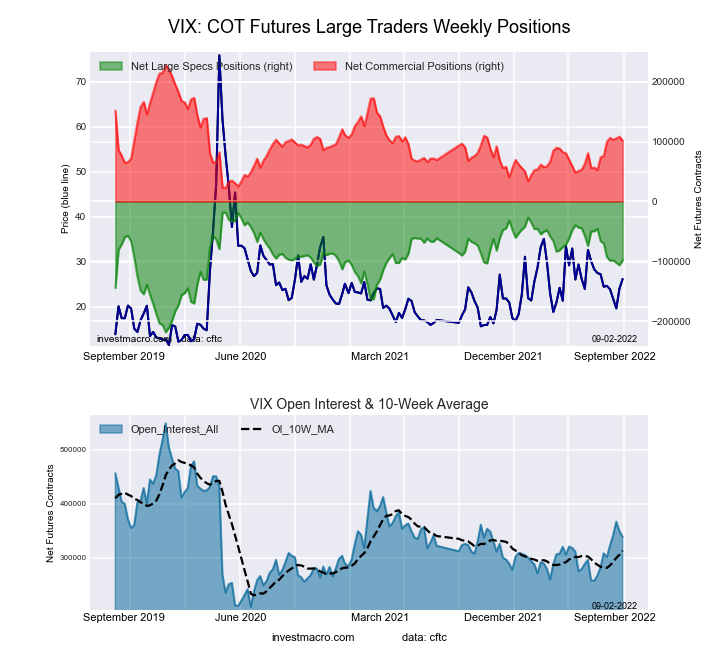 The VIX Volatility large speculator standing this week recorded a net position of -97,935 contracts in the data reported through Tuesday. This was a weekly gain of 8,410 contracts from the previous week which had a total of -106,345 net contracts.
This week’s current strength score (the trader positioning range over the past three years, measured from 0 to 100) shows the speculators are currently Bullish with a score of 60.2 percent. The commercials are Bearish with a score of 38.5 percent and the small traders (not shown in chart) are Bullish with a score of 74.1 percent.
| VIX Volatility Futures Statistics | SPECULATORS | COMMERCIALS | SMALL TRADERS |
| – Percent of Open Interest Longs: | 13.8 | 59.6 | 7.4 |
| – Percent of Open Interest Shorts: | 42.7 | 29.6 | 8.4 |
| – Net Position: | -97,935 | 101,485 | -3,550 |
| – Gross Longs: | 46,792 | 201,681 | 24,889 |
| – Gross Shorts: | 144,727 | 100,196 | 28,439 |
| – Long to Short Ratio: | 0.3 to 1 | 2.0 to 1 | 0.9 to 1 |
| NET POSITION TREND: | |||
| – Strength Index Score (3 Year Range Pct): | 60.2 | 38.5 | 74.1 |
| – Strength Index Reading (3 Year Range): | Bullish | Bearish | Bullish |
| NET POSITION MOVEMENT INDEX: | |||
| – 6-Week Change in Strength Index: | -14.0 | 12.4 | 12.7 |
S&P500 Mini Futures:
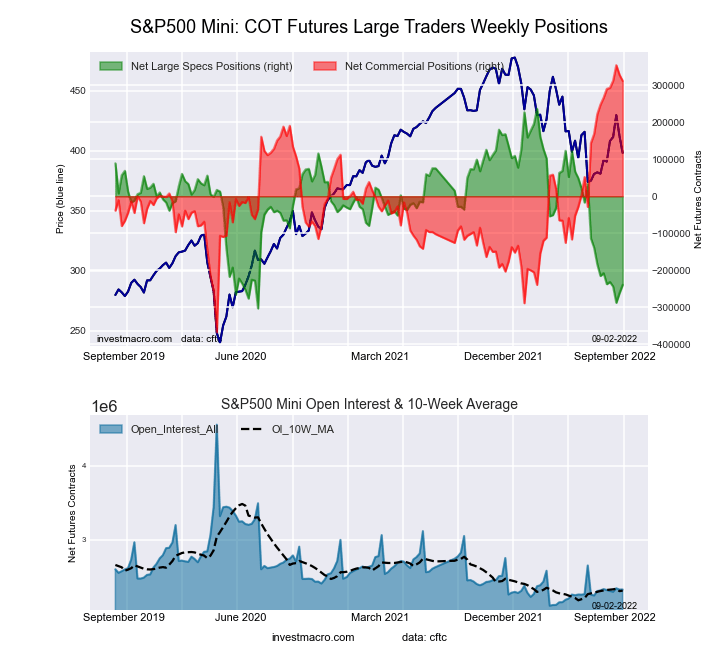 The S&P500 Mini large speculator standing this week recorded a net position of -239,632 contracts in the data reported through Tuesday. This was a weekly lift of 22,644 contracts from the previous week which had a total of -262,276 net contracts.
This week’s current strength score (the trader positioning range over the past three years, measured from 0 to 100) shows the speculators are currently Bearish-Extreme with a score of 11.8 percent. The commercials are Bullish-Extreme with a score of 94.1 percent and the small traders (not shown in chart) are Bearish-Extreme with a score of 11.2 percent.
| S&P500 Mini Futures Statistics | SPECULATORS | COMMERCIALS | SMALL TRADERS |
| – Percent of Open Interest Longs: | 10.3 | 77.3 | 9.7 |
| – Percent of Open Interest Shorts: | 20.6 | 63.9 | 12.8 |
| – Net Position: | -239,632 | 311,815 | -72,183 |
| – Gross Longs: | 240,653 | 1,800,768 | 224,954 |
| – Gross Shorts: | 480,285 | 1,488,953 | 297,137 |
| – Long to Short Ratio: | 0.5 to 1 | 1.2 to 1 | 0.8 to 1 |
| NET POSITION TREND: | |||
| – Strength Index Score (3 Year Range Pct): | 11.8 | 94.1 | 11.2 |
| – Strength Index Reading (3 Year Range): | Bearish-Extreme | Bullish-Extreme | Bearish-Extreme |
| NET POSITION MOVEMENT INDEX: | |||
| – 6-Week Change in Strength Index: | -5.8 | 6.3 | -2.9 |
Dow Jones Mini Futures:
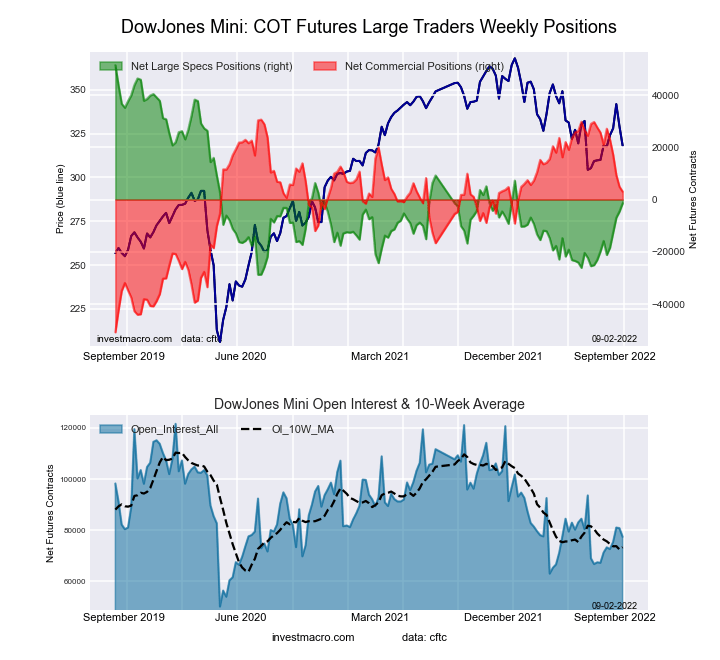 The Dow Jones Mini large speculator standing this week recorded a net position of -1,420 contracts in the data reported through Tuesday. This was a weekly gain of 3,174 contracts from the previous week which had a total of -4,594 net contracts.
This week’s current strength score (the trader positioning range over the past three years, measured from 0 to 100) shows the speculators are currently Bearish with a score of 36.4 percent. The commercials are Bullish with a score of 63.1 percent and the small traders (not shown in chart) are Bearish with a score of 29.9 percent.
| Dow Jones Mini Futures Statistics | SPECULATORS | COMMERCIALS | SMALL TRADERS |
| – Percent of Open Interest Longs: | 34.5 | 49.1 | 15.0 |
| – Percent of Open Interest Shorts: | 36.3 | 45.2 | 17.1 |
| – Net Position: | -1,420 | 3,027 | -1,607 |
| – Gross Longs: | 26,724 | 38,005 | 11,643 |
| – Gross Shorts: | 28,144 | 34,978 | 13,250 |
| – Long to Short Ratio: | 0.9 to 1 | 1.1 to 1 | 0.9 to 1 |
| NET POSITION TREND: | |||
| – Strength Index Score (3 Year Range Pct): | 36.4 | 63.1 | 29.9 |
| – Strength Index Reading (3 Year Range): | Bearish | Bullish | Bearish |
| NET POSITION MOVEMENT INDEX: | |||
| – 6-Week Change in Strength Index: | 19.2 | -24.1 | 18.9 |
Nasdaq Mini Futures:
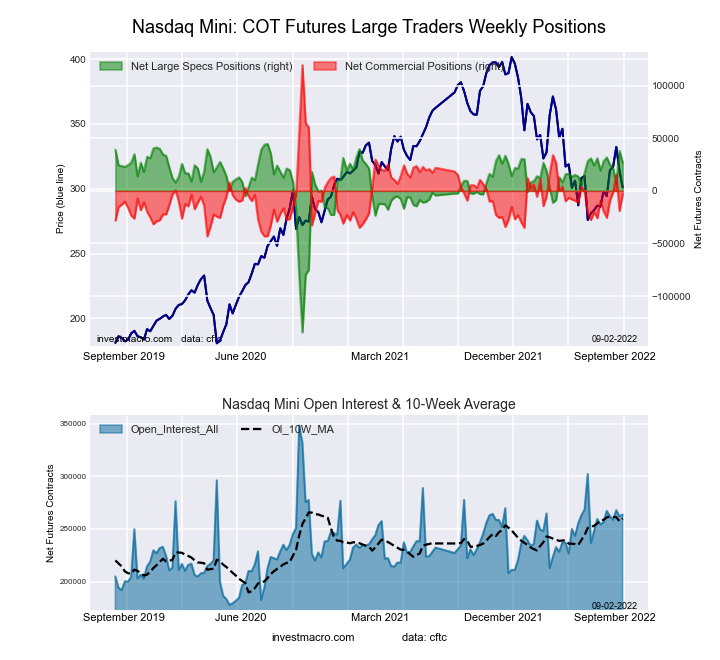 The Nasdaq Mini large speculator standing this week recorded a net position of 26,807 contracts in the data reported through Tuesday. This was a weekly decrease of -11,226 contracts from the previous week which had a total of 38,033 net contracts.
This week’s current strength score (the trader positioning range over the past three years, measured from 0 to 100) shows the speculators are currently Bullish-Extreme with a score of 90.0 percent. The commercials are Bearish with a score of 24.8 percent and the small traders (not shown in chart) are Bearish-Extreme with a score of 0.0 percent.
| Nasdaq Mini Futures Statistics | SPECULATORS | COMMERCIALS | SMALL TRADERS |
| – Percent of Open Interest Longs: | 29.4 | 56.3 | 12.2 |
| – Percent of Open Interest Shorts: | 19.2 | 57.4 | 21.2 |
| – Net Position: | 26,807 | -2,850 | -23,957 |
| – Gross Longs: | 77,379 | 148,385 | 32,035 |
| – Gross Shorts: | 50,572 | 151,235 | 55,992 |
| – Long to Short Ratio: | 1.5 to 1 | 1.0 to 1 | 0.6 to 1 |
| NET POSITION TREND: | |||
| – Strength Index Score (3 Year Range Pct): | 90.0 | 24.8 | 0.0 |
| – Strength Index Reading (3 Year Range): | Bullish-Extreme | Bearish | Bearish-Extreme |
| NET POSITION MOVEMENT INDEX: | |||
| – 6-Week Change in Strength Index: | -0.7 | 10.3 | -31.5 |
Russell 2000 Mini Futures:
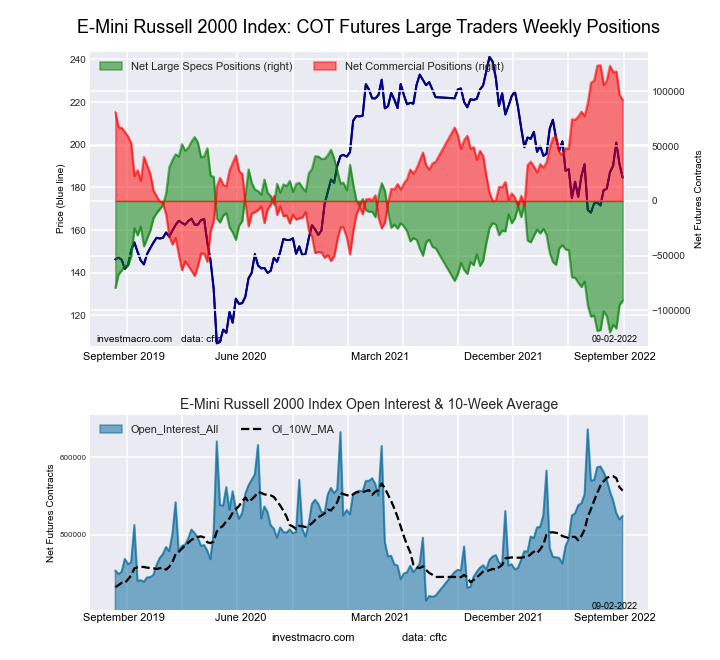 The Russell 2000 Mini large speculator standing this week recorded a net position of -91,149 contracts in the data reported through Tuesday. This was a weekly boost of 3,774 contracts from the previous week which had a total of -94,923 net contracts.
This week’s current strength score (the trader positioning range over the past three years, measured from 0 to 100) shows the speculators are currently Bearish-Extreme with a score of 16.2 percent. The commercials are Bullish-Extreme with a score of 83.5 percent and the small traders (not shown in chart) are Bearish with a score of 23.9 percent.
| Russell 2000 Mini Futures Statistics | SPECULATORS | COMMERCIALS | SMALL TRADERS |
| – Percent of Open Interest Longs: | 7.5 | 86.8 | 4.2 |
| – Percent of Open Interest Shorts: | 24.9 | 69.2 | 4.4 |
| – Net Position: | -91,149 | 92,282 | -1,133 |
| – Gross Longs: | 39,315 | 455,296 | 22,023 |
| – Gross Shorts: | 130,464 | 363,014 | 23,156 |
| – Long to Short Ratio: | 0.3 to 1 | 1.3 to 1 | 1.0 to 1 |
| NET POSITION TREND: | |||
| – Strength Index Score (3 Year Range Pct): | 16.2 | 83.5 | 23.9 |
| – Strength Index Reading (3 Year Range): | Bearish-Extreme | Bullish-Extreme | Bearish |
| NET POSITION MOVEMENT INDEX: | |||
| – 6-Week Change in Strength Index: | 5.4 | -7.1 | 12.4 |
Nikkei Stock Average (USD) Futures:
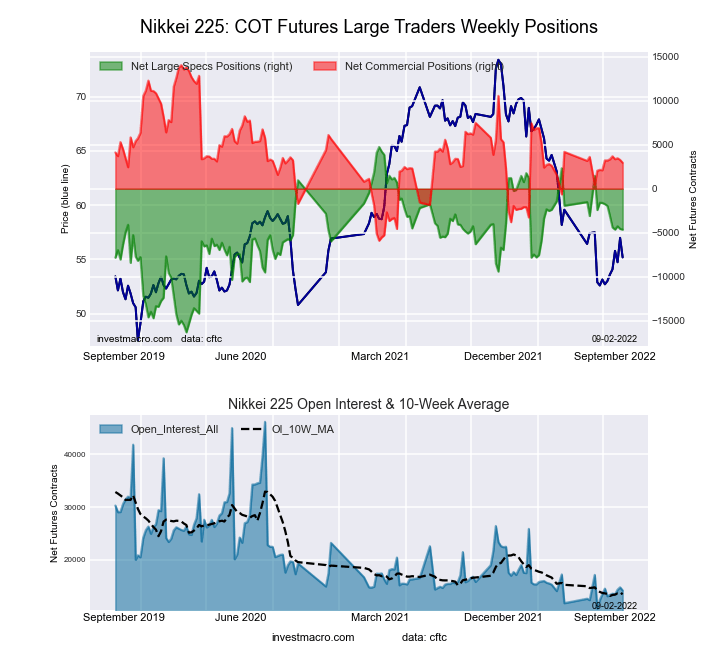 The Nikkei Stock Average (USD) large speculator standing this week recorded a net position of -4,641 contracts in the data reported through Tuesday. This was a weekly reduction of -78 contracts from the previous week which had a total of -4,563 net contracts.
This week’s current strength score (the trader positioning range over the past three years, measured from 0 to 100) shows the speculators are currently Bullish with a score of 55.4 percent. The commercials are Bearish with a score of 44.4 percent and the small traders (not shown in chart) are Bearish with a score of 49.6 percent.
| Nikkei Stock Average Futures Statistics | SPECULATORS | COMMERCIALS | SMALL TRADERS |
| – Percent of Open Interest Longs: | 12.2 | 53.3 | 34.2 |
| – Percent of Open Interest Shorts: | 45.0 | 32.5 | 22.3 |
| – Net Position: | -4,641 | 2,949 | 1,692 |
| – Gross Longs: | 1,729 | 7,548 | 4,844 |
| – Gross Shorts: | 6,370 | 4,599 | 3,152 |
| – Long to Short Ratio: | 0.3 to 1 | 1.6 to 1 | 1.5 to 1 |
| NET POSITION TREND: | |||
| – Strength Index Score (3 Year Range Pct): | 55.4 | 44.4 | 49.6 |
| – Strength Index Reading (3 Year Range): | Bullish | Bearish | Bearish |
| NET POSITION MOVEMENT INDEX: | |||
| – 6-Week Change in Strength Index: | -12.8 | -1.3 | 37.0 |
MSCI EAFE Mini Futures:
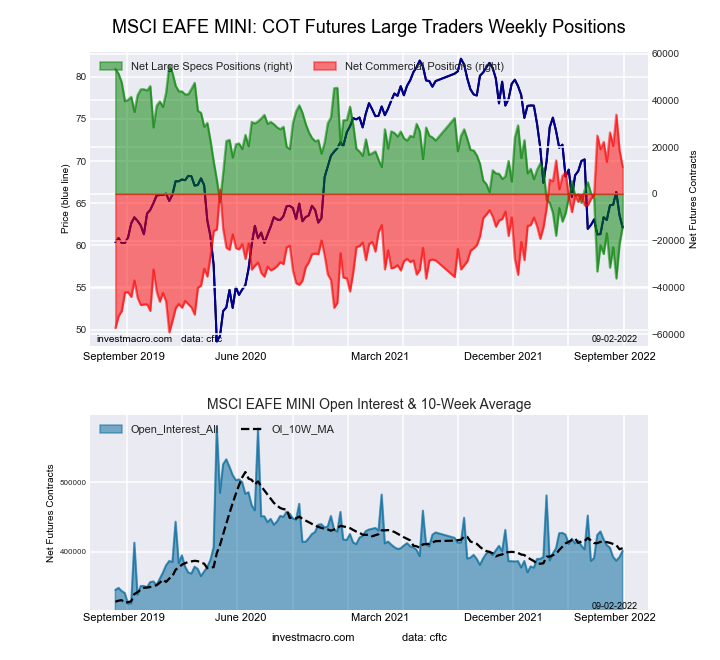 The MSCI EAFE Mini large speculator standing this week recorded a net position of -13,864 contracts in the data reported through Tuesday. This was a weekly gain of 7,680 contracts from the previous week which had a total of -21,544 net contracts.
This week’s current strength score (the trader positioning range over the past three years, measured from 0 to 100) shows the speculators are currently Bearish with a score of 24.4 percent. The commercials are Bullish with a score of 75.9 percent and the small traders (not shown in chart) are Bearish with a score of 40.0 percent.
| MSCI EAFE Mini Futures Statistics | SPECULATORS | COMMERCIALS | SMALL TRADERS |
| – Percent of Open Interest Longs: | 5.9 | 91.5 | 2.1 |
| – Percent of Open Interest Shorts: | 9.4 | 88.6 | 1.5 |
| – Net Position: | -13,864 | 11,445 | 2,419 |
| – Gross Longs: | 23,657 | 366,925 | 8,362 |
| – Gross Shorts: | 37,521 | 355,480 | 5,943 |
| – Long to Short Ratio: | 0.6 to 1 | 1.0 to 1 | 1.4 to 1 |
| NET POSITION TREND: | |||
| – Strength Index Score (3 Year Range Pct): | 24.4 | 75.9 | 40.0 |
| – Strength Index Reading (3 Year Range): | Bearish | Bullish | Bearish |
| NET POSITION MOVEMENT INDEX: | |||
| – 6-Week Change in Strength Index: | 13.0 | -11.6 | -8.8 |
Article By InvestMacro – Receive our weekly COT Reports by Email
*COT Report: The COT data, released weekly to the public each Friday, is updated through the most recent Tuesday (data is 3 days old) and shows a quick view of how large speculators or non-commercials (for-profit traders) were positioned in the futures markets.
The CFTC categorizes trader positions according to commercial hedgers (traders who use futures contracts for hedging as part of the business), non-commercials (large traders who speculate to realize trading profits) and nonreportable traders (usually small traders/speculators) as well as their open interest (contracts open in the market at time of reporting). See CFTC criteria here.

- The US introduces new import tariffs for 60 countries. Brent crude surpasses $100 per barrel Jul 24, 2026
- USD/JPY Breaks Records: Nothing Slows the Yen’s Decline Jul 24, 2026
- Oil prices reached a 6‑week high. The AUD strengthened on the back of a strong labor‑market report Jul 23, 2026
- EUR/USD Recovers as Dollar Weakens Jul 23, 2026
- Bitcoin rose to $66,000. The New Zealand dollar continues to strengthen Jul 22, 2026
- Inflationary pressure is easing in Canada. In New Zealand, on the contrary, inflation is rising Jul 21, 2026
- GBP/USD Falls After Cabinet Changes Jul 21, 2026
- Geopolitical and macroeconomic conditions continue to pressure market sentiment Jul 20, 2026
- USD/JPY Poised to Continue Gains as Expensive Oil and Lack of Support Weigh on Yen Jul 20, 2026
- COT Metals Charts: Weekly Speculator Bets led by Copper & Steel Jul 18, 2026