Japanese Candlesticks Analysis 16.08.2022 (USDCAD, AUDUSD, USDCHF)

Article By RoboForex.com

USDCAD, “US Dollar vs Canadian Dollar”

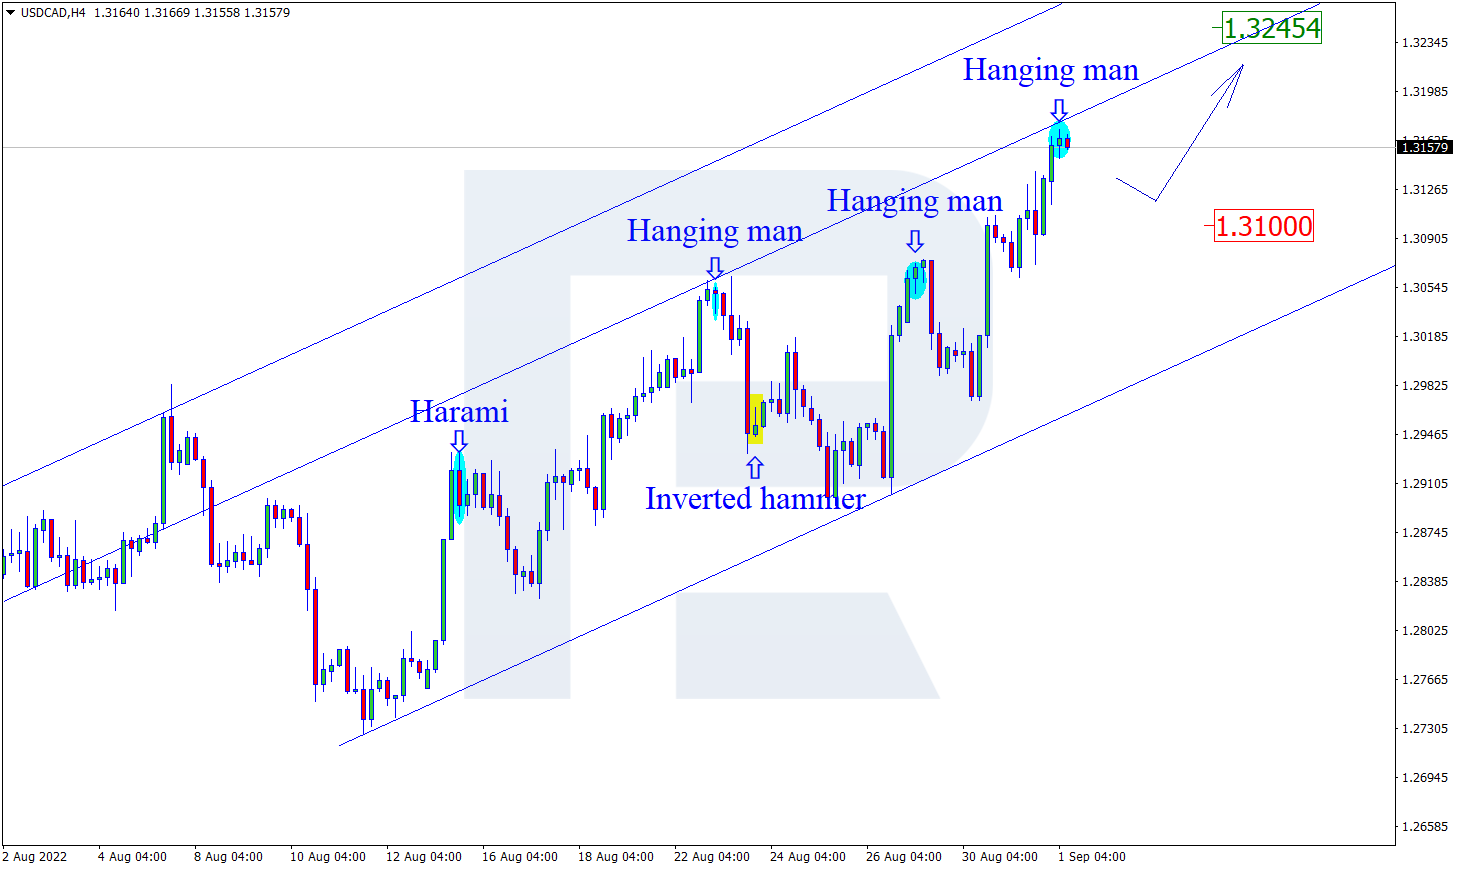
As we can see in the H4 chart, after forming several reversal patterns close to the resistance level, such as Harami, USDCAD may reverse in the form of a new descending impulse. In this case, the downside target may be at 1.2830. Later, the market may break this level and continue falling. However, an alternative scenario implies that the asset may correct to reach 1.2950 and continue the downtrend only after the pullback.

USDCAD
Risk Warning: the result of previous trading operations do not guarantee the same results in the future

AUDUSD, “Australian Dollar vs US Dollar”

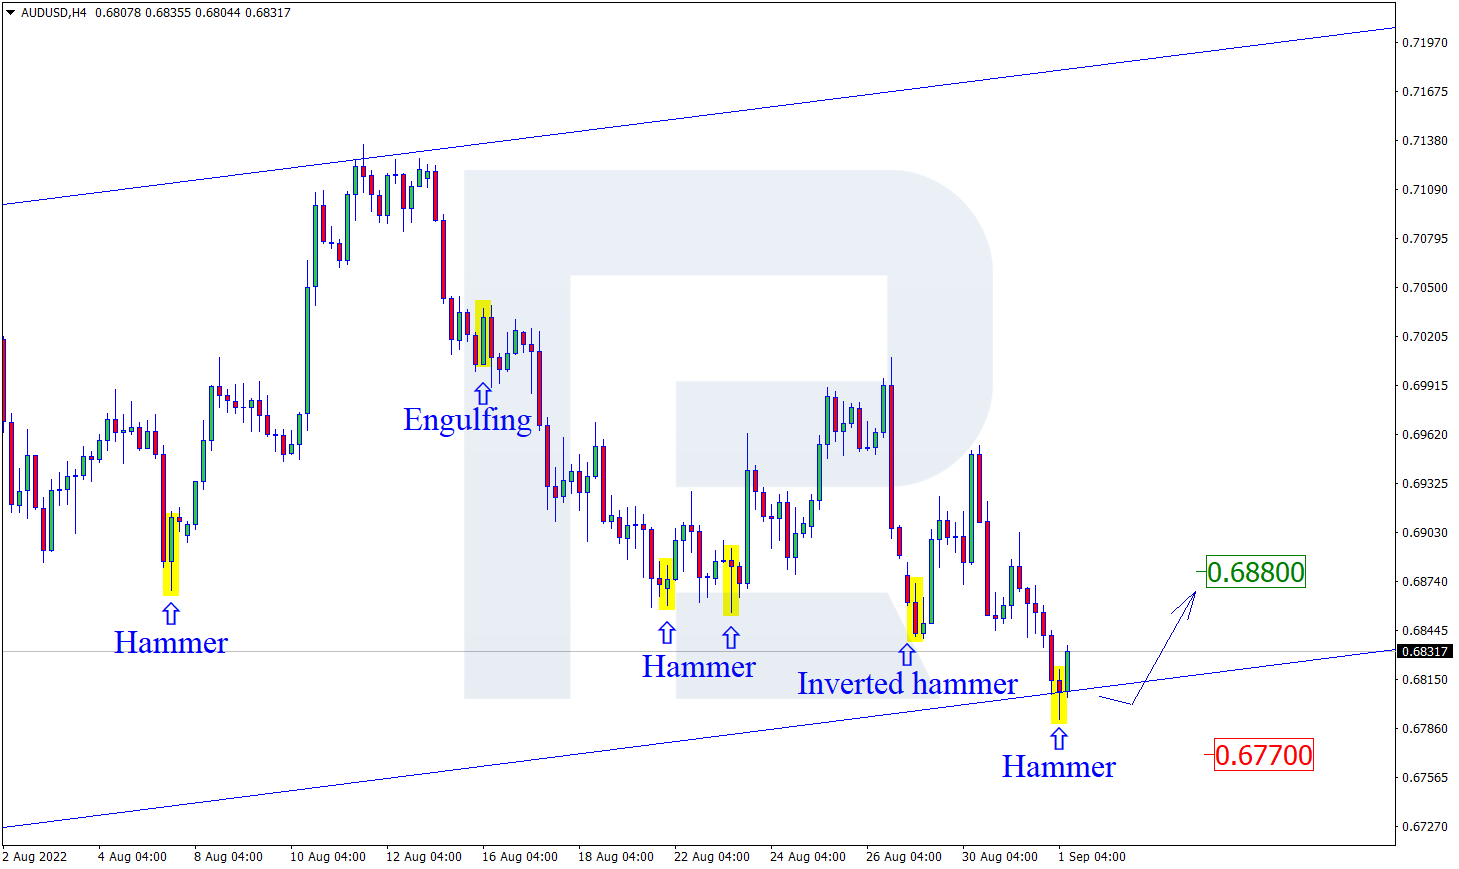
As we can see in the H4 chart, AUDUSD has formed an Engulfing reversal pattern near the support area. At the moment, the asset is reversing in the form a new rising impulse. In this case, the upside target may be the resistance level at 0.7090. After testing the level, the price may break it and resume the ascending tendency. At the same time, the opposite scenario implies that the price may correct to reach the channel’s downside border at 0.6985 and continue the uptrend only after the pullback.

AUDUSD
Risk Warning: the result of previous trading operations do not guarantee the same results in the future

USDCHF, “US Dollar vs Swiss Franc”

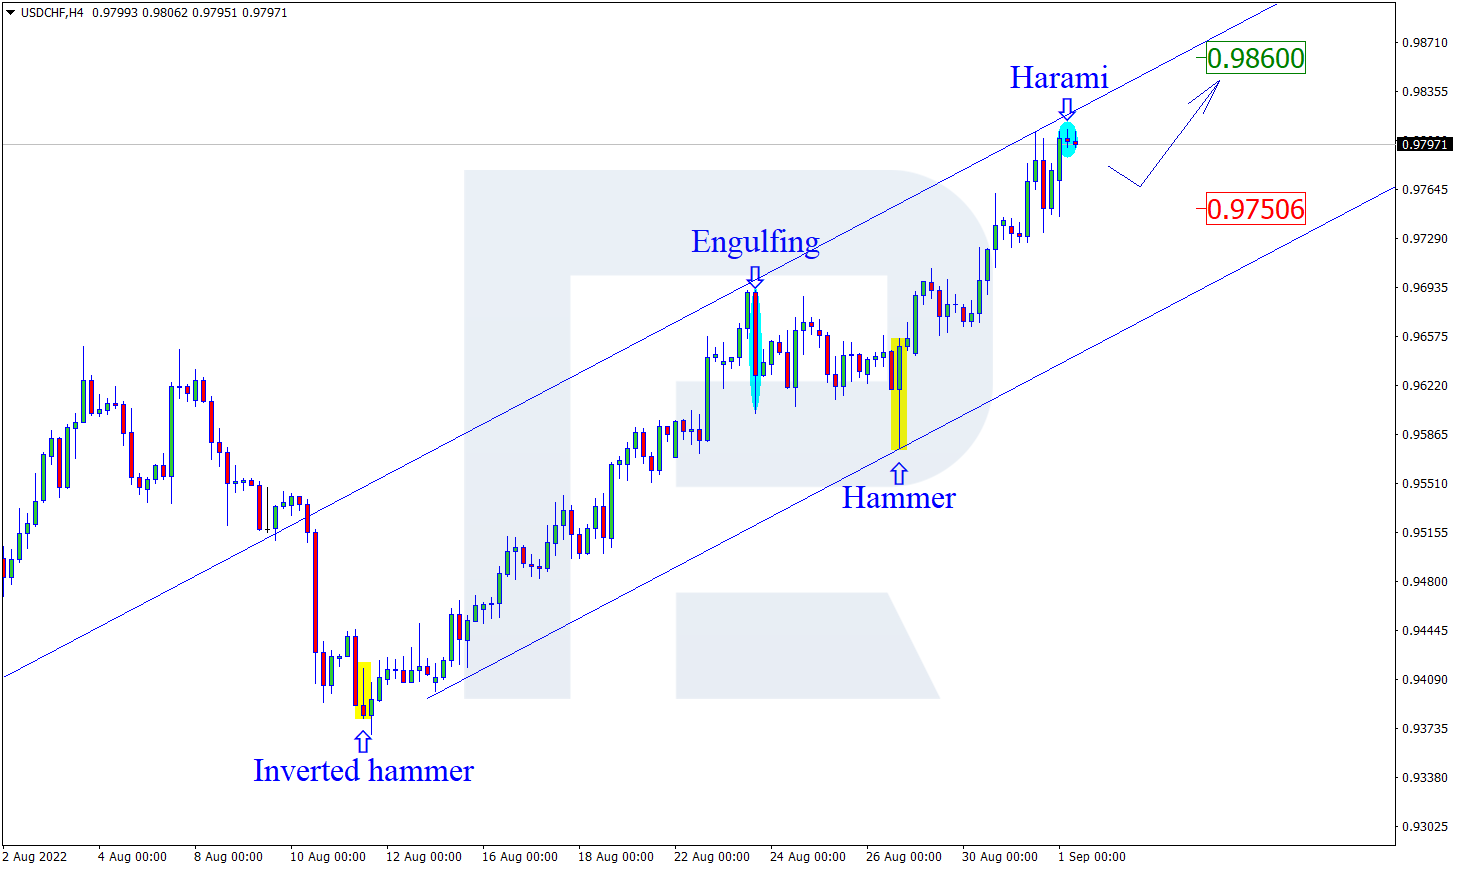
As we can see in the H4 chart, after testing the resistance area, the pair has formed a Doji reversal pattern. At the moment, USDCHF may reverse in the form of a new descending impulse. In this case, the downside target may be at 0.9370. After testing the support level, the price may break it and continue trading downwards. Still, there might be an alternative scenario, in which the asset may correct to reach 0.9510 and continue the descending tendency only after the pullback.

USDCHF

Article By RoboForex.com

Attention!
Forecasts presented in this section only reflect the author’s private opinion and should not be considered as guidance for trading. RoboForex LP bears no responsibility for trading results based on trading recommendations described in these analytical reviews.

The Analytical Overview of the Main Currency Pairs on 2022.08.16

By JustForex

The EUR/USD currency pair

Technical indicators of the currency pair:
  • Prev Open: 1.0253
  • Prev Close: 1.0159
  • % chg. over the last day: -0.92%

The situation on the EUR/USD currency pair remains the same. The European currency will be under pressure in the coming weeks since the difference in the interest rates (US Fed – 2.5%, ECB – 0.5%) plays in favor of the EURUSD quotes decrease. The economic indicators in the Eurozone are getting worse, the energy crisis is also worsening, and inflation in European countries shows no signs of slowing down. The Eurozone is slowly but steadily sliding into recession.

Trading recommendations
  • Support levels: 1.0112, 1.0035, 1.0000
  • Resistance levels: 1.0185, 1.0230, 1.0286, 1.0365, 1.0415, 1.050

From the technical point of view, the trend on the EUR/USD currency pair on the hourly time frame has changed to bearish. The price confidently broke through the priority change level and consolidated below the moving averages. Under such market conditions, buy trades are best sought on intraday time frames from the support level of 1.0112, but with confirmation in the form of a reverse initiative. Sell trades can be considered from resistance levels of 1.0185 or 1.0230, but only after the additional confirmation.

Alternative scenario: if the price breaks out of the 1.0286 resistance level and fixes above, the uptrend will likely resume.

EUR/USD
News feed for 2022.08.16:
  • – Eurozone German ZEW Economic Sentiment (m/m) at 12:00 (GMT+3);
  • – Eurozone ZEW Economic Sentiment (m/m) at 12:00 (GMT+3);
  • – US Building Permits (m/m) at 15:30 (GMT+3);
  • – US Industrial Production (m/m) at 16:15 (GMT+3).

The GBP/USD currency pair

Technical indicators of the currency pair:
  • Prev Open: 1.2123
  • Prev Close: 1.2053
  • % chg. over the last day: -0.58%

Many important labor market statistics will be published today in the UK. Strong data may support the British currency on expectations of a more aggressive rate hike from the Bank of England. Conversely, the labor market’s weakness will force the Bank of England to revise the rate hike from 50bp to 25bp, which will surely provoke a wave of sell-off in GBPUSD.

Trading recommendations
  • Support levels: 1.2000
  • Resistance levels: 1.2065, 1.2103, 1.2167, 1.2215, 1.2294

From the technical point of view, the GBP/USD currency pair trend on the hourly time frame has changed to bearish. The price has now consolidated below the average lines and has broken down the priority change level. The MACD indicator has turned negative, and the sellers’ pressure remains, but there are signs of divergence. At the moment, it is better to look for buy trades on the intraday time frames from the support level of 1.2000, but only with a confirmation. Sell trades can be considered from the resistance level of 1.2065 or 1.2103, but only after the additional confirmation.

Alternative scenario: if the price breaks out through the 1.2215 resistance level and fixes above, the uptrend will likely resume.

GBP/USD
News feed for 2022.08.16:
  • – UK Average Earnings Index (m/m) at 09:00 (GMT+3);
  • – UK Claimant Count Change (m/m) at 09:00 (GMT+3);
  • – UK Unemployment Rate (m/m) at 09:00 (GMT+3).

The USD/JPY currency pair

Technical indicators of the currency pair:
  • Prev Open: 133.41
  • Prev Close: 133.29
  • % chg. over the last day: -0.09%

On Monday, Japanese Prime Minister Fumio Kishida instructed officials to develop an additional package of steps by early September to ease consumers’ pain from rising wheat and energy import prices amid the war in Ukraine. The government will fight rising inflation, the first hint that the Bank of Japan may abandon its soft monetary policy. While the package is still being worked out, the interest rate differential (US Fed – 2.5%, Bank of Japan -0.10%) will favor a further rise in USD/JPY quotes. However, it is already seen that JPY is more stable against the USD than other currencies, so investors should keep a close eye on the actions of the BoJ.

Trading recommendations
  • Support levels: 132.27, 131.08, 130.85
  • Resistance levels: 134.36, 136.02, 137.12

From the technical point of view, the medium-term trend on the currency pair USD/JPY is still bullish. The price has formed an accumulation zone above the 134.36 level, so a test of this zone is very likely. The price is currently trading in a narrow direction. Under such market conditions, buy trades can be sought from the support level of 132.27, but with additional confirmation. For sell deals, it is possible to consider the level of resistance 134.36, but only with additional confirmation in the form of a reverse initiative, as fundamentally, USD/JPY quotes are inclined to grow.

If the price fixes below 131.37, the downtrend will likely resume.

USD/JPY
There is no news feed for today.

The USD/CAD currency pair

Technical indicators of the currency pair:
  • Prev Open: 1.2770
  • Prev Close: 1.2901
  • % chg. over the last day: +1.02%

Canada will release consumer price data for July today. Analysts forecast inflation to remain about the same, with a possible 0.1% increase. Thus, strategists expect a slowdown in inflation as in the United States. If that happens, the Canadian dollar might get into a sell-off amid expectations that the Bank of Canada will be forced to be less aggressive in raising interest rates. Moreover, a decrease in oil prices negatively affects the Canadian currency.

Trading recommendations
  • Support levels: 1.2817, 1.2761
  • Resistance levels: 1.2927, 1.2965

From the point of view of technical analysis, the trend on the USD/CAD currency pair has changed to bullish. The price has steadily consolidated above the level of change of priority and above the moving averages. The MACD indicator has become positive, but the buyers’ pressure remains. Under such market conditions, buy trades should be considered on the lower time frames from the support level of 1.2817, but only with confirmation and short targets. It is better to consider the resistance level of 1.2927 for sell deals, but with confirmation because the level has already been tested.

Alternative scenario: if the price breaks down and consolidates below the 1.2761 support level, the downtrend will likely resume.

USD/CAD
News feed for 2022.08.16:
  • – Canada Consumer Price Index (m/m) at 15:30 (GMT+3).

By JustForex


This article reflects a personal opinion and should not be interpreted as an investment advice, and/or offer, and/or a persistent request for carrying out financial transactions, and/or a guarantee, and/or a forecast of future events.


2 REITs to Buy and Hold

By Ino.com

– Despite the macroeconomic headwinds, real estate investment trusts (REITs) are expected to remain resilient due to rising demand, appreciation of property prices amid the high inflation, and increasing rental income. Moreover, REITs are considered ideal investments in uncertain market conditions since they pay out at least 90% of their income as dividends.

So, quality REITs LTC Properties (LTC) and Getty Realty (GTY) could be ideal investments to survive the short-term market fluctuations and create solid long-term returns.

High inflation, rising interest rates, and economic uncertainties have discouraged home buyers this year. However, increased regional population distribution, rising demand for rental properties, and appreciating property prices bode well for real estate investment trusts (REITs).

In addition, the inclination of businesses toward local sourcing after the pandemic is expected to drive further growth in this sector. The real estate sector in the United States is projected to grow at a 3.7% CAGR to $412.60 billion by 2025.

Moreover, REITs are considered safe investments in uncertain times since they must pay at least 90% of their taxable income as dividends.

Fundamentally sound REITs LTC Properties, Inc. (LTC) and Getty Realty Corporation (GTY) could offer diversification, inflation hedge, and superior dividend returns to long-term investors.

LTC Properties, Inc. (LTC)

LTC invests in senior housing and healthcare properties. It invests in four broad segments: Skilled Nursing centers (SNF); Assisted Living Facilities (ALF); Independent Living Facilities (ILF); and Memory Care facilities (MC). Its operations include sale-leasebacks, mortgage financing, joint ventures, construction financing, and structured financing solutions.

On July 1, LTC declared a monthly cash dividend of $0.19 per common share for July, August, and September 2022. Its dividend payouts have grown at a 6.3% CAGR over the last three years and a 0.2% CAGR over the past five years. Its dividend payout ratio is 98.28%, while its current dividend translates to a 5.24% yield.

On May 12, LTC confirmed a $36 million investment for refinancing debt on four assisted living communities and a land parcel.

According to LTC’s Chairman and CEO, Wendy Simpson, “Year-to-date, LTC has used its flexibility and creativity to invest more than $110 million, with a current focus on newer construction. We will continue to identify new and strategic opportunities across a variety of financing vehicles to put our capital to work in a way that benefits all LTC’s stakeholders.”

LTC’s total revenues increased 12.8% year-over-year to $43.02 million in the fiscal 2022 second quarter ended June 30, 2022. Its operating income came in at $54.11 million, up 201.4% year-over-year. FFO attributable to common shareholders, excluding non-recurring items, amounted to $24.49 million, up 9.8% year-over-year. Its FFO per common share improved 12.3% year-over-year to $0.64.

The consensus FFO estimate of $2.53 for the fiscal year 2022 represents a 7.3% improvement year-over-year. The consensus revenue estimate of $161.80 million for the current year represents a 4.2% increase from the previous year. The company has surpassed the consensus revenue and FFO estimates in each of the trailing four quarters.

LTC has gained 27.9% over the past six months and 23.2% over the past year to close the last trading session at $43.48.

LTC’s POWR Ratings reflect this stable outlook. The REIT has an overall rating of B, which translates to a Buy in the POWR Ratings system. The POWR Ratings assess stocks by 118 different factors, each with its own weighting.

LTC is also rated B in Growth, Momentum, and Sentiment. Within the REITs – Healthcare industry, it is ranked #1 of 16 stocks. Click here to learn more about POWR Ratings.

Getty Realty Corporation (GTY)

GTY invests in convenience stores, automotive service centers, and other single-tenant real estates, such as drive-through quick service restaurants. Its operations include acquisition, financing, and development, and it has a variety of national and regional brands as its tenants.

On July 27, GTY announced that its board of directors declared a dividend of $0.41 per share common payable on October 6 to holders of record on September 22. Its dividend payouts have grown at a 5.8% CAGR over the last three years and an 8.3% CAGR over the past five years. The stock’s four-year average dividend yield is 4.96%, while its current dividend translates to a 5.51% yield.

GTY’s total revenues increased 6.5% year-over-year to $41.18 million in the fiscal 2022 second quarter ended June 30, 2022. Its operating income came in at $37.34 million during the same period, up 98.2% year-over-year. Adjusted FFO amounted to $25.38 million, up 8.3% year-over-year. Its adjusted FFO per common share improved 1.9% year-over-year to $0.53.

The consensus FFO estimate of $2.10 for the fiscal year 2022 represents an 11.6% improvement year-over-year. The consensus revenue estimate of $163.45 million for the current year represents a 6.2% increase from the previous year. It’s no surprise that the company has topped the consensus FFO estimates in three of the trailing four quarters.

GTY has gained 5.4% over the past six months to close the last trading session at $29.74.

GTY’s POWR Ratings reflect this stable outlook. The company has an overall rating of B, which translates to a Buy in the POWR Ratings system. It also has a B grade for Momentum, Stability, and Sentiment. In the 33-stock REITs – Retail industry, it is ranked #3.

Beyond what’s stated above, there are GTY grades for Growth, Value, and Quality. Click here to learn more about POWR Ratings.


About the Author

Mangeet Kaur Bouns’s keen interest in the stock market led her to become an investment researcher and financial journalist. Using her fundamental approach to analyzing stocks, Mangeet’s looks to help retail investors understand the underlying factors before making investment decisions. She earned a bachelor’s degree in finance from BI Norwegian Business School. Mangeet is a regular contributor for StockNews.com.

By Ino.com – See our Trader Blog, INO TV Free & Market Analysis Alerts

Source: 2 REITs to Buy and Hold

Oil prices are declining. Investors buy Asian shares on expectations of stimulus from the People’s Bank of China

By JustForex

US stock indexes were trading up yesterday. By Monday’s close of trading, the Dow Jones (US30) gained 0.45%, and the S&P 500 (US500) added 0.40%. The NASDAQ Technology Index (US100) jumped by 0.62%. Investors are still focused on signals of weakening inflation in the US and an improvement in the country’s economic assessment. However, the Fed is only 60-70% of the way through its interest rate hike cycle and will begin trimming the balance sheet starting in September.

The focus for traders this week remains the FOMC minutes, data on US industrial production and retail sales for July, and quarterly reports from US retailers Walmart Inc, Target Corp, and Home Depot Inc, which should show how the US retail sector and consumers are holding up amid high inflation.

Stock markets in Europe were mostly up yesterday. Germany’s DAX (DE30) gained 0.74% on Monday, France’s CAC 40 (FR40) added 0.25%, Spain’s IBEX 35 Index (ES35) increased by 0.32%, Britain’s FTSE 100 (UK100) closed up by 0.11%.

Europe is facing rising energy bills this year, driven by global increases in wholesale electricity and gas prices. European gas prices have more than tripled this year, partly after supply disruptions related to Russia’s invasion of Ukraine.

Oil prices hit six-month lows Monday after China released weak July data on industrial production and retail sales. As a result, the People’s Bank of China poured 400 billion yuan (nearly $60 billion) into the financial system to bolster the Chinese economy to revive demand in an economy slowed by Beijing’s ongoing Covid restrictions.

Iran is due this week to finally answer the remaining three outstanding questions on the nuclear deal. If Tehran reaches an agreement with Europe and the United States, oil supplies may rise sharply soon, putting even more downward pressure on oil quotes.

The head of Saudi Aramco, the world’s largest oil exporter, unexpectedly said yesterday that the company is ready to increase production to 12 million barrels per day despite signs of a global economic slowdown. This came as a surprise to analysts, especially after the recent OPEC+ meeting, as the state-owned company rarely makes such a comment without permission from Energy Minister Abdulaziz bin Salman or his half-brother, Crown Prince Mohammed bin Salman. In the United States, the peak summer driving season is winding down, and fuel demand is expected to decline further in the next two weeks.

Asian markets traded flat yesterday. Japan’s Nikkei 225 (JP225) gained 1.14%, Hong Kong’s Hang Seng (HK50) decreased by 0.67%, and Australia’s S&P/ASX 200 (AU200) was up by 0.45%. At the market’s opening, Asian shares started to show gains on expectations that China would deploy more stimulus measures to improve economic growth.

ING Bank cut its 2022 GDP growth forecast for China to 4%, down from the previous forecast of 4.4%, and said a further downgrade is possible. The Chinese yuan fell the most among Asian currencies on Tuesday, hitting a three-month low, as the central bank’s unexpected rate cut raised fears of a slowdown in economic growth.

S&P 500 (F) (US500) 4,297.14 +16.99 (+0.40%)

Dow Jones (US30) 33,912.44 +151.39 (+0.45%)

DAX (DE40) 13,816.61 +20.76 (+0.15%)

FTSE 100 (UK100) 7,509.15 +8.26 (+0.11%)

USD Index 106.51 +0.88 (+0.83%)

Important events for today:
  • – Australia RBA Meeting Minutes at 04:30 (GMT+3);
  • – UK Average Earnings Index (m/m) at 09:00 (GMT+3);
  • – UK Claimant Count Change (m/m) at 09:00 (GMT+3);
  • – UK Unemployment Rate (m/m) at 09:00 (GMT+3);
  • – Eurozone German ZEW Economic Sentiment (m/m) at 12:00 (GMT+3);
  • – Eurozone ZEW Economic Sentiment (m/m) at 12:00 (GMT+3);
  • – US Building Permits (m/m) at 15:30 (GMT+3);
  • – Canada Consumer Price Index (m/m) at 15:30 (GMT+3);
  • – US Industrial Production (m/m) at 16:15 (GMT+3).

By JustForex


This article reflects a personal opinion and should not be interpreted as an investment advice, and/or offer, and/or a persistent request for carrying out financial transactions, and/or a guarantee, and/or a forecast of future events.

Markets remain worried by global recession fears

By ForexTime

Asian shares edged cautiously higher on Tuesday, tracking a rebound in Wall Street overnight despite disappointing economic data from China and the US fuelling recessionary fears. Stocks in the region were supported by expectations over China unleashing more stimulus to support economic growth. In Europe, futures pointed to a steady start, borrowing momentum from Asian markets ahead of the German ZEW survey for August. This has proved to be a leading indicator for the Eurozone and may give more insight into the severity of the downturn in the wider region. With recent economic data showing US inflation cooling, this has offered equity bulls some room to breathe and may translate to further short-term gains across stock markets.

In the currency arena, the safe-haven dollar drew ample strength from global recession fears while oil prices tumbled to levels not seen in six months on growing signs of an economic downturn and prospects of rising supply on an Iran deal. Gold has struggled for direction this morning after tumbling more than one per cent in the previous session. Prices are trading back within a range and could be waiting for a fresh directional catalyst this week.

Fed minutes and Fed speakers in focus

This could be a volatile week for the dollar due to the FOMC meeting minutes, key economic reports as well as scheduled speeches from Fed officials.

All eyes will be on the Federal Reserve meeting minutes released on Wednesday. This will be closely scrutinised by investors for any fresh clues  into what policymakers were thinking when rates were hiked by 75 basis points for a second straight meeting. If the minutes strike a hawkish tone, this could inject dollar bulls with fresh inspiration as rate hike bets jump towards another jumbo-sized September move. Alternatively, any dovish hints or caution may encourage some dollar weakness. It will also be wise to keep an eye on the US retail sales report for July published mid-week and speeches by Kansas City Fed President Esther George and Minneapolis Fed President Neel Kashkari on Thursday.

Oil prices crumble

Oil prices collapsed like a house of cards on Monday as China’s growth fears and prospects of rising supply empowered bears. Given how Libya is pumping more oil and Iran is moving closer to restoring a nuclear deal, this could result in higher flows at a time when demand remains shaky. Both WTI and Brent remain under pressure on the daily charts with a stronger dollar seen enforcing downside pressures. The benchmarks have shed roughly six per cent this month with the current fundamental drivers opening the doors to further losses this week.

Commodity spotlight – Gold 

Gold remains stuck in a range with support at $1770 and resistance at $1800. A breakout could be on the horizon triggered by the pending Fed minutes, US economic data, or even speeches by Fed officials. A move above $1800 would open the doors towards $1825. Alternatively, a selloff below $1770 is seen triggering a steeper move back towards $1740.


Forex-Time-LogoArticle by ForexTime

ForexTime Ltd (FXTM) is an award winning international online forex broker regulated by CySEC 185/12 www.forextime.com


Computer chips: while US and EU invest to challenge Asia, the UK industry is in mortal danger

By Andrew Johnston, Coventry University and Robert Huggins, Cardiff University 

US semiconductor giant Micron is to invest US$40 billion (£33 billion) during the 2020s in chip manufacturing in America, creating 40,000 jobs. This is on the back of incentives in the recent US Chips Act, which has also unlocked major investments from fellow US players Intel and Qualcomm.

The EU is also making moves to boost computer-chip manufacturing at home, having similarly decided to try and take share from Asia following the severe global semiconductor shortages over the past couple of years. Over 70% of chips are currently made in Asia, with precarious Taiwan particularly important, making around 90% of the world’s most advanced chips.

In the UK, however, successive governments have overlooked the importance of having a home-grown industry for this vital component, which underpins not only computers and smartphones, but also things like cars, planes, satellites and smart devices. There is a clear absence of any strategic plan, and no way of riding on the coattails of the EU following Brexit. So what needs to be done?

The new race for chips

Micron’s decision to announce such a large investment in the US is directly related to the Chips Act. The act provides US$200 billion to build and modernise American manufacturing facilities, as well as promoting research and development in semiconductor technologies, and promoting education in STEM subjects to develop the next generation of chip designers.

The US continues to control the majority of IP in semiconductors, but Asia’s dominant manufacturing capacity is rapidly growing on the back of investments from the likes of Taiwan’s TSMC and Foxconn, and South Korea-based Samsung. There is also a need to compete with China, which recently surprised the industry by demonstrating world-beating technology.

Semiconductor manufacturing and ownership by country (%)

Data is from 2019.
Semiconductor Industry Association

Earlier this year, the EU set out the scope of its own legislation to boost its share of production from 10% to 20% of the world total by 2030. It aims to promote “digital sovereignty” by supporting the development of new production facilities, supporting start-ups, developing skills and building partnerships. In total, the upcoming act should result in between €15 billion (£13 billion) and €43 billion (£36 billion) being invested in the sector.

The UK perspective

The UK once led the world in semiconductor manufacturing, with highly internationally innovative companies such as Plessey, Inmos, Acorn, Imagination Technologies and Cambridge Silicon Radio. There remain pockets of excellence and world-leading innovation, particularly in the design of semiconductors. Clusters in south Wales, the south west of England and east of England, for example, have a critical mass of activity. But they have lacked the necessary finance to upscale, and all the major investments elsewhere are putting the industry in an increasingly vulnerable position.

It’s not only the UK’s position in semiconductors that is under threat. A lack of capacity creates risks for the whole electronics supply chain, which could weaken the economy overall. For example UK car production has been severely curtailed by the recent chip shortages.

To avoid such problems, the UK needs to pass a Chips Act of its own. This would aim to kick-start the industry by incentivising investment in manufacturing facilities, called “fabs”. Some commentators have argued against this move, mainly due to the huge costs involved. But it would be money well spent to achieve digital sovereignty.

A UK act should incentivise investment both directly and indirectly. Direct funding would ensure increased manufacturing capacity by building new fabs or expanding and upgrading existing facilities, especially for chips related to sensors, power, consumer electronics and communication devices. The government could then also support the industry indirectly through policies such as tax credits for investing firms, land provision and support infrastructure.

Another priority should be to strengthen existing national competitive advantages around designing smaller chips with more efficient circuits and greater computing power. This would involve both improving the current generation of chips and developing new approaches such as “beyond CMOS” technologies, which promise faster and more dense chips but crucially with a lower energy requirement. Providing R&D grants or guaranteeing loans to explore, test and consolidate new designs would help to return the UK to the forefront of developments in the sector.

University funding

Finally, the UK needs to harness the knowledge and research expertise around design and manufacturing within its universities. This is spread around various institutions, including the universities of Cardiff and Swansea in Wales; Strathclyde and Edinburgh in Scotland; Queen’s University Belfast in Northern Ireland, which has its own foundry; and the University of Sheffield in England.

The UK government has funded over £1 billion of university research into semiconductors since 2006, but the US and EU chips acts highlight just how much more is required. There is also a need to focus university funding on commercial outcomes that will translate into sales and increase the UK’s market share. Brexit has limited funding opportunities by raising uncertainties about the UK’s future involvement in the European “Horizon” scheme, which is the EU’s main R&D funding programme. It may therefore require a national replacement.

Clearly, the national outlay to deal with COVID and the current cost of living crisis will constrain potential government investments in the coming years. But the recent semiconductor shortages have also made clear that a degree of self-sufficiency in this key enabling technology will be vital to ensuring economic resiliency in a highly volatile and unpredictable world.The Conversation

About the Author:

Andrew Johnston, Professor of Innovation and Entrepreneurship, Coventry University and Robert Huggins, Professor of Economic Geography, Cardiff University

This article is republished from The Conversation under a Creative Commons license. Read the original article.


Energy crisis: why French households are largely protected from soaring costs while British families struggle

By Renaud Foucart, Lancaster University 

British households are bracing for a winter of massive energy price increases. The average annual bill is forecast to rise above £4,000, which is more than three times what Britons were paying just 12 months ago.

French households, meanwhile, will barely see their costs increase. Their government has frozen gas prices and limited the increase of the regulated price of electricity to an annual 4%. The total impact of the cost of living squeeze from higher energy prices this year will remain well below 5% of consumption for all French households. For the poorest 20% of UK households, it could be more than 15%.

The difference between two neighbouring countries with interconnected electricity grids is staggering. As part of my ongoing research into market regulation and the systems used to allocate commodities such as electricity, I look at how economic models can help us to understand policy problems. Most recently, I’ve been researching the French power market and comparing it to other models such as those of the UK.

By reflecting the actual market price of electricity generation, the Great Britain’s model (Northern Ireland operates on a different system) forces consumers to reduce consumption and encourages investment in production. In contrast, the French approach uses a mixture of subsidies by the government and a public energy company, which costs taxpayers billions and postpones big decisions on energy efficiency and investment in future production.

But while the GB power market is certainly more efficient when it comes to energy consumption and production, the upcoming crisis shows it is far from perfect. To ensure all homes are heated this winter, the government faces a bold choice: sending billions in cash to households or learning some lessons from the neighbouring French market – even if it means sacrificing some efficiency.

Great Britain: free market, marginal pricing

UK energy regulator Ofgem determines the maximum price an energy provider can charge households for the gas and electricity they use. This price cap, designed to protect consumers from unfair rises, should also enable suppliers to buy energy on the wholesale market at cheaper prices to satisfy contracts with consumers and still make a profit.

Indeed, the wholesale price of energy is the main factor Ofgem uses to calculate the cap. This price varies depending on the type of power being purchased.

Under what’s called a marginal price model, cheaper sources such as renewables and nuclear are used to satisfy demand first. More expensive forms of power such as natural gas are brought in as demand increases, but demand is nearly always high enough to encourage gas generation.

And in free markets such as this, the most expensive unit consumed determines the price everyone pays. Since Russia invaded Ukraine in February 2022, the price of gas in the GB market has soared to more than six times prices a year ago.

Unfortunately, the price cap model has meant that recent soaring wholesale gas prices have affected both consumers and suppliers. While oil and gas producers report record profits due to rapidly rising prices, dozens of suppliers have gone bust paying these prices.

To reduce the risk of further supplier bankruptcies, Ofgem will now update the cap on a quarterly basis to enable suppliers to raise retail prices more in line with wholesale prices.

But recent rises have affected consumers. In the past, retail rates could be fixed well below the cap, but increased gas costs have pushed power prices up so much that these deals have disappeared.

Average annual fuel bills, 2012-2022

Line graph showing different types of energy bills increasing to meet the UK price cap set by Ofgem
The gap between GB energy bills and the price cap has narrowed in 2022.
Ofgem Retail Market Indicators, House of Commons research briefing, August 2022

Capping wholesale prices is not a solution. To avoid blackouts, energy companies must either produce or import every single unit demanded by their consumers. If producers cannot recoup the cost of production of the most expensive unit of energy, they will simply not deliver it.

High energy prices and the hope of future profits encourage investment in production. The UK, for instance, is consistently ranked as one of the most attractive countries for renewable energy development. Even so, the neighbouring French market is currently doing much better to protect its consumers.

France: nationalised production, price subsidies

On paper, the French system is also market-based: energy producers sell electricity to the firms that directly supply consumers, limited by a price cap. The big difference from Britain is that the French government forces majority state-owned monopoly producer EDF to offer more than a quarter of its production to suppliers at a huge discount on the current wholesale price.

Historically, this cheap energy comes from an ageing fleet of nuclear power plants. But recent issues have forced EDF to buy back some of the electricity it had already sold into the market at more expensive wholesale prices to resell to energy suppliers for less to satisfy its contracts with them.

Last January, the French government also asked EDF to increase the quantity of discounted electricity it offers to help French households cope with rising energy prices. Together with cuts in fuel taxes, this will ensure the French regulated price barely increases this year.

The French system is far from perfect, however. The significant cost to taxpayers is not transparent and electricity prices do not reflect the cost of the most expensive unit. The absence of market incentives has also prompted the government to re-nationalise EDF to ensure future investment in renewables and next generation nuclear power plants.

As a shorter-term measure to protect consumers, the country has also introduced restrictions on energy use, particularly since it expects wholesale prices way above what GB will pay due to nuclear production uncertainty. But at least French families know their houses will be warm enough this winter.

To ensure the same for its households, the British might consider becoming a little more French by subsidising electricity. Both of the Conservative Party leadership contenders have hinted they are willing to move in that direction by cutting VAT and green levies, but the price impact would be small. Much more subsidies would be needed to protect consumers.

Up until now, an alternative strategy has been to offer unconditional cash transfers, such as rebates on council tax and energy bills. Pursuing this strategy over the winter would preserve the efficiency of the GB market, but would be politically difficult and expensive. The IMF estimates the cash needed to compensate the 40% poorer household to be around 1.5% of GDP or more than £30 billion.

The GB power market is generally an ideal way to allocate consumption and production of electricity. But efficiency is not everything. A rich country that cannot warm its homes has failed its citizens and so further action is needed to ensure this does not happen this winter.The Conversation

About the Author:

Renaud Foucart, Senior Lecturer in Economics, Lancaster University Management School, Lancaster University

This article is republished from The Conversation under a Creative Commons license. Read the original article.


Murrey Math Lines 15.08.2022 (EURUSD, GBPUSD)

Article By RoboForex.com

EURUSD, “Euro vs US Dollar”

In the H4 chart, after breaking the 200-day Moving Average, EURUSD is trading below, thus indicating a descending tendency. In this case, the price is expected to test 3/8, break it, and then continue falling to reach the support at 2/8. Still, this scenario may no longer be valid if the price breaks 5/8 to the upside. After that, the instrument may reverse and grow towards the resistance at 6/8.

EURUSDH4
Risk Warning: the result of previous trading operations do not guarantee the same results in the future

As we can see in the M15 chart, the pair has broken the downside line of the VoltyChannel indicator and, as a result, may continue trading downwards.

EURUSD_M15
Risk Warning: the result of previous trading operations do not guarantee the same results in the future

GBPUSD, “Great Britain Pound vs US Dollar”

On the H4 chart, after breaking the 200-day Moving Average, GBPUSD is also trading below it to indicate a possible descending tendency. In this case, the price is expected to break 3/8 and continue falling to reach the support at 2/8. However, this scenario may no longer be valid if the price breaks the resistance at 4/8 to the upside. After that, the instrument may reverse and grow towards 5/8.

GBPUSD_H4
Risk Warning: the result of previous trading operations do not guarantee the same results in the future

As we can see in the M15 chart, the pair has broken the downside line of the VoltyChannel indicator and, as a result, may continue its decline to reach 2/8 from the H4 chart.

GBPUSD_M15

Article By RoboForex.com

Attention!
Forecasts presented in this section only reflect the author’s private opinion and should not be considered as guidance for trading. RoboForex LP bears no responsibility for trading results based on trading recommendations described in these analytical reviews.

Japanese Candlesticks Analysis 15.08.2022 (XAUUSD, NZDUSD, GBPUSD)

Article By RoboForex.com

XAUUSD, “Gold vs US Dollar”

As we can see in the H4 chart, XAUUSD has formed an Engulfing reversal pattern not far from the resistance area. At the moment, the asset may reverse in the form of a new descending impulse. In this case, the downside target may be at 1780.50. At the same time, the opposite scenario implies that the price may grow to reach 1815.00 without testing the support level.

XAUUSD
Risk Warning: the result of previous trading operations do not guarantee the same results in the future

NZDUSD, “New Zealand vs US Dollar”

As we can see in the H4 chart, NZDUSD has formed a Harami reversal pattern close to the resistance area. At the moment, the asset is reversing in the form of another descending impulse. In this case, the downside correctional target may be at 0.6385. After that, the asset may rebound from the support level and resume moving upwards. However, an alternative scenario implies that the price may grow to reach 0.6475 without any pullbacks down to the support level.

NZDUSD
Risk Warning: the result of previous trading operations do not guarantee the same results in the future

GBPUSD, “Great Britain Pound vs US Dollar”

As we can see in the H4 chart, GBPUSD has formed a Harami reversal pattern near the support level. At the moment, the pair may reverse in the form of a new ascending impulse. In this case, the upside target may be the resistance area at 1.2255. Later, the market may break this level and continue growing. Still, there might be an alternative scenario, in which the asset may correct to reach the support level at 1.2075 first and then resume the ascending tendency.

GBPUSD

Article By RoboForex.com

Attention!
Forecasts presented in this section only reflect the author’s private opinion and should not be considered as guidance for trading. RoboForex LP bears no responsibility for trading results based on trading recommendations described in these analytical reviews.

Trade Of The Week: Are Dollar Bulls Running On Empty Fumes?

By ForexTime 

– Dollar bulls dominated the FX space during the first half of 2022, trampling any obstacles that came their way. G10 currencies were practically flattened by the greenback’s might with the pound shedding 10% and yen over 15%.

But the scales of power seem to be veering in favour of bears in Q3 as the fundamental drivers shift. This can be reflected in the currency’s mixed performance since the start of July.

After reaching its highest level since mid-2002 back in July, the Dollar Index (DXY) has found itself vulnerable to losses thanks to profit-taking. Reduced bets over how aggressive the Fed will be on rate hikes and signs of easing inflationary pressures also capped upside gains.

Taking a quick look at the equally weighted dollar index, prices staged a rebound this morning as disappointing data from China fuelled global recession fears. Nevertheless, the trend still favours bears due to the consistently lower lows and lower highs.

With inflation cooling in the largest economy in the world and investors cutting rate hike bets, USD bulls may be in trouble. However, recession fears and geopolitical risks could send investors rushing toward the dollar which acts as a beacon of safety in times of uncertainty.

So, are dollar bulls are running on empty fumes or taking a break before switching to higher gear? While we may not get the answer this week, the pending FOMC meeting minutes, US economic data, and speeches from Fed officials could offer fresh insight.

The low down…

There were three major drivers behind the dollar’s appreciation this year.

  1. Interest rates
  2. Strength of the US economy
  3. Dollar’s safe-haven status

The Fed’s aggressive approach towards rising interest rates in the face of soaring inflation sent the dollar rallying as rate differentials widened against other currencies. As investors looked at the strength of the US economy, relative to others this also boosted appetite for the greenback. Lastly, geopolitical risks, global growth concerns, and overall uncertainty sent market players rushing toward the world’s reserve currency.

Fast forward to today, signs of easing inflationary pressures have prompted investors to cut bets on how aggressive the Fed will be in raising interest rates. The latest CPI figures revealed inflation cooled 8.5% in July compared to the 8.7% expected and a significant drop from the 9.1% increase in June. In regards to the US economy, it contracted for the second straight quarter in Q2, signalling an unofficial start of recession, further dampening appetite for the dollar. Given the unfavourable macroeconomic environment and geopolitics at play, investors remain cautious and this could result in increased appetite for the safe-haven dollar. All in all, when considering how 2/3 of the major drivers powering the dollar have weakened, this could encourage bears to pounce.

The week ahead…

It could be a volatile week for the dollar thanks to the pending US reports and speeches from Fed officials.

However, all eyes will be on the Federal Reserve meeting minutes on Wednesday. This will be closely scrutinized by investors for any fresh clues and insight into what policymakers were thinking when rates were hiked by 75 basis points for a second straight meeting. If the minutes sound hawkish, this could offer the dollar some support. On the flip side, any hint of doves may encourage some fresh dollar weakness. It will be wise to keep an eye on the US retail sales report for July published mid-week and speeches by Kansas City Fed President Esther George and Minneapolis Fed President Neel Kashkari on Thursday.

Dollar to resume decline?

After breaking out of the weekly bearish channel, the equally weighted dollar index could be gearing for steeper declines.

Prices turned bearish after securing a solid weekly close below 1.1700. Sustained weakness under this level could trigger a selloff towards 1.1380.

Should 1.1700 prove to be reliable support, a move back towards 1.1900 could be on the cards.

On the daily charts, prices punched higher this morning thanks to fundamental forces but the technical picture still favours bears. A move back below 1.1700 could suggest a decline towards 1.1630 and 1.1450. Should 1.1700 prove to be reliable support, prices may test the 50-day Simple Moving Average and 1.1950, respectively.


Forex-Time-LogoArticle by ForexTime

ForexTime Ltd (FXTM) is an award winning international online forex broker regulated by CySEC 185/12 www.forextime.com