By InvestMacro | COT | Data Tables | COT Leaders | Downloads | COT Newsletter
Here are the latest charts and statistics for the Commitment of Traders (COT) data published by the Commodities Futures Trading Commission (CFTC).
The latest COT Reports data is updated through Tuesday August 30th and shows a quick view of how large traders (for-profit speculators and commercial entities) were positioned in the futures markets. All currency positions are in direct relation to the US dollar where, for example, a bet for the euro is a bet that the euro will rise versus the dollar while a bet against the euro will be a bet that the euro will decline versus the dollar.
Australian dollar, Brazilian Real lead the Weekly Speculator Changes
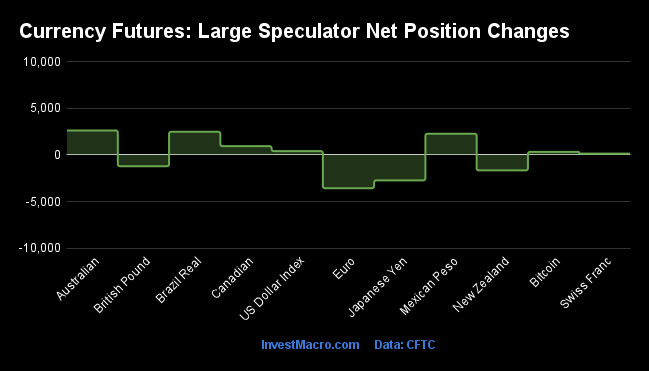
The COT currency market speculator bets were mostly higher this week as seven out of the eleven currency markets we cover had higher positioning while the other four markets had lower speculator contracts.
Leading the gains for the currency markets was the Australian dollar (2,635 contracts) with the Brazilian real (2,494 contracts), Mexican peso (2,286 contracts), Canadian dollar (952 contracts), US Dollar Index (416 contracts), Bitcoin (332 contracts) and the Swiss franc (143 contracts) also having higher bets on the week.
The currencies leading the declines in speculator bets this week were the Euro (-3,567 contracts) and the Japanese yen (-2,724 contracts) with the New Zealand dollar (-1,650 contracts) and the British pound sterling (-1,204 contracts) also registering lower bets on the week.
Currency Speculator Positioning Notes:
Highlighting the COT Reports (Week 35) changes this week was the Brazilian real’s gains in speculator bets. The Brazilian currency has now seen higher bullish bets in three out of the past four weeks and in five out of the past seven weeks as well. Speculators had previous strong sentiment for the real in February and March with bullish bets hitting an all-time record high in March above the +50,000 contracts level. However, the bullish strength only last a few months as sharp declines hit the real in July and resulted in a net bearish position of -1,130 contracts on August 2nd. Since then, speculators have started to build back their bullish positions and pushed the current standing to +8,859 contracts this week.
Australian dollar contracts rose this week but are looking like just a small rebound after a long bearish streak. The Aussie speculator bets had fallen for six straight weeks and pushed the overall net position to the most bearish level since March 8th, a span of twenty-four weeks. Overall, the Australian dollar’s speculative position has now been in a bearish standing for sixty-seven straight weeks, dating back to May 25th of 2021.
The Swiss franc speculator positions this week improved for a fourth consecutive week and are now at the least bearish level in just about a year. The overall net standing for the franc has been in a bearish position for fifty-one straight weeks, dating back to September 14th of last year.
Finally, the Euro net speculator position declined for a third consecutive week this week and has fallen by a total of -13,140 contracts over that time-frame. These declines have dropped the Euro’s net standing, currently at -47,676 contracts, to the most bearish level in the past one hundred and thirty weeks, dating back to March 10th of 2020. The EUR/USD exchange rate has fallen back to below parity after testing these levels in July. The currency pair currently trades near 20-year lows and closed the week at the 0.9956 exchange rate.
| Aug-30-2022 | OI | OI-Index | Spec-Net | Spec-Index | Com-Net | COM-Index | Smalls-Net | Smalls-Index |
|---|
| USD Index | 60,184 | 89 | 35,515 | 84 | -38,538 | 15 | 3,023 | 50 |
| EUR | 720,081 | 90 | -47,676 | 20 | 28,860 | 84 | 18,816 | 6 |
| GBP | 262,004 | 85 | -29,170 | 49 | 51,498 | 63 | -22,328 | 0 |
| JPY | 247,030 | 87 | -41,531 | 43 | 61,287 | 66 | -19,756 | 13 |
| CHF | 47,168 | 35 | -2,262 | 51 | 15,471 | 68 | -13,209 | 13 |
| CAD | 158,165 | 36 | 24,179 | 67 | -29,039 | 45 | 4,860 | 40 |
| AUD | 169,267 | 59 | -57,393 | 32 | 62,503 | 66 | -5,110 | 40 |
| NZD | 44,376 | 33 | -3,124 | 66 | 6,533 | 40 | -3,409 | 12 |
| MXN | 206,823 | 52 | -29,030 | 15 | 25,765 | 84 | 3,265 | 57 |
| RUB | 20,930 | 4 | 7,543 | 31 | -7,150 | 69 | -393 | 24 |
| BRL | 66,706 | 63 | 8,859 | 59 | -10,922 | 41 | 2,063 | 89 |
| Bitcoin | 14,440 | 84 | 1,296 | 100 | -1,327 | 0 | 31 | 14 |
Bitcoin and US Dollar Index lead the Strength Scores
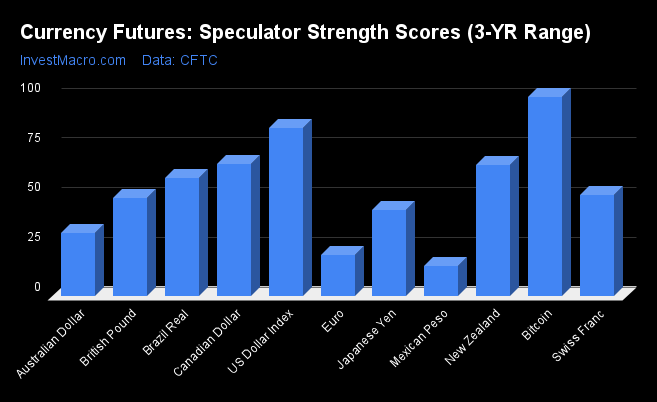
Strength Scores (a normalized measure of Speculator positions over a 3-Year range, from 0 to 100 where above 80 is extreme bullish and below 20 is extreme bearish) showed that Bitcoin Futures (100.0 percent) and the US Dollar Index (84.2 percent) lead the currency markets and are both in bullish extreme positions (above 80 percent). The Canadian Dollar (66.5 percent) and the New Zealand Dollar (66.0 percent) come in as the next highest in the currency markets in strength scores.
On the downside, the Mexican Peso (15.0 percent) comes in at the lowest strength level currently and is in a bearish extreme level (below 20 percent). The next lowest is the Euro (20.4 percent) followed by the Australian Dollar (31.6 percent) and the Japanese Yen (43.3 percent).
Strength Statistics:
US Dollar Index (84.2 percent) vs US Dollar Index previous week (83.5 percent)
EuroFX (20.4 percent) vs EuroFX previous week (21.5 percent)
British Pound Sterling (49.1 percent) vs British Pound Sterling previous week (50.1 percent)
Japanese Yen (43.3 percent) vs Japanese Yen previous week (45.0 percent)
Swiss Franc (50.8 percent) vs Swiss Franc previous week (50.4 percent)
Canadian Dollar (66.5 percent) vs Canadian Dollar previous week (65.4 percent)
Australian Dollar (31.6 percent) vs Australian Dollar previous week (29.2 percent)
New Zealand Dollar (66.0 percent) vs New Zealand Dollar previous week (68.8 percent)
Mexican Peso (15.0 percent) vs Mexican Peso previous week (14.0 percent)
Brazil Real (59.1 percent) vs Brazil Real previous week (56.6 percent)
Bitcoin (100.0 percent) vs Bitcoin previous week (94.2 percent)
Bitcoin, Swiss Franc and British Pound lead the 6-Week Strength Trends
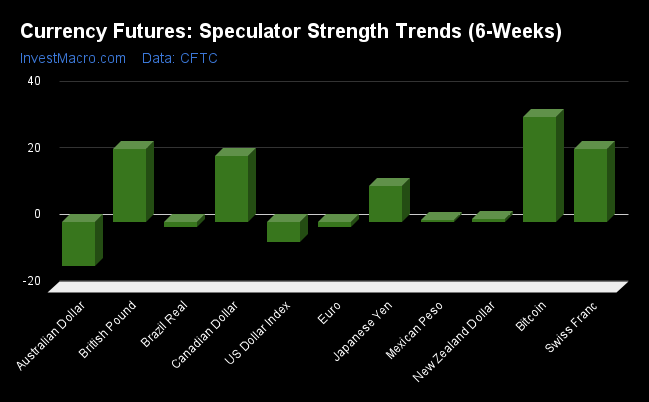
Strength Score Trends (or move index, calculates the 6-week changes in strength scores) show that Bitcoin (31.6 percent) leads the past six weeks trends for the currency markets this week. The Swiss Franc (21.9 percent), the British Pound Sterling (21.9 percent) and the Canadian Dollar (19.7 percent) fill out the other top movers in the latest trends data.
The Australian Dollar (-13.2 percent) leads the downside trend scores currently while the next market with lower trend scores were the US Dollar Index (-5.9 percent) followed by the Euro (-1.5 percent).
Strength Trend Statistics:
US Dollar Index (-5.9 percent) vs US Dollar Index previous week (-5.4 percent)
EuroFX (-1.5 percent) vs EuroFX previous week (-5.8 percent)
British Pound Sterling (21.9 percent) vs British Pound Sterling previous week (24.3 percent)
Japanese Yen (10.9 percent) vs Japanese Yen previous week (13.1 percent)
Swiss Franc (21.9 percent) vs Swiss Franc previous week (16.0 percent)
Canadian Dollar (19.7 percent) vs Canadian Dollar previous week (22.1 percent)
Australian Dollar (-13.2 percent) vs Australian Dollar previous week (-17.1 percent)
New Zealand Dollar (0.9 percent) vs New Zealand Dollar previous week (6.4 percent)
Mexican Peso (0.7 percent) vs Mexican Peso previous week (-3.4 percent)
Brazil Real (-1.6 percent) vs Brazil Real previous week (-3.8 percent)
Bitcoin (31.6 percent) vs Bitcoin previous week (19.9 percent)
Individual Markets:
US Dollar Index Futures:
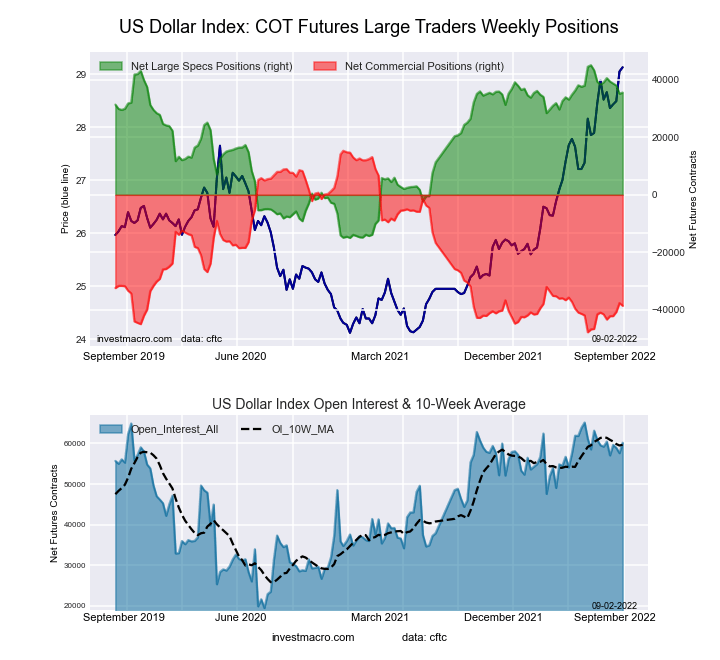 The US Dollar Index large speculator standing this week came in at a net position of 35,515 contracts in the data reported through Tuesday. This was a weekly lift of 416 contracts from the previous week which had a total of 35,099 net contracts.
This week’s current strength score (the trader positioning range over the past three years, measured from 0 to 100) shows the speculators are currently Bullish-Extreme with a score of 84.2 percent. The commercials are Bearish-Extreme with a score of 14.6 percent and the small traders (not shown in chart) are Bearish with a score of 49.6 percent.
| US DOLLAR INDEX Statistics | SPECULATORS | COMMERCIALS | SMALL TRADERS |
| – Percent of Open Interest Longs: | 85.9 | 3.0 | 9.0 |
| – Percent of Open Interest Shorts: | 26.8 | 67.1 | 4.0 |
| – Net Position: | 35,515 | -38,538 | 3,023 |
| – Gross Longs: | 51,672 | 1,822 | 5,431 |
| – Gross Shorts: | 16,157 | 40,360 | 2,408 |
| – Long to Short Ratio: | 3.2 to 1 | 0.0 to 1 | 2.3 to 1 |
| NET POSITION TREND: | | | |
| – Strength Index Score (3 Year Range Pct): | 84.2 | 14.6 | 49.6 |
| – Strength Index Reading (3 Year Range): | Bullish-Extreme | Bearish-Extreme | Bearish |
| NET POSITION MOVEMENT INDEX: | | | |
| – 6-Week Change in Strength Index: | -5.9 | 4.7 | 6.5 |
Euro Currency Futures:
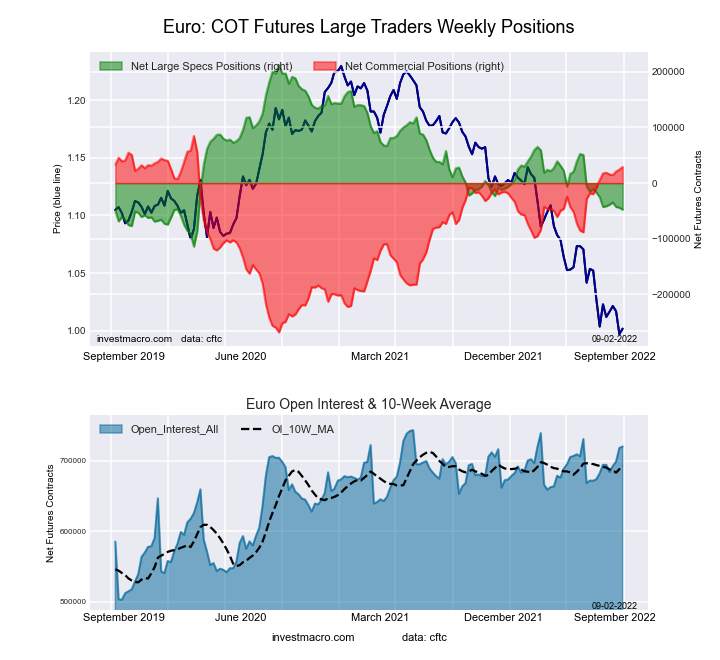 The Euro Currency large speculator standing this week came in at a net position of -47,676 contracts in the data reported through Tuesday. This was a weekly fall of -3,567 contracts from the previous week which had a total of -44,109 net contracts.
This week’s current strength score (the trader positioning range over the past three years, measured from 0 to 100) shows the speculators are currently Bearish with a score of 20.4 percent. The commercials are Bullish-Extreme with a score of 84.2 percent and the small traders (not shown in chart) are Bearish-Extreme with a score of 5.6 percent.
| EURO Currency Statistics | SPECULATORS | COMMERCIALS | SMALL TRADERS |
| – Percent of Open Interest Longs: | 28.1 | 57.2 | 11.2 |
| – Percent of Open Interest Shorts: | 34.7 | 53.2 | 8.6 |
| – Net Position: | -47,676 | 28,860 | 18,816 |
| – Gross Longs: | 202,258 | 411,684 | 80,871 |
| – Gross Shorts: | 249,934 | 382,824 | 62,055 |
| – Long to Short Ratio: | 0.8 to 1 | 1.1 to 1 | 1.3 to 1 |
| NET POSITION TREND: | | | |
| – Strength Index Score (3 Year Range Pct): | 20.4 | 84.2 | 5.6 |
| – Strength Index Reading (3 Year Range): | Bearish | Bullish-Extreme | Bearish-Extreme |
| NET POSITION MOVEMENT INDEX: | | | |
| – 6-Week Change in Strength Index: | -1.5 | 3.2 | -10.8 |
British Pound Sterling Futures:
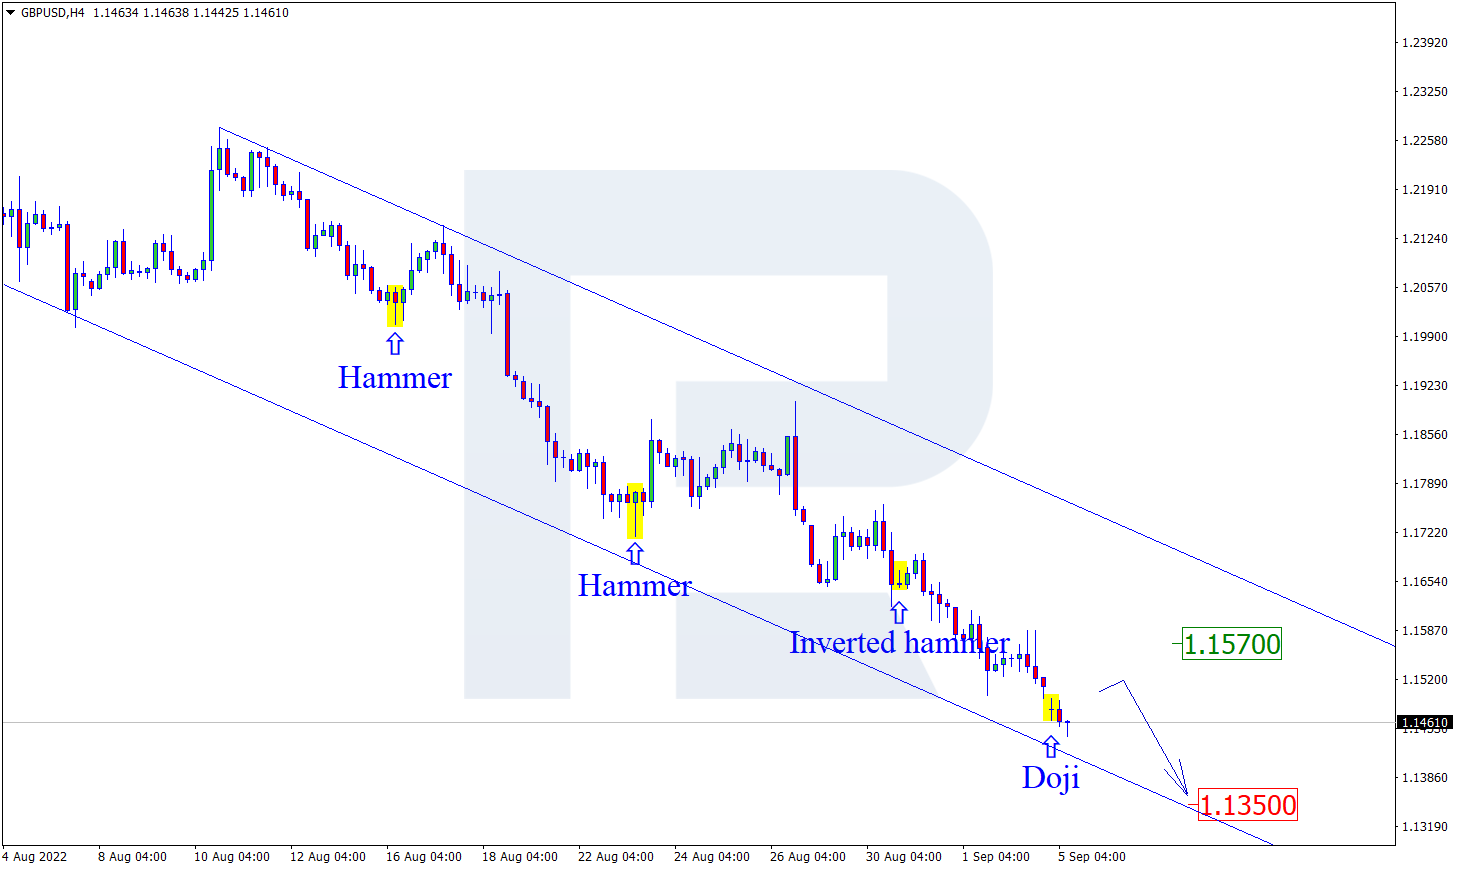
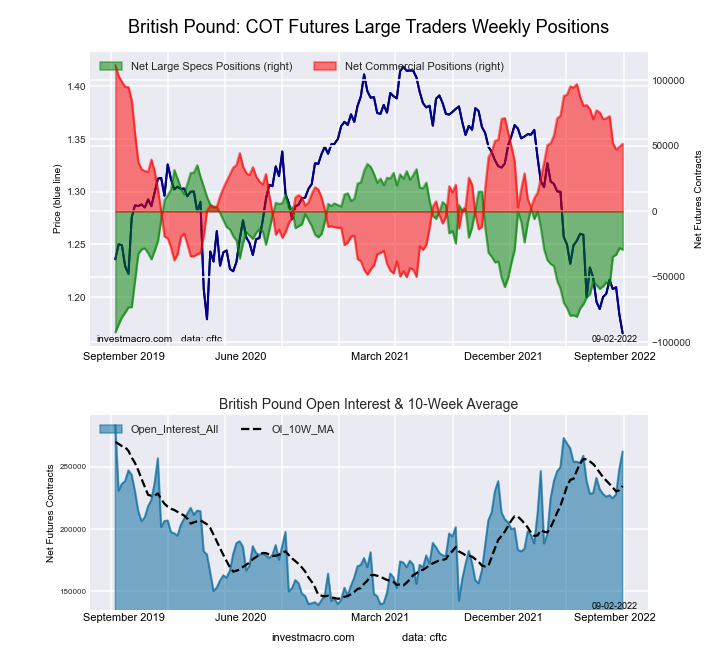 The British Pound Sterling large speculator standing this week came in at a net position of -29,170 contracts in the data reported through Tuesday. This was a weekly lowering of -1,204 contracts from the previous week which had a total of -27,966 net contracts.
This week’s current strength score (the trader positioning range over the past three years, measured from 0 to 100) shows the speculators are currently Bearish with a score of 49.1 percent. The commercials are Bullish with a score of 62.9 percent and the small traders (not shown in chart) are Bearish-Extreme with a score of 0.0 percent.
| BRITISH POUND Statistics | SPECULATORS | COMMERCIALS | SMALL TRADERS |
| – Percent of Open Interest Longs: | 22.3 | 66.0 | 7.1 |
| – Percent of Open Interest Shorts: | 33.5 | 46.3 | 15.7 |
| – Net Position: | -29,170 | 51,498 | -22,328 |
| – Gross Longs: | 58,477 | 172,796 | 18,706 |
| – Gross Shorts: | 87,647 | 121,298 | 41,034 |
| – Long to Short Ratio: | 0.7 to 1 | 1.4 to 1 | 0.5 to 1 |
| NET POSITION TREND: | | | |
| – Strength Index Score (3 Year Range Pct): | 49.1 | 62.9 | 0.0 |
| – Strength Index Reading (3 Year Range): | Bearish | Bullish | Bearish-Extreme |
| NET POSITION MOVEMENT INDEX: | | | |
| – 6-Week Change in Strength Index: | 21.9 | -11.6 | -21.2 |
Japanese Yen Futures:
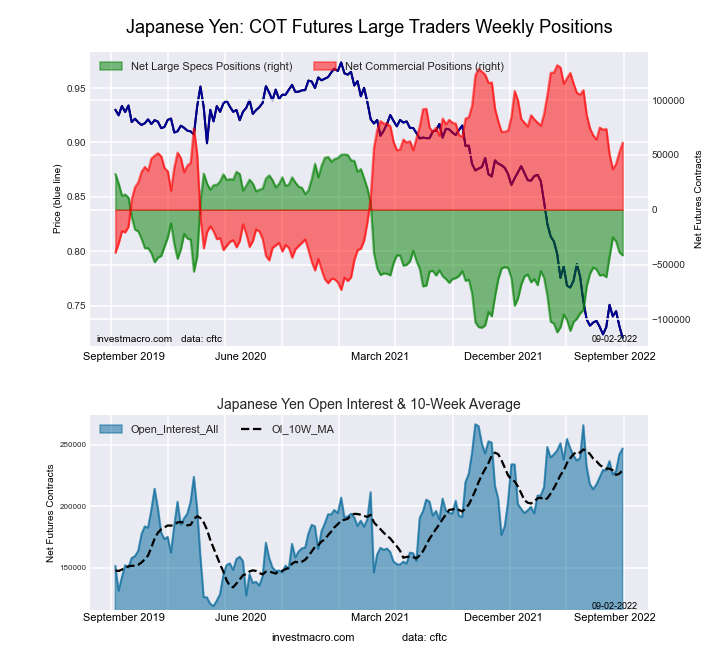 The Japanese Yen large speculator standing this week came in at a net position of -41,531 contracts in the data reported through Tuesday. This was a weekly lowering of -2,724 contracts from the previous week which had a total of -38,807 net contracts.
This week’s current strength score (the trader positioning range over the past three years, measured from 0 to 100) shows the speculators are currently Bearish with a score of 43.3 percent. The commercials are Bullish with a score of 65.6 percent and the small traders (not shown in chart) are Bearish-Extreme with a score of 13.3 percent.
| JAPANESE YEN Statistics | SPECULATORS | COMMERCIALS | SMALL TRADERS |
| – Percent of Open Interest Longs: | 22.1 | 66.4 | 8.7 |
| – Percent of Open Interest Shorts: | 38.9 | 41.6 | 16.7 |
| – Net Position: | -41,531 | 61,287 | -19,756 |
| – Gross Longs: | 54,513 | 163,991 | 21,436 |
| – Gross Shorts: | 96,044 | 102,704 | 41,192 |
| – Long to Short Ratio: | 0.6 to 1 | 1.6 to 1 | 0.5 to 1 |
| NET POSITION TREND: | | | |
| – Strength Index Score (3 Year Range Pct): | 43.3 | 65.6 | 13.3 |
| – Strength Index Reading (3 Year Range): | Bearish | Bullish | Bearish-Extreme |
| NET POSITION MOVEMENT INDEX: | | | |
| – 6-Week Change in Strength Index: | 10.9 | -5.8 | -12.0 |
Swiss Franc Futures:
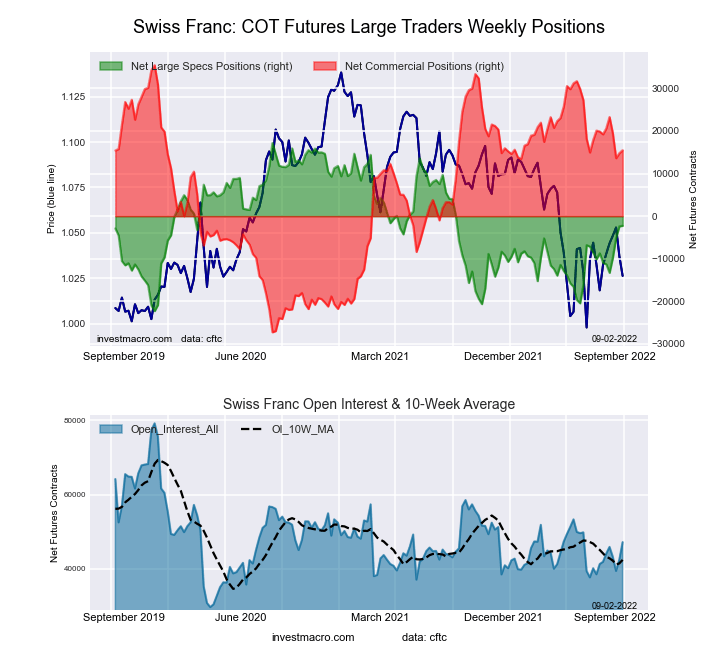 The Swiss Franc large speculator standing this week came in at a net position of -2,262 contracts in the data reported through Tuesday. This was a weekly lift of 143 contracts from the previous week which had a total of -2,405 net contracts.
This week’s current strength score (the trader positioning range over the past three years, measured from 0 to 100) shows the speculators are currently Bullish with a score of 50.8 percent. The commercials are Bullish with a score of 68.2 percent and the small traders (not shown in chart) are Bearish-Extreme with a score of 12.8 percent.
| SWISS FRANC Statistics | SPECULATORS | COMMERCIALS | SMALL TRADERS |
| – Percent of Open Interest Longs: | 25.3 | 57.5 | 16.8 |
| – Percent of Open Interest Shorts: | 30.1 | 24.7 | 44.8 |
| – Net Position: | -2,262 | 15,471 | -13,209 |
| – Gross Longs: | 11,915 | 27,113 | 7,906 |
| – Gross Shorts: | 14,177 | 11,642 | 21,115 |
| – Long to Short Ratio: | 0.8 to 1 | 2.3 to 1 | 0.4 to 1 |
| NET POSITION TREND: | | | |
| – Strength Index Score (3 Year Range Pct): | 50.8 | 68.2 | 12.8 |
| – Strength Index Reading (3 Year Range): | Bullish | Bullish | Bearish-Extreme |
| NET POSITION MOVEMENT INDEX: | | | |
| – 6-Week Change in Strength Index: | 21.9 | -6.0 | -16.6 |
Canadian Dollar Futures:
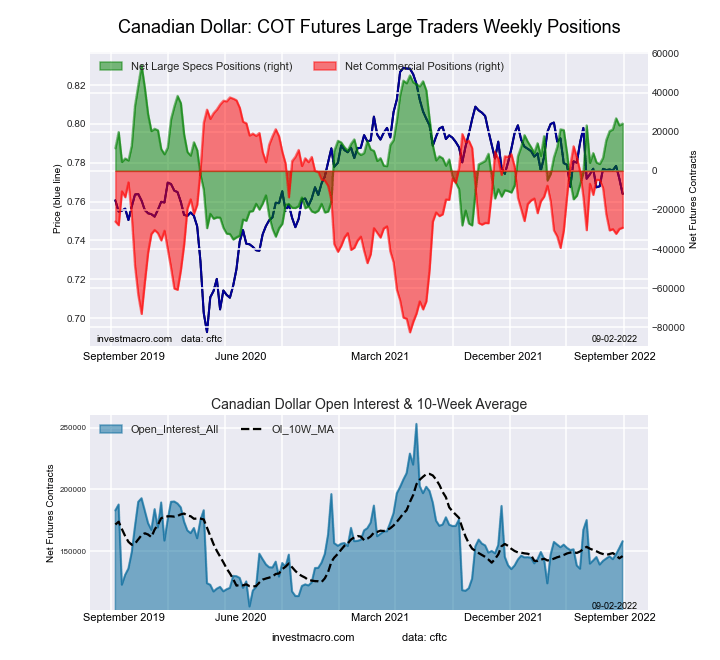 The Canadian Dollar large speculator standing this week came in at a net position of 24,179 contracts in the data reported through Tuesday. This was a weekly gain of 952 contracts from the previous week which had a total of 23,227 net contracts.
This week’s current strength score (the trader positioning range over the past three years, measured from 0 to 100) shows the speculators are currently Bullish with a score of 66.5 percent. The commercials are Bearish with a score of 44.5 percent and the small traders (not shown in chart) are Bearish with a score of 39.9 percent.
| CANADIAN DOLLAR Statistics | SPECULATORS | COMMERCIALS | SMALL TRADERS |
| – Percent of Open Interest Longs: | 37.1 | 39.1 | 22.1 |
| – Percent of Open Interest Shorts: | 21.8 | 57.4 | 19.1 |
| – Net Position: | 24,179 | -29,039 | 4,860 |
| – Gross Longs: | 58,704 | 61,821 | 35,000 |
| – Gross Shorts: | 34,525 | 90,860 | 30,140 |
| – Long to Short Ratio: | 1.7 to 1 | 0.7 to 1 | 1.2 to 1 |
| NET POSITION TREND: | | | |
| – Strength Index Score (3 Year Range Pct): | 66.5 | 44.5 | 39.9 |
| – Strength Index Reading (3 Year Range): | Bullish | Bearish | Bearish |
| NET POSITION MOVEMENT INDEX: | | | |
| – 6-Week Change in Strength Index: | 19.7 | -16.9 | 5.6 |
Australian Dollar Futures:
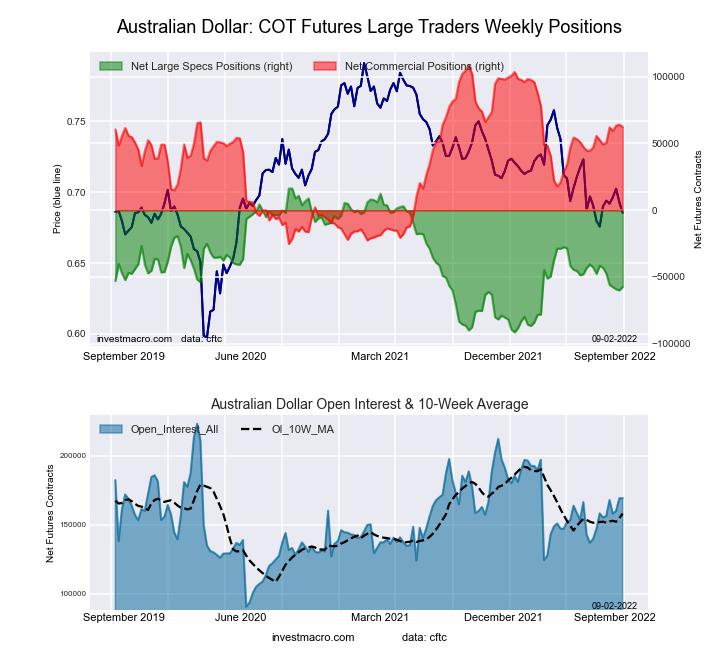 The Australian Dollar large speculator standing this week came in at a net position of -57,393 contracts in the data reported through Tuesday. This was a weekly rise of 2,635 contracts from the previous week which had a total of -60,028 net contracts.
This week’s current strength score (the trader positioning range over the past three years, measured from 0 to 100) shows the speculators are currently Bearish with a score of 31.6 percent. The commercials are Bullish with a score of 65.5 percent and the small traders (not shown in chart) are Bearish with a score of 40.0 percent.
| AUSTRALIAN DOLLAR Statistics | SPECULATORS | COMMERCIALS | SMALL TRADERS |
| – Percent of Open Interest Longs: | 18.5 | 67.9 | 11.1 |
| – Percent of Open Interest Shorts: | 52.4 | 31.0 | 14.1 |
| – Net Position: | -57,393 | 62,503 | -5,110 |
| – Gross Longs: | 31,304 | 114,957 | 18,758 |
| – Gross Shorts: | 88,697 | 52,454 | 23,868 |
| – Long to Short Ratio: | 0.4 to 1 | 2.2 to 1 | 0.8 to 1 |
| NET POSITION TREND: | | | |
| – Strength Index Score (3 Year Range Pct): | 31.6 | 65.5 | 40.0 |
| – Strength Index Reading (3 Year Range): | Bearish | Bullish | Bearish |
| NET POSITION MOVEMENT INDEX: | | | |
| – 6-Week Change in Strength Index: | -13.2 | 9.9 | 2.5 |
New Zealand Dollar Futures:
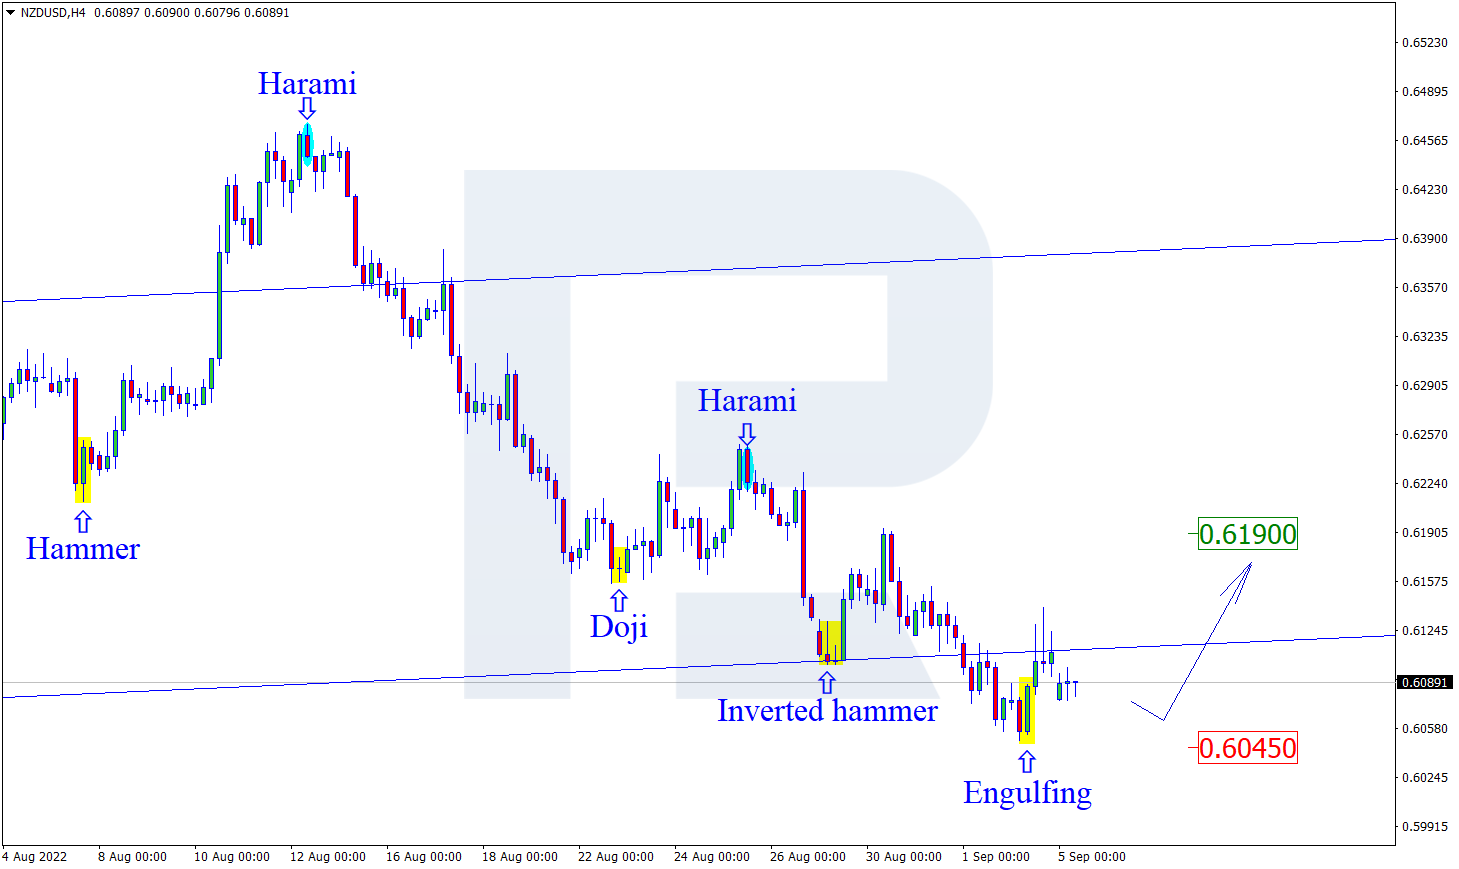
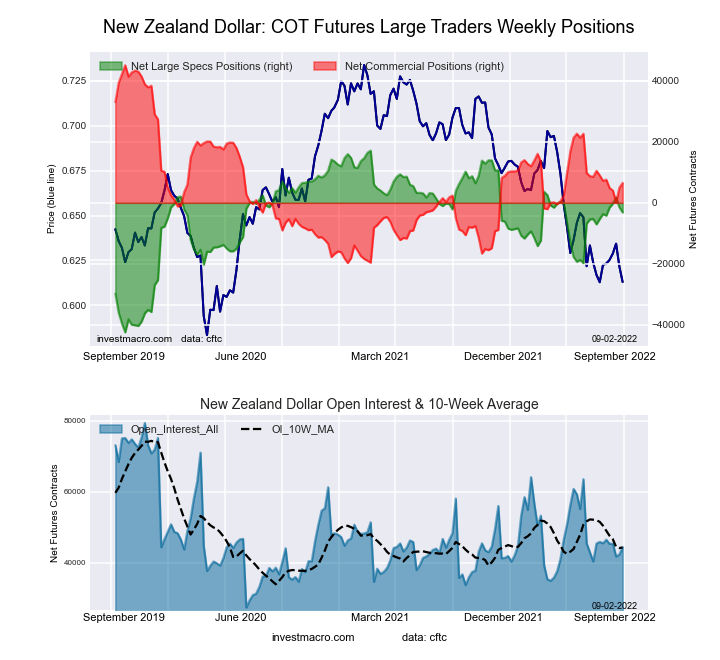 The New Zealand Dollar large speculator standing this week came in at a net position of -3,124 contracts in the data reported through Tuesday. This was a weekly decline of -1,650 contracts from the previous week which had a total of -1,474 net contracts.
This week’s current strength score (the trader positioning range over the past three years, measured from 0 to 100) shows the speculators are currently Bullish with a score of 66.0 percent. The commercials are Bearish with a score of 40.5 percent and the small traders (not shown in chart) are Bearish-Extreme with a score of 12.5 percent.
| NEW ZEALAND DOLLAR Statistics | SPECULATORS | COMMERCIALS | SMALL TRADERS |
| – Percent of Open Interest Longs: | 37.0 | 56.0 | 5.1 |
| – Percent of Open Interest Shorts: | 44.0 | 41.3 | 12.8 |
| – Net Position: | -3,124 | 6,533 | -3,409 |
| – Gross Longs: | 16,407 | 24,861 | 2,266 |
| – Gross Shorts: | 19,531 | 18,328 | 5,675 |
| – Long to Short Ratio: | 0.8 to 1 | 1.4 to 1 | 0.4 to 1 |
| NET POSITION TREND: | | | |
| – Strength Index Score (3 Year Range Pct): | 66.0 | 40.5 | 12.5 |
| – Strength Index Reading (3 Year Range): | Bullish | Bearish | Bearish-Extreme |
| NET POSITION MOVEMENT INDEX: | | | |
| – 6-Week Change in Strength Index: | 0.9 | -1.1 | 1.7 |
Mexican Peso Futures:
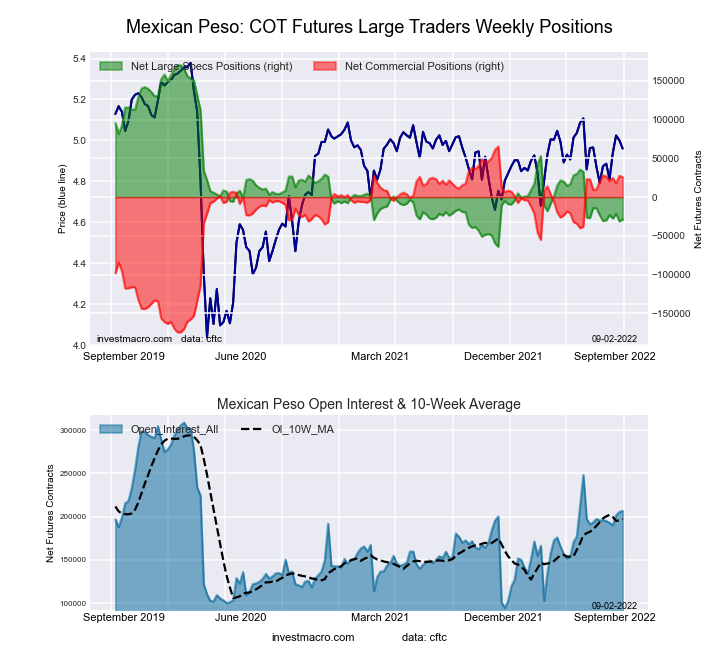 The Mexican Peso large speculator standing this week came in at a net position of -29,030 contracts in the data reported through Tuesday. This was a weekly increase of 2,286 contracts from the previous week which had a total of -31,316 net contracts.
This week’s current strength score (the trader positioning range over the past three years, measured from 0 to 100) shows the speculators are currently Bearish-Extreme with a score of 15.0 percent. The commercials are Bullish-Extreme with a score of 83.5 percent and the small traders (not shown in chart) are Bullish with a score of 56.9 percent.
| MEXICAN PESO Statistics | SPECULATORS | COMMERCIALS | SMALL TRADERS |
| – Percent of Open Interest Longs: | 50.1 | 46.0 | 3.1 |
| – Percent of Open Interest Shorts: | 64.1 | 33.5 | 1.5 |
| – Net Position: | -29,030 | 25,765 | 3,265 |
| – Gross Longs: | 103,623 | 95,098 | 6,441 |
| – Gross Shorts: | 132,653 | 69,333 | 3,176 |
| – Long to Short Ratio: | 0.8 to 1 | 1.4 to 1 | 2.0 to 1 |
| NET POSITION TREND: | | | |
| – Strength Index Score (3 Year Range Pct): | 15.0 | 83.5 | 56.9 |
| – Strength Index Reading (3 Year Range): | Bearish-Extreme | Bullish-Extreme | Bullish |
| NET POSITION MOVEMENT INDEX: | | | |
| – 6-Week Change in Strength Index: | 0.7 | -0.9 | 1.7 |
Brazilian Real Futures:
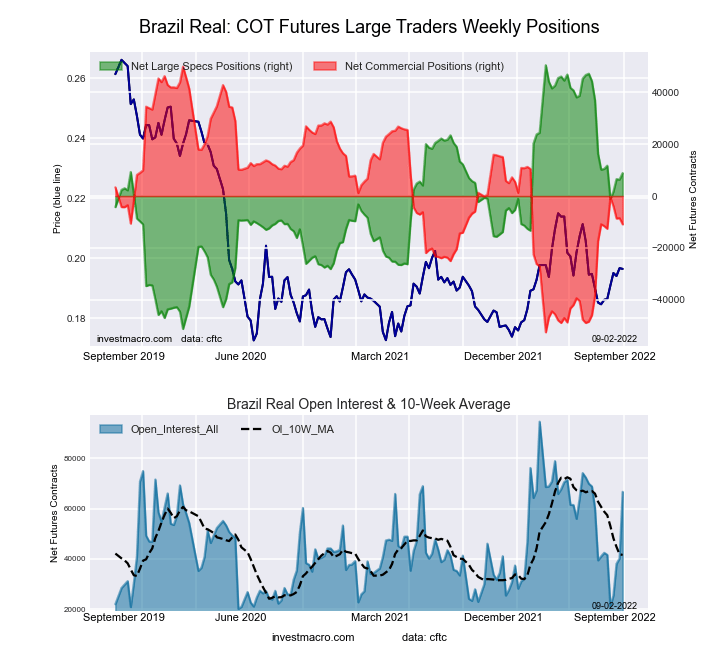 The Brazilian Real large speculator standing this week came in at a net position of 8,859 contracts in the data reported through Tuesday. This was a weekly advance of 2,494 contracts from the previous week which had a total of 6,365 net contracts.
This week’s current strength score (the trader positioning range over the past three years, measured from 0 to 100) shows the speculators are currently Bullish with a score of 59.1 percent. The commercials are Bearish with a score of 40.6 percent and the small traders (not shown in chart) are Bullish-Extreme with a score of 88.9 percent.
| BRAZIL REAL Statistics | SPECULATORS | COMMERCIALS | SMALL TRADERS |
| – Percent of Open Interest Longs: | 45.6 | 49.0 | 5.3 |
| – Percent of Open Interest Shorts: | 32.4 | 65.4 | 2.2 |
| – Net Position: | 8,859 | -10,922 | 2,063 |
| – Gross Longs: | 30,443 | 32,719 | 3,543 |
| – Gross Shorts: | 21,584 | 43,641 | 1,480 |
| – Long to Short Ratio: | 1.4 to 1 | 0.7 to 1 | 2.4 to 1 |
| NET POSITION TREND: | | | |
| – Strength Index Score (3 Year Range Pct): | 59.1 | 40.6 | 88.9 |
| – Strength Index Reading (3 Year Range): | Bullish | Bearish | Bullish-Extreme |
| NET POSITION MOVEMENT INDEX: | | | |
| – 6-Week Change in Strength Index: | -1.6 | 0.6 | 11.2 |
Bitcoin Futures:
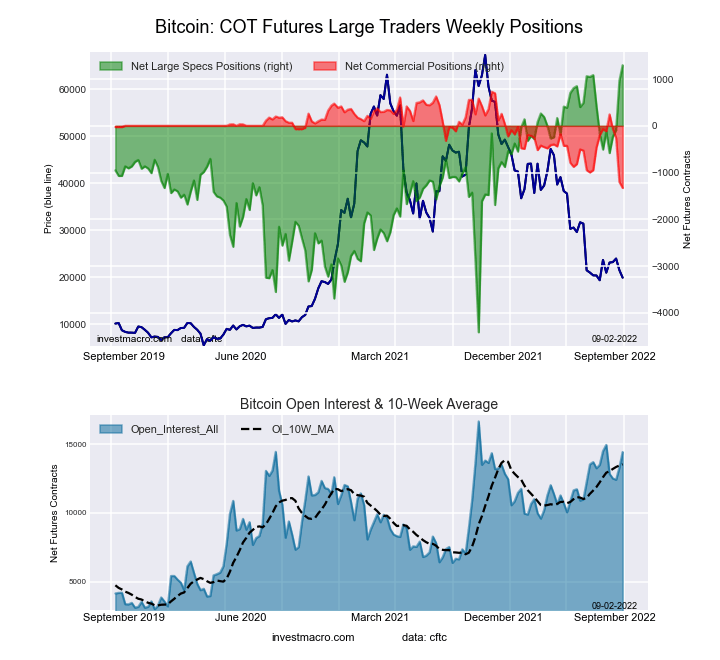 The Bitcoin large speculator standing this week came in at a net position of 1,296 contracts in the data reported through Tuesday. This was a weekly gain of 332 contracts from the previous week which had a total of 964 net contracts.
This week’s current strength score (the trader positioning range over the past three years, measured from 0 to 100) shows the speculators are currently Bullish-Extreme with a score of 100.0 percent. The commercials are Bearish-Extreme with a score of 0.0 percent and the small traders (not shown in chart) are Bearish-Extreme with a score of 13.6 percent.
| BITCOIN Statistics | SPECULATORS | COMMERCIALS | SMALL TRADERS |
| – Percent of Open Interest Longs: | 81.6 | 0.5 | 6.9 |
| – Percent of Open Interest Shorts: | 72.6 | 9.7 | 6.7 |
| – Net Position: | 1,296 | -1,327 | 31 |
| – Gross Longs: | 11,777 | 75 | 996 |
| – Gross Shorts: | 10,481 | 1,402 | 965 |
| – Long to Short Ratio: | 1.1 to 1 | 0.1 to 1 | 1.0 to 1 |
| NET POSITION TREND: | | | |
| – Strength Index Score (3 Year Range Pct): | 100.0 | 0.0 | 13.6 |
| – Strength Index Reading (3 Year Range): | Bullish-Extreme | Bearish-Extreme | Bearish-Extreme |
| NET POSITION MOVEMENT INDEX: | | | |
| – 6-Week Change in Strength Index: | 31.6 | -61.3 | -12.3 |
Article By InvestMacro – Receive our weekly COT Reports by Email
*COT Report: The COT data, released weekly to the public each Friday, is updated through the most recent Tuesday (data is 3 days old) and shows a quick view of how large speculators or non-commercials (for-profit traders) were positioned in the futures markets.
The CFTC categorizes trader positions according to commercial hedgers (traders who use futures contracts for hedging as part of the business), non-commercials (large traders who speculate to realize trading profits) and nonreportable traders (usually small traders/speculators) as well as their open interest (contracts open in the market at time of reporting). See CFTC criteria here.

 Article by ForexTime