By InvestMacro | COT | Data Tables | COT Leaders | Downloads | COT Newsletter
Here are the latest charts and statistics for the Commitment of Traders (COT) data published by the Commodities Futures Trading Commission (CFTC).
The latest COT data is updated through Tuesday August 30th and shows a quick view of how large traders (for-profit speculators and commercial entities) were positioned in the futures markets.
WTI Crude Oil, Brent and Gasoline lead Weekly Speculator Changes lower
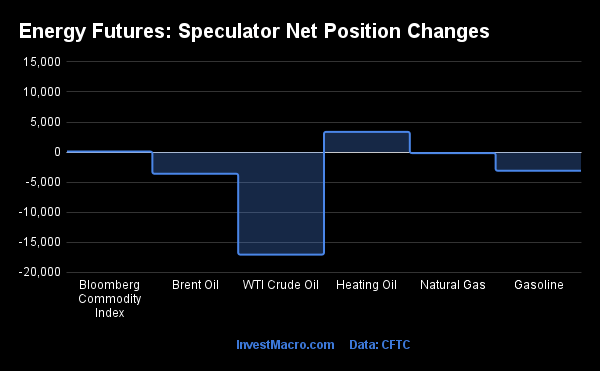
The COT energy market speculator bets were lower this week as two out of the six energy markets we cover had higher positioning this week while the other two markets had lower contracts.
Leading the gains for energy markets was Heating Oil (3,373 contracts) with the Bloomberg Commodity Index (98 contracts) also showing a positive week.
Free Reports:
 Get our Weekly Commitment of Traders Reports - See where the biggest traders (Hedge Funds and Commercial Hedgers) are positioned in the futures markets on a weekly basis.
 Download Our Metatrader 4 Indicators – Put Our Free MetaTrader 4 Custom Indicators on your charts when you join our Weekly Newsletter
The energy market leading the declines in speculator bets this week was WTI Crude Oil (-17,031 contracts) with Brent Crude Oil (-3,589 contracts), Gasoline (-3,088 contracts) and Natural Gas (-155 contracts) also registering lower bets on the week.
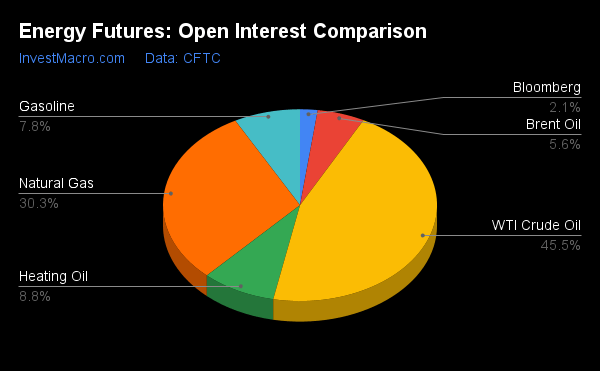
| Aug-30-2022 | OI | OI-Index | Spec-Net | Spec-Index | Com-Net | COM-Index | Smalls-Net | Smalls-Index |
|---|---|---|---|---|---|---|---|---|
| WTI Crude | 1,470,207 | 0 | 229,189 | 5 | -256,248 | 95 | 27,059 | 48 |
| Gold | 459,165 | 2 | 117,734 | 10 | -129,679 | 92 | 11,945 | 2 |
| Silver | 138,714 | 6 | -8,271 | 0 | 265 | 100 | 8,006 | 8 |
| Copper | 158,390 | 0 | -23,255 | 19 | 24,985 | 83 | -1,730 | 15 |
| Palladium | 5,875 | 0 | -1,129 | 16 | 1,323 | 82 | -194 | 33 |
| Platinum | 70,747 | 40 | -5,378 | 1 | 646 | 99 | 4,732 | 28 |
| Natural Gas | 978,881 | 4 | -128,765 | 40 | 92,463 | 60 | 36,302 | 66 |
| Brent | 180,952 | 24 | -40,013 | 44 | 36,585 | 54 | 3,428 | 56 |
| Heating Oil | 283,427 | 29 | 25,196 | 79 | -43,761 | 25 | 18,565 | 63 |
| Soybeans | 605,924 | 7 | 83,562 | 40 | -52,791 | 68 | -30,771 | 19 |
| Corn | 1,267,735 | 0 | 283,397 | 66 | -225,759 | 40 | -57,638 | 10 |
| Coffee | 193,889 | 7 | 48,687 | 81 | -50,983 | 23 | 2,296 | 21 |
| Sugar | 752,642 | 9 | 62,551 | 49 | -72,593 | 54 | 10,042 | 20 |
| Wheat | 288,545 | 0 | -11,499 | 4 | 14,914 | 81 | -3,415 | 93 |
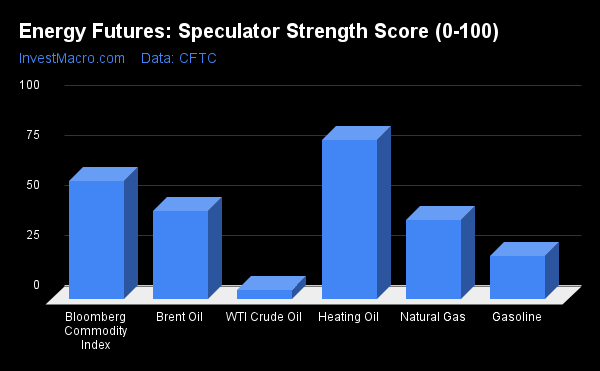
Heating Oil leads the Strength Scores
Strength Scores (a normalized measure of Speculator positions over a 3-Year range, from 0 to 100 where above 80 is extreme bullish and below 20 is extreme bearish) showed that Heating Oil (79.5 percent) leads the energy markets and is just under the bullish extreme position threshold (above 80 percent). The Bloomberg Commodity Index (59.4 percent) comes in as the next highest energy market in strength scores.
On the downside, WTI Crude Oil (4.9 percent) comes in at the lowest strength level currently and is in a bearish extreme position (below 20 percent). The next lowest is Gasoline (21.7 percent) followed by Natural Gas (39.9 percent) and Brent Crude Oil (44.0 percent).
Strength Statistics:
WTI Crude Oil (4.9 percent) vs WTI Crude Oil previous week (9.4 percent)
Brent Crude Oil (44.0 percent) vs Brent Crude Oil previous week (50.1 percent)
Natural Gas (39.9 percent) vs Natural Gas previous week (40.0 percent)
Gasoline (21.7 percent) vs Gasoline previous week (24.8 percent)
Heating Oil (79.5 percent) vs Heating Oil previous week (74.5 percent)
Bloomberg Commodity Index (59.4 percent) vs Bloomberg Commodity Index previous week (59.0 percent)
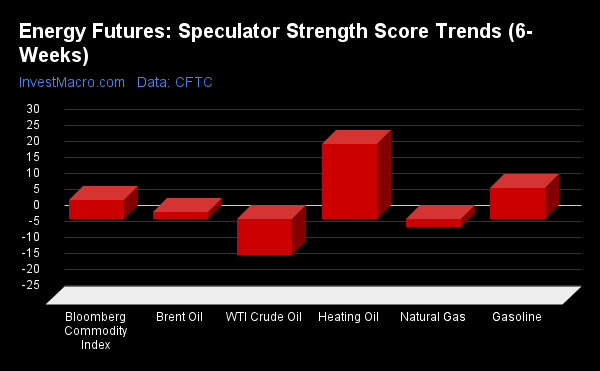
Heating Oil also leads the 6-Week Strength Trends
Strength Score Trends (or move index, calculates the 6-week changes in strength scores) show that Heating Oil (23.5 percent) leads the past six weeks trends for energy this week. Gasoline (9.9 percent), the Bloomberg Commodity Index (6.0 percent) and Brent Crude Oil (2.2 percent) round out the rest of the positive movers in the latest trends data.
WTI Crude Oil (-11.1 percent) leads the downside trend scores currently while the next market with lower trend scores was Natural Gas (-2.5 percent).
Strength Trend Statistics:
WTI Crude Oil (-11.1 percent) vs WTI Crude Oil previous week (-5.8 percent)
Brent Crude Oil (2.2 percent) vs Brent Crude Oil previous week (3.3 percent)
Natural Gas (-2.5 percent) vs Natural Gas previous week (0.9 percent)
Gasoline (9.9 percent) vs Gasoline previous week (20.1 percent)
Heating Oil (23.5 percent) vs Heating Oil previous week (22.2 percent)
Bloomberg Commodity Index (6.0 percent) vs Bloomberg Commodity Index previous week (-7.5 percent)
Individual Markets:
WTI Crude Oil Futures:
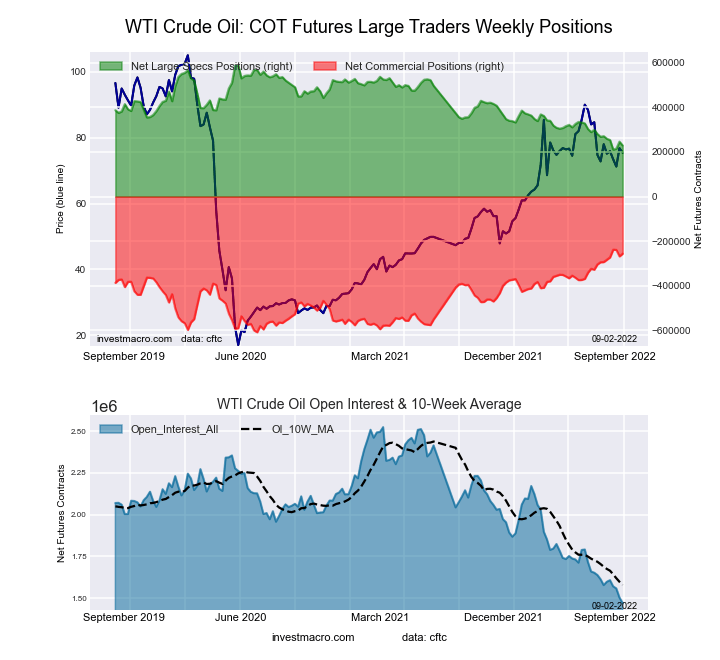 The WTI Crude Oil Futures large speculator standing this week reached a net position of 229,189 contracts in the data reported through Tuesday. This was a weekly decline of -17,031 contracts from the previous week which had a total of 246,220 net contracts.
This week’s current strength score (the trader positioning range over the past three years, measured from 0 to 100) shows the speculators are currently Bearish-Extreme with a score of 4.9 percent. The commercials are Bullish-Extreme with a score of 95.1 percent and the small traders (not shown in chart) are Bearish with a score of 48.3 percent.
| WTI Crude Oil Futures Statistics | SPECULATORS | COMMERCIALS | SMALL TRADERS |
| – Percent of Open Interest Longs: | 22.6 | 40.0 | 5.3 |
| – Percent of Open Interest Shorts: | 7.0 | 57.5 | 3.4 |
| – Net Position: | 229,189 | -256,248 | 27,059 |
| – Gross Longs: | 332,415 | 588,601 | 77,360 |
| – Gross Shorts: | 103,226 | 844,849 | 50,301 |
| – Long to Short Ratio: | 3.2 to 1 | 0.7 to 1 | 1.5 to 1 |
| NET POSITION TREND: | |||
| – Strength Index Score (3 Year Range Pct): | 4.9 | 95.1 | 48.3 |
| – Strength Index Reading (3 Year Range): | Bearish-Extreme | Bullish-Extreme | Bearish |
| NET POSITION MOVEMENT INDEX: | |||
| – 6-Week Change in Strength Index: | -11.1 | 10.1 | 6.9 |
Brent Crude Oil Futures:
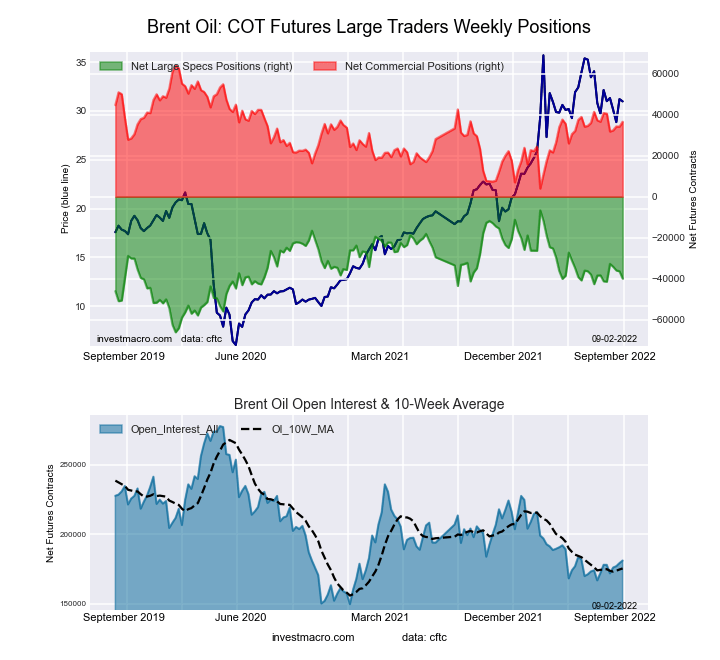 The Brent Crude Oil Futures large speculator standing this week reached a net position of -40,013 contracts in the data reported through Tuesday. This was a weekly reduction of -3,589 contracts from the previous week which had a total of -36,424 net contracts.
This week’s current strength score (the trader positioning range over the past three years, measured from 0 to 100) shows the speculators are currently Bearish with a score of 44.0 percent. The commercials are Bullish with a score of 54.1 percent and the small traders (not shown in chart) are Bullish with a score of 55.6 percent.
| Brent Crude Oil Futures Statistics | SPECULATORS | COMMERCIALS | SMALL TRADERS |
| – Percent of Open Interest Longs: | 18.0 | 51.8 | 5.0 |
| – Percent of Open Interest Shorts: | 40.1 | 31.6 | 3.2 |
| – Net Position: | -40,013 | 36,585 | 3,428 |
| – Gross Longs: | 32,556 | 93,680 | 9,137 |
| – Gross Shorts: | 72,569 | 57,095 | 5,709 |
| – Long to Short Ratio: | 0.4 to 1 | 1.6 to 1 | 1.6 to 1 |
| NET POSITION TREND: | |||
| – Strength Index Score (3 Year Range Pct): | 44.0 | 54.1 | 55.6 |
| – Strength Index Reading (3 Year Range): | Bearish | Bullish | Bullish |
| NET POSITION MOVEMENT INDEX: | |||
| – 6-Week Change in Strength Index: | 2.2 | -7.1 | 40.2 |
Natural Gas Futures:
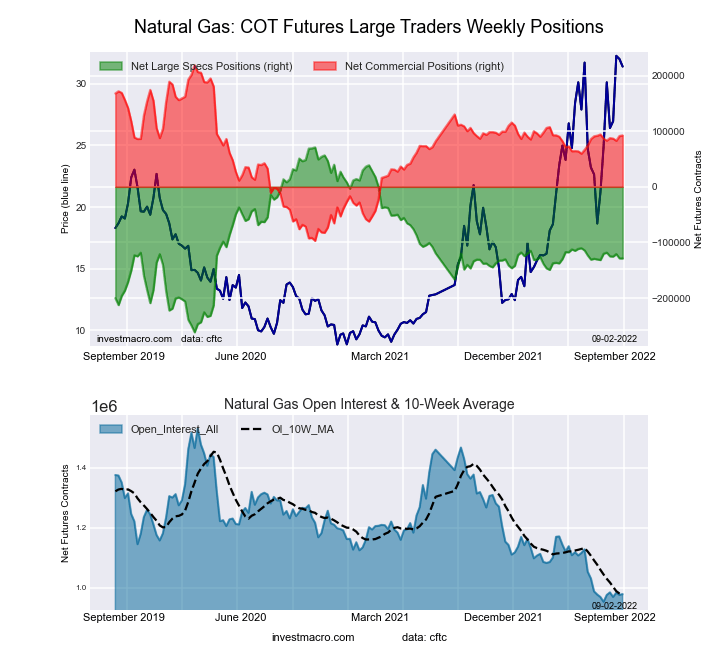 The Natural Gas Futures large speculator standing this week reached a net position of -128,765 contracts in the data reported through Tuesday. This was a weekly decrease of -155 contracts from the previous week which had a total of -128,610 net contracts.
This week’s current strength score (the trader positioning range over the past three years, measured from 0 to 100) shows the speculators are currently Bearish with a score of 39.9 percent. The commercials are Bullish with a score of 60.0 percent and the small traders (not shown in chart) are Bullish with a score of 66.1 percent.
| Natural Gas Futures Statistics | SPECULATORS | COMMERCIALS | SMALL TRADERS |
| – Percent of Open Interest Longs: | 17.3 | 42.0 | 6.7 |
| – Percent of Open Interest Shorts: | 30.4 | 32.5 | 3.0 |
| – Net Position: | -128,765 | 92,463 | 36,302 |
| – Gross Longs: | 168,924 | 410,930 | 65,677 |
| – Gross Shorts: | 297,689 | 318,467 | 29,375 |
| – Long to Short Ratio: | 0.6 to 1 | 1.3 to 1 | 2.2 to 1 |
| NET POSITION TREND: | |||
| – Strength Index Score (3 Year Range Pct): | 39.9 | 60.0 | 66.1 |
| – Strength Index Reading (3 Year Range): | Bearish | Bullish | Bullish |
| NET POSITION MOVEMENT INDEX: | |||
| – 6-Week Change in Strength Index: | -2.5 | 1.8 | 6.3 |
Gasoline Blendstock Futures:
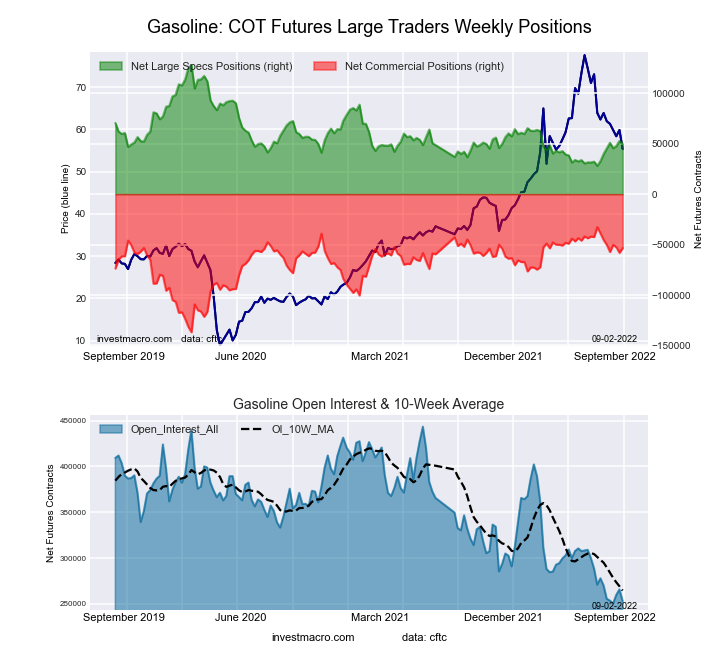 The Gasoline Blendstock Futures large speculator standing this week reached a net position of 49,702 contracts in the data reported through Tuesday. This was a weekly decline of -3,088 contracts from the previous week which had a total of 52,790 net contracts.
This week’s current strength score (the trader positioning range over the past three years, measured from 0 to 100) shows the speculators are currently Bearish with a score of 21.7 percent. The commercials are Bullish-Extreme with a score of 80.1 percent and the small traders (not shown in chart) are Bearish with a score of 37.6 percent.
| Nasdaq Mini Futures Statistics | SPECULATORS | COMMERCIALS | SMALL TRADERS |
| – Percent of Open Interest Longs: | 31.9 | 47.3 | 7.3 |
| – Percent of Open Interest Shorts: | 12.3 | 68.4 | 5.8 |
| – Net Position: | 49,702 | -53,438 | 3,736 |
| – Gross Longs: | 80,794 | 119,875 | 18,480 |
| – Gross Shorts: | 31,092 | 173,313 | 14,744 |
| – Long to Short Ratio: | 2.6 to 1 | 0.7 to 1 | 1.3 to 1 |
| NET POSITION TREND: | |||
| – Strength Index Score (3 Year Range Pct): | 21.7 | 80.1 | 37.6 |
| – Strength Index Reading (3 Year Range): | Bearish | Bullish-Extreme | Bearish |
| NET POSITION MOVEMENT INDEX: | |||
| – 6-Week Change in Strength Index: | 9.9 | -7.6 | -13.0 |
#2 Heating Oil NY-Harbor Futures:
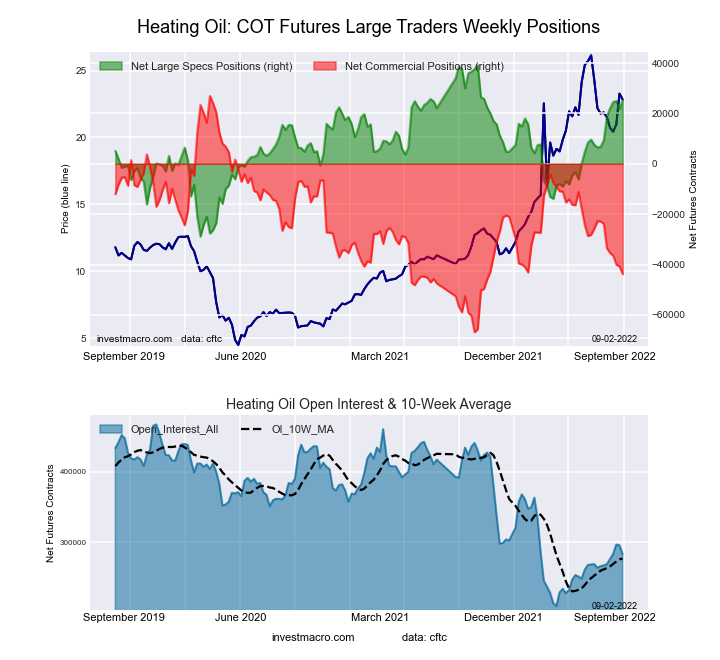 The #2 Heating Oil NY-Harbor Futures large speculator standing this week reached a net position of 25,196 contracts in the data reported through Tuesday. This was a weekly advance of 3,373 contracts from the previous week which had a total of 21,823 net contracts.
This week’s current strength score (the trader positioning range over the past three years, measured from 0 to 100) shows the speculators are currently Bullish with a score of 79.5 percent. The commercials are Bearish with a score of 24.7 percent and the small traders (not shown in chart) are Bullish with a score of 62.7 percent.
| Heating Oil Futures Statistics | SPECULATORS | COMMERCIALS | SMALL TRADERS |
| – Percent of Open Interest Longs: | 17.3 | 51.5 | 14.6 |
| – Percent of Open Interest Shorts: | 8.5 | 66.9 | 8.0 |
| – Net Position: | 25,196 | -43,761 | 18,565 |
| – Gross Longs: | 49,157 | 145,893 | 41,370 |
| – Gross Shorts: | 23,961 | 189,654 | 22,805 |
| – Long to Short Ratio: | 2.1 to 1 | 0.8 to 1 | 1.8 to 1 |
| NET POSITION TREND: | |||
| – Strength Index Score (3 Year Range Pct): | 79.5 | 24.7 | 62.7 |
| – Strength Index Reading (3 Year Range): | Bullish | Bearish | Bullish |
| NET POSITION MOVEMENT INDEX: | |||
| – 6-Week Change in Strength Index: | 23.5 | -21.3 | 13.9 |
Bloomberg Commodity Index Futures:
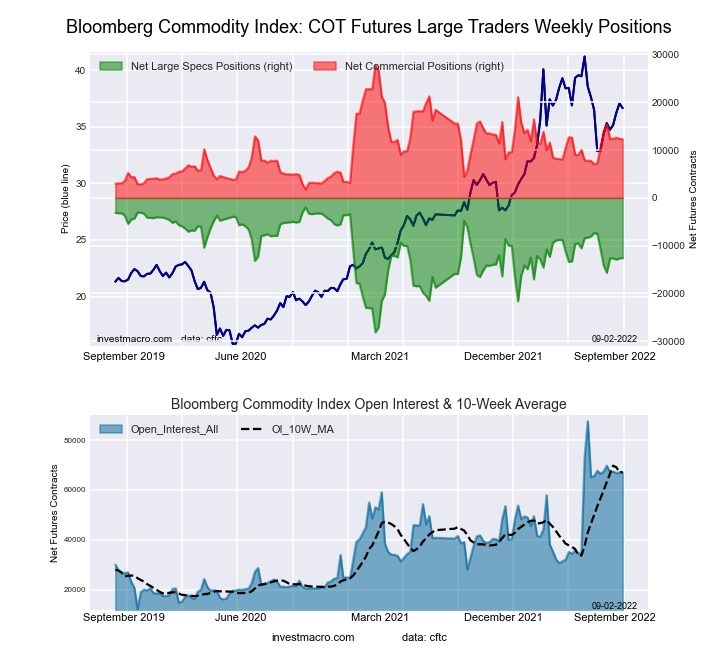 The Bloomberg Commodity Index Futures large speculator standing this week reached a net position of -12,567 contracts in the data reported through Tuesday. This was a weekly lift of 98 contracts from the previous week which had a total of -12,665 net contracts.
This week’s current strength score (the trader positioning range over the past three years, measured from 0 to 100) shows the speculators are currently Bullish with a score of 59.4 percent. The commercials are Bearish with a score of 40.4 percent and the small traders (not shown in chart) are Bearish with a score of 22.3 percent.
| Bloomberg Index Futures Statistics | SPECULATORS | COMMERCIALS | SMALL TRADERS |
| – Percent of Open Interest Longs: | 23.7 | 74.3 | 0.6 |
| – Percent of Open Interest Shorts: | 42.5 | 56.0 | 0.1 |
| – Net Position: | -12,567 | 12,243 | 324 |
| – Gross Longs: | 15,868 | 49,746 | 419 |
| – Gross Shorts: | 28,435 | 37,503 | 95 |
| – Long to Short Ratio: | 0.6 to 1 | 1.3 to 1 | 4.4 to 1 |
| NET POSITION TREND: | |||
| – Strength Index Score (3 Year Range Pct): | 59.4 | 40.4 | 22.3 |
| – Strength Index Reading (3 Year Range): | Bullish | Bearish | Bearish |
| NET POSITION MOVEMENT INDEX: | |||
| – 6-Week Change in Strength Index: | 6.0 | -6.4 | 4.0 |
Article By InvestMacro – Receive our weekly COT Reports by Email
*COT Report: The COT data, released weekly to the public each Friday, is updated through the most recent Tuesday (data is 3 days old) and shows a quick view of how large speculators or non-commercials (for-profit traders) were positioned in the futures markets.
The CFTC categorizes trader positions according to commercial hedgers (traders who use futures contracts for hedging as part of the business), non-commercials (large traders who speculate to realize trading profits) and nonreportable traders (usually small traders/speculators) as well as their open interest (contracts open in the market at time of reporting). See CFTC criteria here.

- The US introduces new import tariffs for 60 countries. Brent crude surpasses $100 per barrel Jul 24, 2026
- USD/JPY Breaks Records: Nothing Slows the Yen’s Decline Jul 24, 2026
- Oil prices reached a 6‑week high. The AUD strengthened on the back of a strong labor‑market report Jul 23, 2026
- EUR/USD Recovers as Dollar Weakens Jul 23, 2026
- Bitcoin rose to $66,000. The New Zealand dollar continues to strengthen Jul 22, 2026
- Inflationary pressure is easing in Canada. In New Zealand, on the contrary, inflation is rising Jul 21, 2026
- GBP/USD Falls After Cabinet Changes Jul 21, 2026
- Geopolitical and macroeconomic conditions continue to pressure market sentiment Jul 20, 2026
- USD/JPY Poised to Continue Gains as Expensive Oil and Lack of Support Weigh on Yen Jul 20, 2026
- COT Metals Charts: Weekly Speculator Bets led by Copper & Steel Jul 18, 2026