
By InvestMacro | COT | Data Tables | COT Leaders | Downloads | COT Newsletter
Here are the latest charts and statistics for the Commitment of Traders (COT) data published by the Commodities Futures Trading Commission (CFTC).
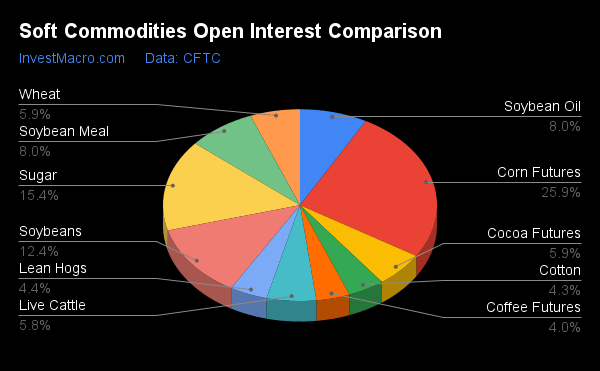
The latest COT data is updated through Tuesday August 30th (COT Week 35) and shows a quick view of how large traders (for-profit speculators and commercial entities) were positioned in the futures markets.
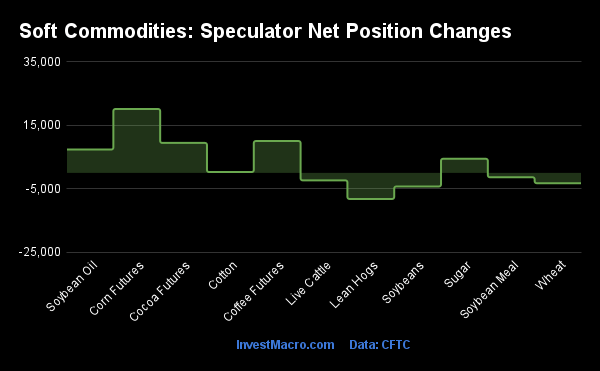
Corn, Coffee and Cocoa lead the Weekly Speculator Changes Higher
COT soft commodities speculator bets were slightly higher this week as six out of the eleven soft commodities markets we cover had higher positioning this week while the other five markets had lower contracts.
Leading the gains for soft commodities markets was Corn (20,154 contracts) and Coffee (10,054 contracts) with Cocoa (9,461 contracts), Soybean Oil (7,381 contracts), Sugar (4,464 contracts) and Cotton (282 contracts) also showing a positive weeks.
Free Reports:
 Sign Up for Our Stock Market Newsletter – Get updated on News, Charts & Rankings of Public Companies when you join our Stocks Newsletter
 Get our Weekly Commitment of Traders Reports - See where the biggest traders (Hedge Funds and Commercial Hedgers) are positioned in the futures markets on a weekly basis.
The softs markets leading the declines in speculator bets this week was Lean Hogs (-8,204 contracts) with Soybeans (-4,274 contracts), Wheat (-3,243 contracts), Live Cattle (-2,346 contracts) and Soybean Meal (-1,365 contracts) also registering lower bets on the week.
| Aug-30-2022 | OI | OI-Index | Spec-Net | Spec-Index | Com-Net | COM-Index | Smalls-Net | Smalls-Index |
|---|---|---|---|---|---|---|---|---|
| WTI Crude | 1,470,207 | 0 | 229,189 | 5 | -256,248 | 95 | 27,059 | 48 |
| Gold | 459,165 | 2 | 117,734 | 10 | -129,679 | 92 | 11,945 | 2 |
| Silver | 138,714 | 6 | -8,271 | 0 | 265 | 100 | 8,006 | 8 |
| Copper | 158,390 | 0 | -23,255 | 19 | 24,985 | 83 | -1,730 | 15 |
| Palladium | 5,875 | 0 | -1,129 | 16 | 1,323 | 82 | -194 | 33 |
| Platinum | 70,747 | 40 | -5,378 | 1 | 646 | 99 | 4,732 | 28 |
| Natural Gas | 978,881 | 4 | -128,765 | 40 | 92,463 | 60 | 36,302 | 66 |
| Brent | 180,952 | 24 | -40,013 | 44 | 36,585 | 54 | 3,428 | 56 |
| Heating Oil | 283,427 | 29 | 25,196 | 79 | -43,761 | 25 | 18,565 | 63 |
| Soybeans | 605,924 | 7 | 83,562 | 40 | -52,791 | 68 | -30,771 | 19 |
| Corn | 1,267,735 | 0 | 283,397 | 66 | -225,759 | 40 | -57,638 | 10 |
| Coffee | 193,889 | 7 | 48,687 | 81 | -50,983 | 23 | 2,296 | 21 |
| Sugar | 752,642 | 9 | 62,551 | 49 | -72,593 | 54 | 10,042 | 20 |
| Wheat | 288,545 | 0 | -11,499 | 4 | 14,914 | 81 | -3,415 | 93 |
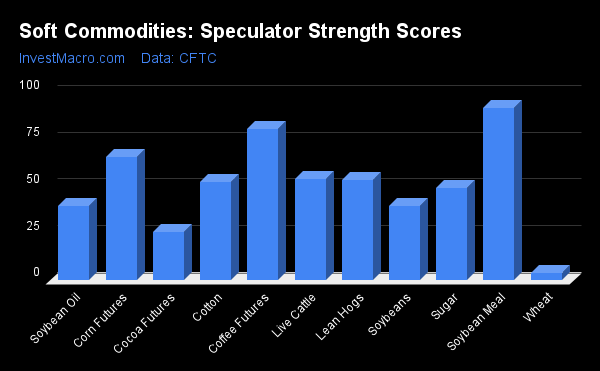
Soybean Meal and Coffee leads this week’s Strength Scores
Strength Scores (a normalized measure of Speculator positions over a 3-Year range, from 0 to 100 where above 80 is extreme bullish and below 20 is extreme bearish) showed that Soybean Meal (92.2 percent) and Coffee (80.9 percent) lead the soft commodity markets and are both in bullish extreme positions (above 80 percent). Corn (66.2 percent) comes in as the next highest soft commodity markets market in strength scores.
On the downside, Wheat (4.1 percent) comes in at the lowest strength level currently and is in a bearish extreme state (below 20 percent). Cocoa (25.8 percent) comes in as the next lowest followed by Soybeans (39.6 percent) and Soybean Oil (40.0 percent).
Strength Statistics:
Corn (66.2 percent) vs Corn previous week (63.7 percent)
Sugar (49.5 percent) vs Sugar previous week (48.6 percent)
Coffee (80.9 percent) vs Coffee previous week (72.2 percent)
Soybeans (39.6 percent) vs Soybeans previous week (40.9 percent)
Soybean Oil (40.0 percent) vs Soybean Oil previous week (34.9 percent)
Soybean Meal (92.2 percent) vs Soybean Meal previous week (92.9 percent)
Live Cattle (54.3 percent) vs Live Cattle previous week (57.2 percent)
Lean Hogs (53.8 percent) vs Lean Hogs previous week (62.7 percent)
Cotton (52.7 percent) vs Cotton previous week (52.5 percent)
Cocoa (25.8 percent) vs Cocoa previous week (16.5 percent)
Wheat (4.1 percent) vs Wheat previous week (8.3 percent)
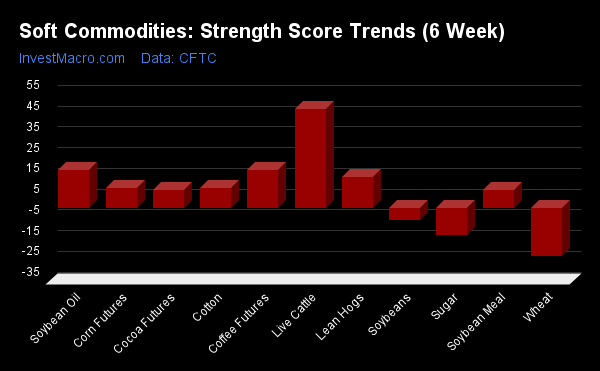
Live Cattle leads the 6-Week Strength Trends
Strength Score Trends (or move index, calculates the 6-week changes in strength scores) showed that Live Cattle (47.4 percent) leads the past six weeks trends for soft commodity markets this week. Soybean Oil (18.3 percent), Coffee (17.9 percent) and Lean Hogs (14.8 percent) fill out the top movers in the latest trends data.
Wheat (-23.5 percent) leads the downside trend scores currently while the next market with lower trend scores were Sugar (-13.3 percent) followed by Soybeans (-5.8 percent).
Strength Trend Statistics:
Corn (9.4 percent) vs Corn previous week (2.1 percent)
Sugar (-13.3 percent) vs Sugar previous week (-9.8 percent)
Coffee (17.9 percent) vs Coffee previous week (3.7 percent)
Soybeans (-5.8 percent) vs Soybeans previous week (-8.3 percent)
Soybean Oil (18.3 percent) vs Soybean Oil previous week (11.5 percent)
Soybean Meal (8.6 percent) vs Soybean Meal previous week (9.6 percent)
Live Cattle (47.4 percent) vs Live Cattle previous week (50.4 percent)
Lean Hogs (14.8 percent) vs Lean Hogs previous week (28.7 percent)
Cotton (9.5 percent) vs Cotton previous week (6.0 percent)
Cocoa (8.7 percent) vs Cocoa previous week (3.0 percent)
Wheat (-23.5 percent) vs Wheat previous week (-16.8 percent)
Individual Markets:
CORN Futures:
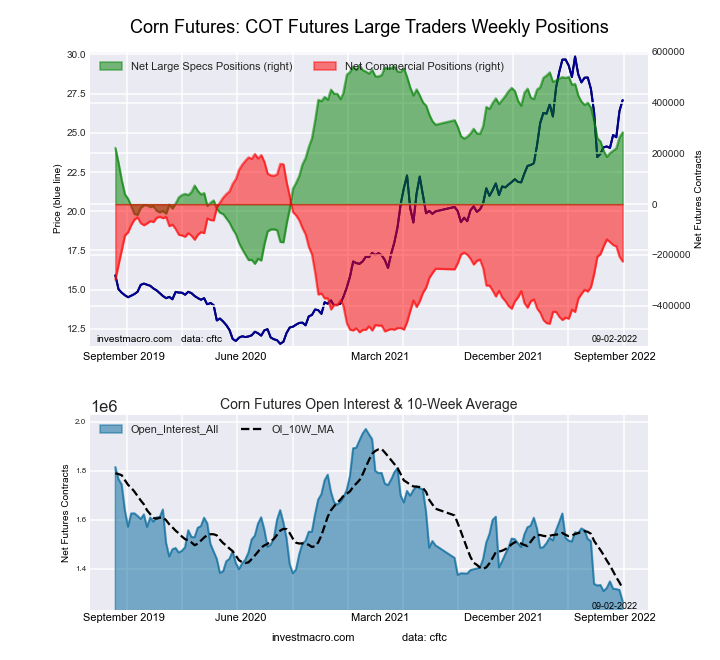 The CORN large speculator standing this week equaled a net position of 283,397 contracts in the data reported through Tuesday. This was a weekly gain of 20,154 contracts from the previous week which had a total of 263,243 net contracts.
This week’s current strength score (the trader positioning range over the past three years, measured from 0 to 100) shows the speculators are currently Bullish with a score of 66.2 percent. The commercials are Bearish with a score of 39.7 percent and the small traders (not shown in chart) are Bearish-Extreme with a score of 9.9 percent.
| CORN Futures Statistics | SPECULATORS | COMMERCIALS | SMALL TRADERS |
| – Percent of Open Interest Longs: | 31.7 | 47.0 | 9.1 |
| – Percent of Open Interest Shorts: | 9.4 | 64.8 | 13.6 |
| – Net Position: | 283,397 | -225,759 | -57,638 |
| – Gross Longs: | 402,312 | 595,440 | 115,050 |
| – Gross Shorts: | 118,915 | 821,199 | 172,688 |
| – Long to Short Ratio: | 3.4 to 1 | 0.7 to 1 | 0.7 to 1 |
| NET POSITION TREND: | |||
| – Strength Index Score (3 Year Range Pct): | 66.2 | 39.7 | 9.9 |
| – Strength Index Reading (3 Year Range): | Bullish | Bearish | Bearish-Extreme |
| NET POSITION MOVEMENT INDEX: | |||
| – 6-Week Change in Strength Index: | 9.4 | -8.6 | -7.6 |
SUGAR Futures:
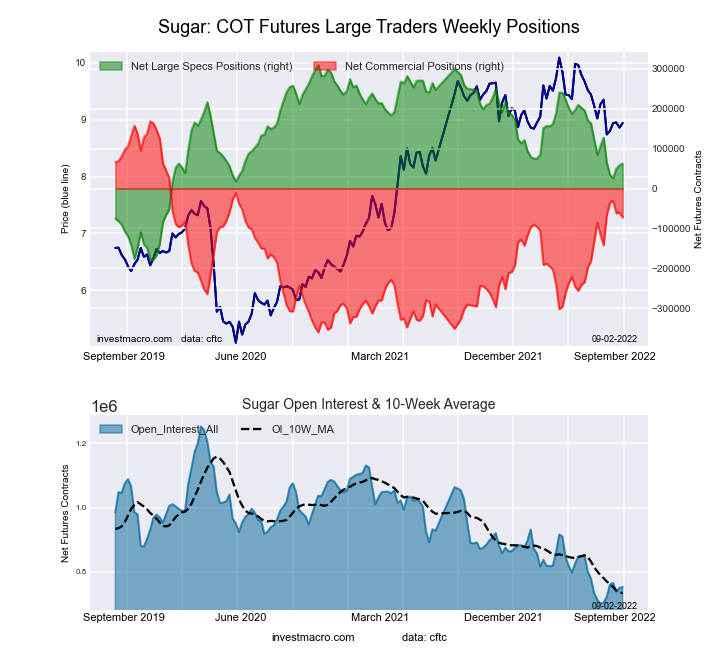 The SUGAR large speculator standing this week equaled a net position of 62,551 contracts in the data reported through Tuesday. This was a weekly increase of 4,464 contracts from the previous week which had a total of 58,087 net contracts.
This week’s current strength score (the trader positioning range over the past three years, measured from 0 to 100) shows the speculators are currently Bearish with a score of 49.5 percent. The commercials are Bullish with a score of 54.4 percent and the small traders (not shown in chart) are Bearish with a score of 20.3 percent.
| SUGAR Futures Statistics | SPECULATORS | COMMERCIALS | SMALL TRADERS |
| – Percent of Open Interest Longs: | 23.3 | 53.5 | 8.8 |
| – Percent of Open Interest Shorts: | 15.0 | 63.1 | 7.5 |
| – Net Position: | 62,551 | -72,593 | 10,042 |
| – Gross Longs: | 175,450 | 402,664 | 66,576 |
| – Gross Shorts: | 112,899 | 475,257 | 56,534 |
| – Long to Short Ratio: | 1.6 to 1 | 0.8 to 1 | 1.2 to 1 |
| NET POSITION TREND: | |||
| – Strength Index Score (3 Year Range Pct): | 49.5 | 54.4 | 20.3 |
| – Strength Index Reading (3 Year Range): | Bearish | Bullish | Bearish |
| NET POSITION MOVEMENT INDEX: | |||
| – 6-Week Change in Strength Index: | -13.3 | 13.1 | -5.7 |
COFFEE Futures:
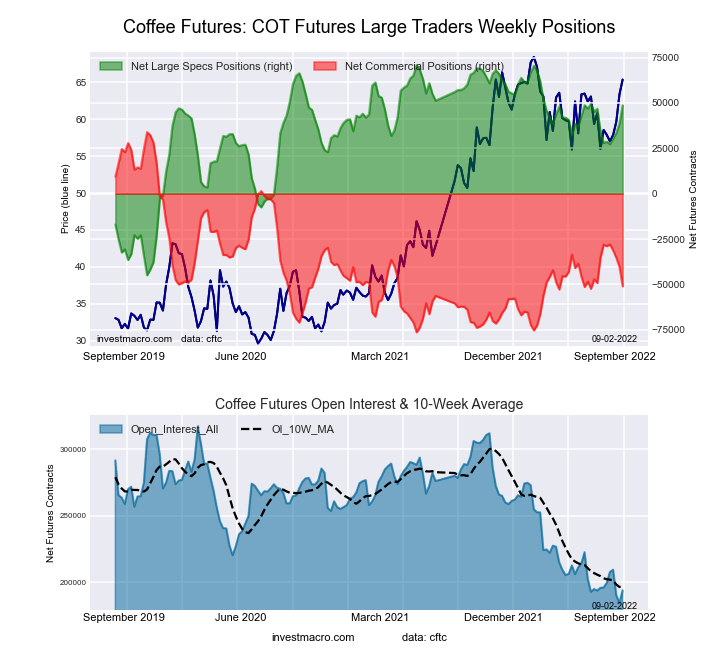 The COFFEE large speculator standing this week equaled a net position of 48,687 contracts in the data reported through Tuesday. This was a weekly gain of 10,054 contracts from the previous week which had a total of 38,633 net contracts.
This week’s current strength score (the trader positioning range over the past three years, measured from 0 to 100) shows the speculators are currently Bullish-Extreme with a score of 80.9 percent. The commercials are Bearish with a score of 23.0 percent and the small traders (not shown in chart) are Bearish with a score of 20.6 percent.
| COFFEE Futures Statistics | SPECULATORS | COMMERCIALS | SMALL TRADERS |
| – Percent of Open Interest Longs: | 31.7 | 45.0 | 4.9 |
| – Percent of Open Interest Shorts: | 6.6 | 71.3 | 3.7 |
| – Net Position: | 48,687 | -50,983 | 2,296 |
| – Gross Longs: | 61,416 | 87,194 | 9,555 |
| – Gross Shorts: | 12,729 | 138,177 | 7,259 |
| – Long to Short Ratio: | 4.8 to 1 | 0.6 to 1 | 1.3 to 1 |
| NET POSITION TREND: | |||
| – Strength Index Score (3 Year Range Pct): | 80.9 | 23.0 | 20.6 |
| – Strength Index Reading (3 Year Range): | Bullish-Extreme | Bearish | Bearish |
| NET POSITION MOVEMENT INDEX: | |||
| – 6-Week Change in Strength Index: | 17.9 | -20.8 | 20.6 |
SOYBEANS Futures:
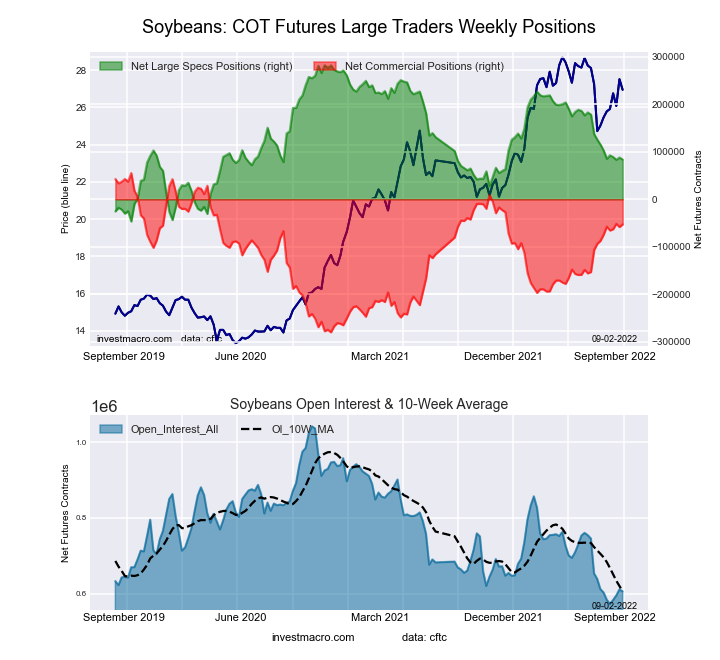 The SOYBEANS large speculator standing this week equaled a net position of 83,562 contracts in the data reported through Tuesday. This was a weekly fall of -4,274 contracts from the previous week which had a total of 87,836 net contracts.
This week’s current strength score (the trader positioning range over the past three years, measured from 0 to 100) shows the speculators are currently Bearish with a score of 39.6 percent. The commercials are Bullish with a score of 67.8 percent and the small traders (not shown in chart) are Bearish-Extreme with a score of 19.0 percent.
| SOYBEANS Futures Statistics | SPECULATORS | COMMERCIALS | SMALL TRADERS |
| – Percent of Open Interest Longs: | 25.7 | 55.3 | 6.2 |
| – Percent of Open Interest Shorts: | 11.9 | 64.0 | 11.3 |
| – Net Position: | 83,562 | -52,791 | -30,771 |
| – Gross Longs: | 155,472 | 335,048 | 37,513 |
| – Gross Shorts: | 71,910 | 387,839 | 68,284 |
| – Long to Short Ratio: | 2.2 to 1 | 0.9 to 1 | 0.5 to 1 |
| NET POSITION TREND: | |||
| – Strength Index Score (3 Year Range Pct): | 39.6 | 67.8 | 19.0 |
| – Strength Index Reading (3 Year Range): | Bearish | Bullish | Bearish-Extreme |
| NET POSITION MOVEMENT INDEX: | |||
| – 6-Week Change in Strength Index: | -5.8 | 6.5 | -4.4 |
SOYBEAN OIL Futures:
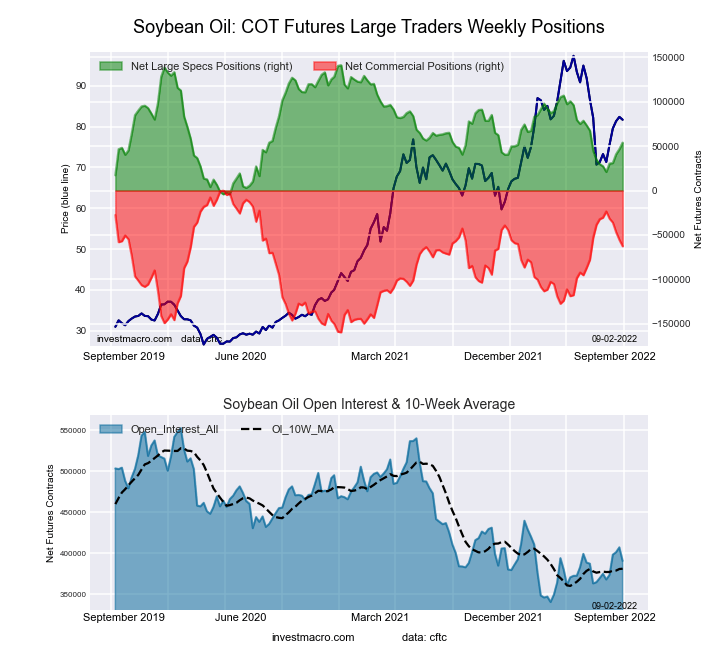 The SOYBEAN OIL large speculator standing this week equaled a net position of 53,958 contracts in the data reported through Tuesday. This was a weekly boost of 7,381 contracts from the previous week which had a total of 46,577 net contracts.
This week’s current strength score (the trader positioning range over the past three years, measured from 0 to 100) shows the speculators are currently Bearish with a score of 40.0 percent. The commercials are Bullish with a score of 60.8 percent and the small traders (not shown in chart) are Bearish with a score of 46.1 percent.
| SOYBEAN OIL Futures Statistics | SPECULATORS | COMMERCIALS | SMALL TRADERS |
| – Percent of Open Interest Longs: | 21.2 | 51.7 | 7.6 |
| – Percent of Open Interest Shorts: | 7.4 | 67.8 | 5.4 |
| – Net Position: | 53,958 | -62,711 | 8,753 |
| – Gross Longs: | 83,033 | 202,095 | 29,895 |
| – Gross Shorts: | 29,075 | 264,806 | 21,142 |
| – Long to Short Ratio: | 2.9 to 1 | 0.8 to 1 | 1.4 to 1 |
| NET POSITION TREND: | |||
| – Strength Index Score (3 Year Range Pct): | 40.0 | 60.8 | 46.1 |
| – Strength Index Reading (3 Year Range): | Bearish | Bullish | Bearish |
| NET POSITION MOVEMENT INDEX: | |||
| – 6-Week Change in Strength Index: | 18.3 | -20.2 | 21.0 |
SOYBEAN MEAL Futures:
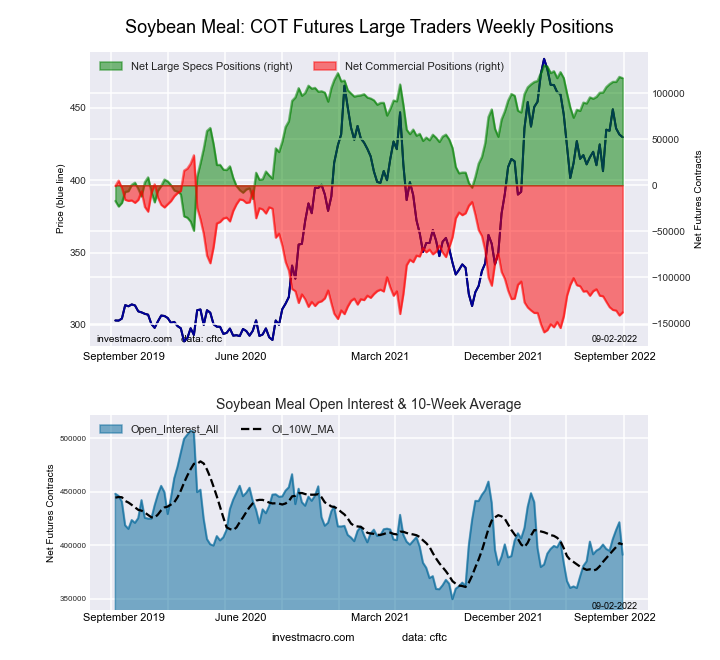 The SOYBEAN MEAL large speculator standing this week equaled a net position of 116,189 contracts in the data reported through Tuesday. This was a weekly lowering of -1,365 contracts from the previous week which had a total of 117,554 net contracts.
This week’s current strength score (the trader positioning range over the past three years, measured from 0 to 100) shows the speculators are currently Bullish-Extreme with a score of 92.2 percent. The commercials are Bearish-Extreme with a score of 11.3 percent and the small traders (not shown in chart) are Bearish with a score of 45.1 percent.
| SOYBEAN MEAL Futures Statistics | SPECULATORS | COMMERCIALS | SMALL TRADERS |
| – Percent of Open Interest Longs: | 32.4 | 43.0 | 12.0 |
| – Percent of Open Interest Shorts: | 2.7 | 78.3 | 6.4 |
| – Net Position: | 116,189 | -137,835 | 21,646 |
| – Gross Longs: | 126,866 | 168,316 | 46,829 |
| – Gross Shorts: | 10,677 | 306,151 | 25,183 |
| – Long to Short Ratio: | 11.9 to 1 | 0.5 to 1 | 1.9 to 1 |
| NET POSITION TREND: | |||
| – Strength Index Score (3 Year Range Pct): | 92.2 | 11.3 | 45.1 |
| – Strength Index Reading (3 Year Range): | Bullish-Extreme | Bearish-Extreme | Bearish |
| NET POSITION MOVEMENT INDEX: | |||
| – 6-Week Change in Strength Index: | 8.6 | -9.1 | 10.4 |
LIVE CATTLE Futures:
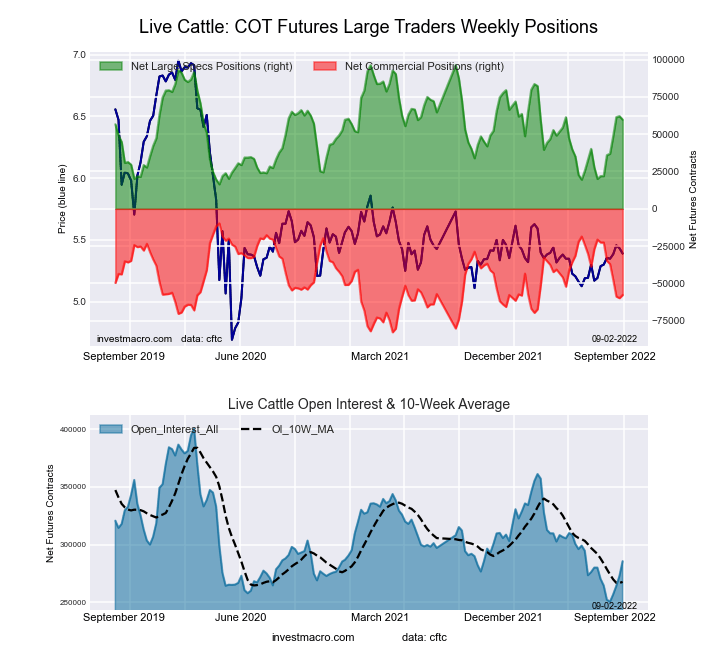 The LIVE CATTLE large speculator standing this week equaled a net position of 59,731 contracts in the data reported through Tuesday. This was a weekly decrease of -2,346 contracts from the previous week which had a total of 62,077 net contracts.
This week’s current strength score (the trader positioning range over the past three years, measured from 0 to 100) shows the speculators are currently Bullish with a score of 54.3 percent. The commercials are Bearish with a score of 34.2 percent and the small traders (not shown in chart) are Bullish with a score of 77.7 percent.
| LIVE CATTLE Futures Statistics | SPECULATORS | COMMERCIALS | SMALL TRADERS |
| – Percent of Open Interest Longs: | 38.1 | 32.9 | 11.3 |
| – Percent of Open Interest Shorts: | 17.2 | 53.1 | 12.0 |
| – Net Position: | 59,731 | -57,725 | -2,006 |
| – Gross Longs: | 108,976 | 93,974 | 32,255 |
| – Gross Shorts: | 49,245 | 151,699 | 34,261 |
| – Long to Short Ratio: | 2.2 to 1 | 0.6 to 1 | 0.9 to 1 |
| NET POSITION TREND: | |||
| – Strength Index Score (3 Year Range Pct): | 54.3 | 34.2 | 77.7 |
| – Strength Index Reading (3 Year Range): | Bullish | Bearish | Bullish |
| NET POSITION MOVEMENT INDEX: | |||
| – 6-Week Change in Strength Index: | 47.4 | -48.2 | -9.3 |
LEAN HOGS Futures:
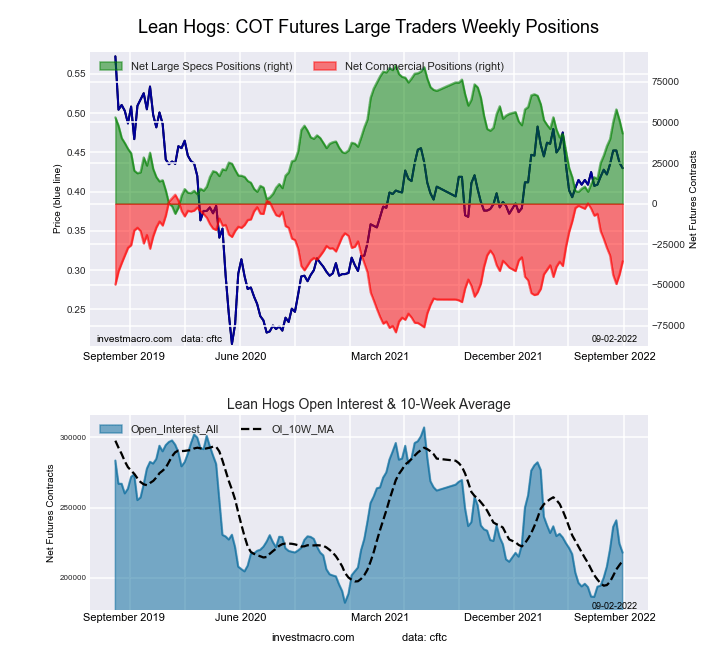 The LEAN HOGS large speculator standing this week equaled a net position of 43,199 contracts in the data reported through Tuesday. This was a weekly reduction of -8,204 contracts from the previous week which had a total of 51,403 net contracts.
This week’s current strength score (the trader positioning range over the past three years, measured from 0 to 100) shows the speculators are currently Bullish with a score of 53.8 percent. The commercials are Bullish with a score of 51.6 percent and the small traders (not shown in chart) are Bullish with a score of 56.2 percent.
| LEAN HOGS Futures Statistics | SPECULATORS | COMMERCIALS | SMALL TRADERS |
| – Percent of Open Interest Longs: | 39.0 | 36.0 | 8.9 |
| – Percent of Open Interest Shorts: | 19.2 | 52.3 | 12.5 |
| – Net Position: | 43,199 | -35,424 | -7,775 |
| – Gross Longs: | 84,944 | 78,505 | 19,440 |
| – Gross Shorts: | 41,745 | 113,929 | 27,215 |
| – Long to Short Ratio: | 2.0 to 1 | 0.7 to 1 | 0.7 to 1 |
| NET POSITION TREND: | |||
| – Strength Index Score (3 Year Range Pct): | 53.8 | 51.6 | 56.2 |
| – Strength Index Reading (3 Year Range): | Bullish | Bullish | Bullish |
| NET POSITION MOVEMENT INDEX: | |||
| – 6-Week Change in Strength Index: | 14.8 | -16.2 | 0.9 |
COTTON Futures:
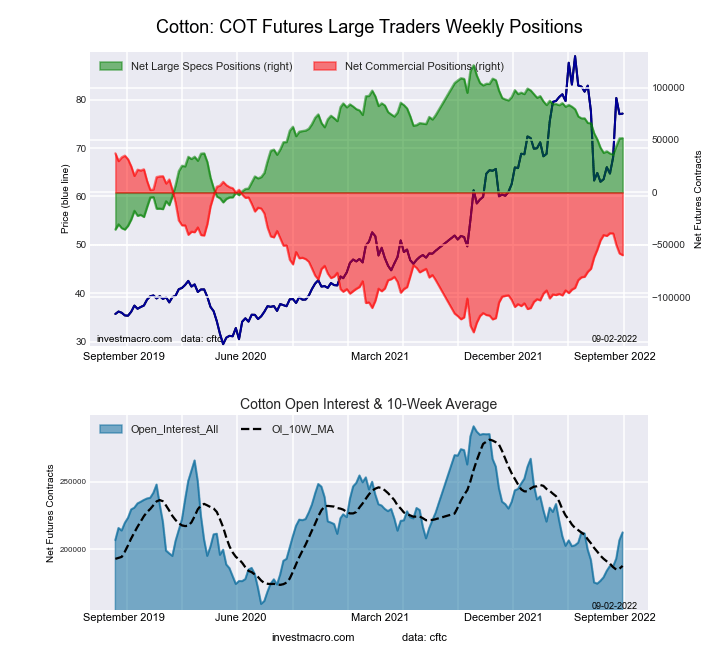 The COTTON large speculator standing this week equaled a net position of 51,767 contracts in the data reported through Tuesday. This was a weekly lift of 282 contracts from the previous week which had a total of 51,485 net contracts.
This week’s current strength score (the trader positioning range over the past three years, measured from 0 to 100) shows the speculators are currently Bullish with a score of 52.7 percent. The commercials are Bearish with a score of 46.5 percent and the small traders (not shown in chart) are Bullish with a score of 62.1 percent.
| COTTON Futures Statistics | SPECULATORS | COMMERCIALS | SMALL TRADERS |
| – Percent of Open Interest Longs: | 37.0 | 43.7 | 7.2 |
| – Percent of Open Interest Shorts: | 12.6 | 71.8 | 3.4 |
| – Net Position: | 51,767 | -59,761 | 7,994 |
| – Gross Longs: | 78,599 | 92,717 | 15,280 |
| – Gross Shorts: | 26,832 | 152,478 | 7,286 |
| – Long to Short Ratio: | 2.9 to 1 | 0.6 to 1 | 2.1 to 1 |
| NET POSITION TREND: | |||
| – Strength Index Score (3 Year Range Pct): | 52.7 | 46.5 | 62.1 |
| – Strength Index Reading (3 Year Range): | Bullish | Bearish | Bullish |
| NET POSITION MOVEMENT INDEX: | |||
| – 6-Week Change in Strength Index: | 9.5 | -12.1 | 33.1 |
COCOA Futures:
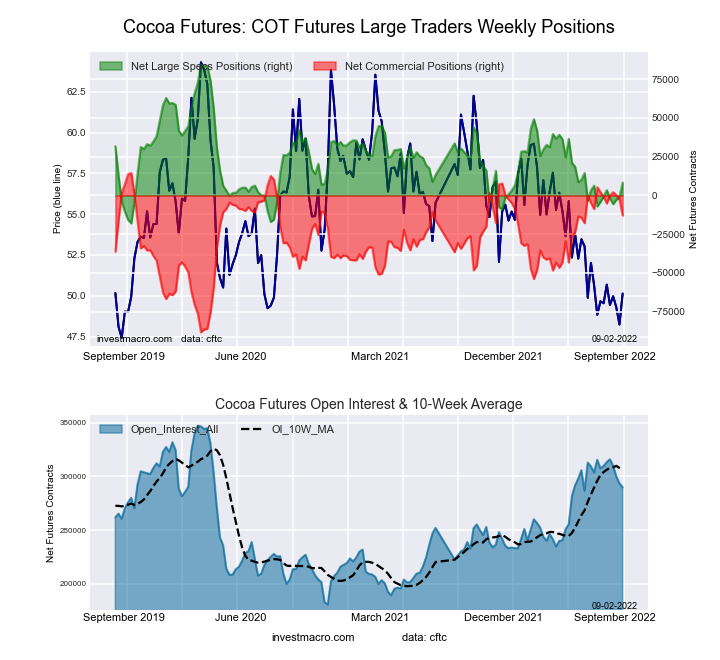 The COCOA large speculator standing this week equaled a net position of 8,311 contracts in the data reported through Tuesday. This was a weekly boost of 9,461 contracts from the previous week which had a total of -1,150 net contracts.
This week’s current strength score (the trader positioning range over the past three years, measured from 0 to 100) shows the speculators are currently Bearish with a score of 25.8 percent. The commercials are Bullish with a score of 73.3 percent and the small traders (not shown in chart) are Bearish with a score of 43.1 percent.
| COCOA Futures Statistics | SPECULATORS | COMMERCIALS | SMALL TRADERS |
| – Percent of Open Interest Longs: | 33.4 | 45.4 | 4.8 |
| – Percent of Open Interest Shorts: | 30.6 | 49.9 | 3.2 |
| – Net Position: | 8,311 | -12,968 | 4,657 |
| – Gross Longs: | 96,892 | 131,596 | 13,945 |
| – Gross Shorts: | 88,581 | 144,564 | 9,288 |
| – Long to Short Ratio: | 1.1 to 1 | 0.9 to 1 | 1.5 to 1 |
| NET POSITION TREND: | |||
| – Strength Index Score (3 Year Range Pct): | 25.8 | 73.3 | 43.1 |
| – Strength Index Reading (3 Year Range): | Bearish | Bullish | Bearish |
| NET POSITION MOVEMENT INDEX: | |||
| – 6-Week Change in Strength Index: | 8.7 | -11.6 | 30.4 |
WHEAT Futures:
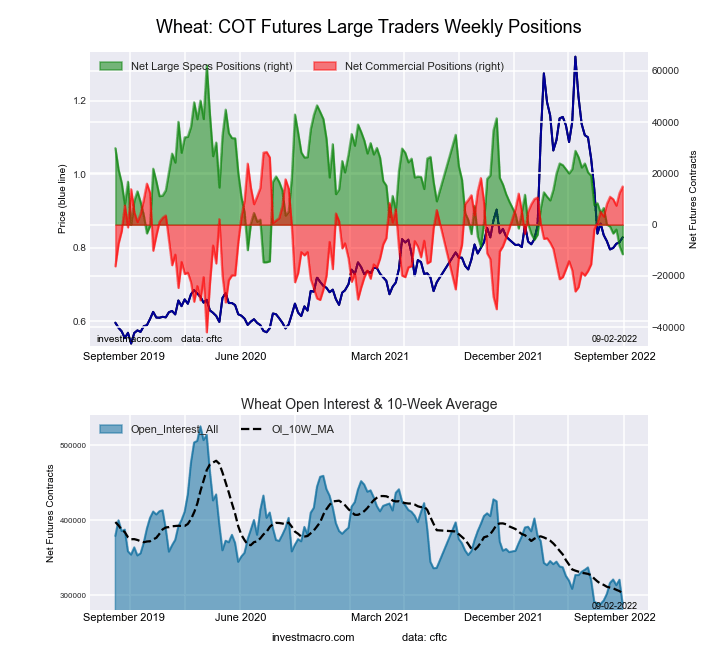 The WHEAT large speculator standing this week equaled a net position of -11,499 contracts in the data reported through Tuesday. This was a weekly decline of -3,243 contracts from the previous week which had a total of -8,256 net contracts.
This week’s current strength score (the trader positioning range over the past three years, measured from 0 to 100) shows the speculators are currently Bearish-Extreme with a score of 4.1 percent. The commercials are Bullish-Extreme with a score of 80.9 percent and the small traders (not shown in chart) are Bullish-Extreme with a score of 92.7 percent.
| WHEAT Futures Statistics | SPECULATORS | COMMERCIALS | SMALL TRADERS |
| – Percent of Open Interest Longs: | 30.9 | 41.5 | 10.2 |
| – Percent of Open Interest Shorts: | 34.9 | 36.3 | 11.4 |
| – Net Position: | -11,499 | 14,914 | -3,415 |
| – Gross Longs: | 89,300 | 119,733 | 29,557 |
| – Gross Shorts: | 100,799 | 104,819 | 32,972 |
| – Long to Short Ratio: | 0.9 to 1 | 1.1 to 1 | 0.9 to 1 |
| NET POSITION TREND: | |||
| – Strength Index Score (3 Year Range Pct): | 4.1 | 80.9 | 92.7 |
| – Strength Index Reading (3 Year Range): | Bearish-Extreme | Bullish-Extreme | Bullish-Extreme |
| NET POSITION MOVEMENT INDEX: | |||
| – 6-Week Change in Strength Index: | -23.5 | 16.7 | 32.6 |
Article By InvestMacro – Receive our weekly COT Reports by Email
*COT Report: The COT data, released weekly to the public each Friday, is updated through the most recent Tuesday (data is 3 days old) and shows a quick view of how large speculators or non-commercials (for-profit traders) were positioned in the futures markets.
The CFTC categorizes trader positions according to commercial hedgers (traders who use futures contracts for hedging as part of the business), non-commercials (large traders who speculate to realize trading profits) and nonreportable traders (usually small traders/speculators) as well as their open interest (contracts open in the market at time of reporting). See CFTC criteria here.

- The US introduces new import tariffs for 60 countries. Brent crude surpasses $100 per barrel Jul 24, 2026
- USD/JPY Breaks Records: Nothing Slows the Yen’s Decline Jul 24, 2026
- Oil prices reached a 6‑week high. The AUD strengthened on the back of a strong labor‑market report Jul 23, 2026
- EUR/USD Recovers as Dollar Weakens Jul 23, 2026
- Bitcoin rose to $66,000. The New Zealand dollar continues to strengthen Jul 22, 2026
- Inflationary pressure is easing in Canada. In New Zealand, on the contrary, inflation is rising Jul 21, 2026
- GBP/USD Falls After Cabinet Changes Jul 21, 2026
- Geopolitical and macroeconomic conditions continue to pressure market sentiment Jul 20, 2026
- USD/JPY Poised to Continue Gains as Expensive Oil and Lack of Support Weigh on Yen Jul 20, 2026
- COT Metals Charts: Weekly Speculator Bets led by Copper & Steel Jul 18, 2026