By InvestMacro
Here are the latest charts and statistics for the Commitment of Traders (COT) data published by the Commodities Futures Trading Commission (CFTC).
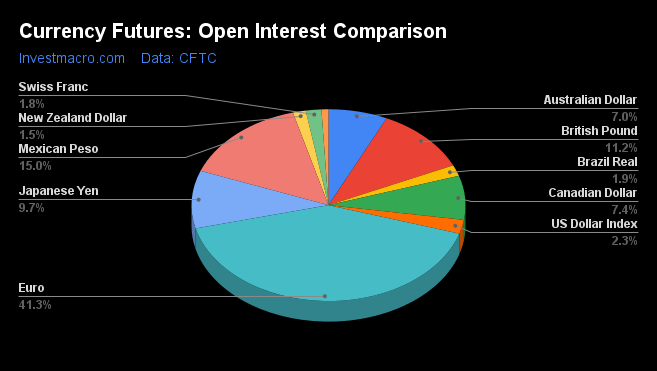
The latest COT data is updated through Tuesday January 10th and shows a quick view of how large market participants (for-profit speculators and commercial traders) were positioned in the futures markets. All currency positions are in direct relation to the US dollar where, for example, a bet for the euro is a bet that the euro will rise versus the dollar while a bet against the euro will be a bet that the euro will decline versus the dollar.
Weekly Speculator Changes led by Japanese Yen & Euro
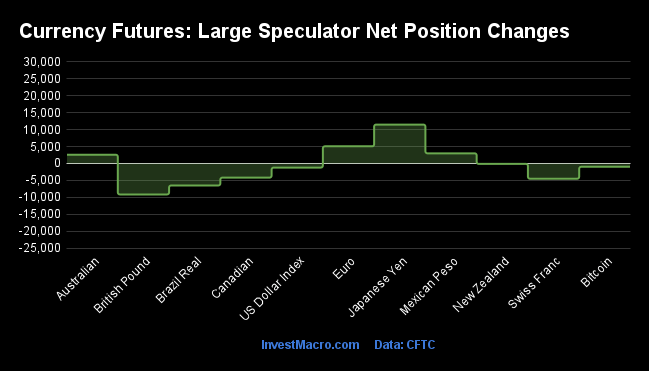
The COT currency market speculator bets were lower this week as four out of the eleven currency markets we cover had higher positioning while the other seven markets had lower speculator contracts.
Leading the gains for the currency markets was the Japanese Yen (11,487 contracts) with the EuroFX (5,067 contracts), Mexican Peso (2,995 contracts) and the Australian Dollar (2,577 contracts) also having positive weeks.
The currencies seeing declines in speculator bets on the week were the British Pound (-9,155 contracts), the Brazilian Real (-6,510 contracts), the Swiss Franc (-4,516 contracts), the Canadian Dollar (-4,189 contracts), the US Dollar Index (-1,221 contracts), Bitcoin (-983 contracts) and the New Zealand Dollar (-130 contracts) also recording lower bets on the week.
Highlighting the COT currencies data is the recent declines in the Japanese Yen bearish speculator positioning. The large speculator bets for the Yen rose by +11,487 contracts this week and have been higher for the fifth time over the past six weeks. Yen speculator bets have also gained in nine out of the past eleven weeks, going from a total of -102,618 contracts on October 25th to a 21-week bearish low of just -35,377 contracts this week.
The Yen price has been strongly improving in recent trade against the US dollar as the Yen has gained by approximately 16 percent since hitting a multi-decade low in October. The USDJPY currency pair has fallen from around 152.09 in October to trading currently below 128.00 at the close of this week.
Helping the Yen’s trend change course has been the Bank of Japan altering its bond yield policy with the BOJ allowing its bond-band to expand. Also, there has been a decline in the yield differential between Japan and the US since October – aided by a moderation in US inflation data.
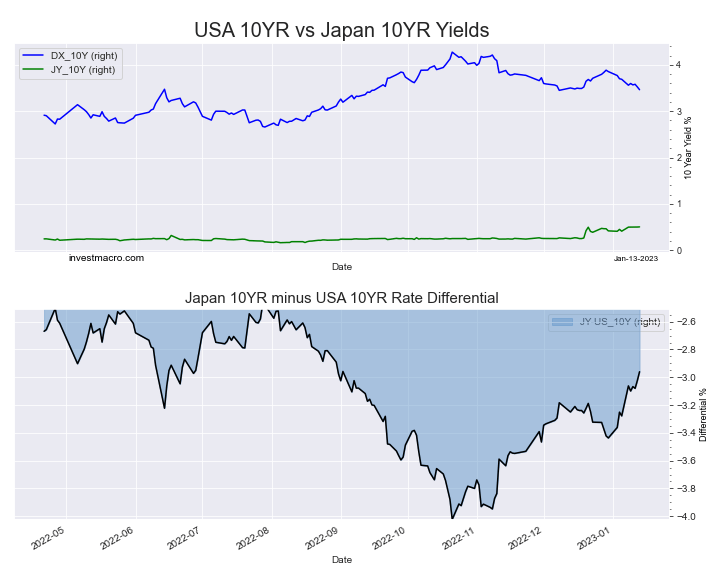
Japan minus US 10 year yield differential
| Jan-10-2023 | OI | OI-Index | Spec-Net | Spec-Index | Com-Net | COM-Index | Smalls-Net | Smalls-Index |
|---|
| USD Index | 42,307 | 50 | 16,540 | 53 | -19,280 | 45 | 2,740 | 46 |
| EUR | 746,163 | 88 | 134,982 | 76 | -182,210 | 24 | 47,228 | 54 |
| GBP | 202,713 | 39 | -29,456 | 44 | 35,268 | 58 | -5,812 | 47 |
| JPY | 175,745 | 35 | -35,377 | 47 | 34,488 | 52 | 889 | 55 |
| CHF | 33,266 | 13 | -7,370 | 35 | 8,206 | 59 | -836 | 55 |
| CAD | 133,888 | 19 | -30,955 | 5 | 27,265 | 91 | 3,690 | 38 |
| AUD | 126,028 | 27 | -33,690 | 54 | 32,210 | 43 | 1,480 | 56 |
| NZD | 27,566 | 1 | 7,350 | 74 | -8,499 | 26 | 1,149 | 65 |
| MXN | 270,826 | 82 | -53,381 | 5 | 47,206 | 92 | 6,175 | 94 |
| RUB | 20,930 | 4 | 7,543 | 31 | -7,150 | 69 | -393 | 24 |
| BRL | 33,429 | 18 | 21,701 | 69 | -23,574 | 30 | 1,873 | 83 |
| Bitcoin | 14,891 | 76 | -594 | 67 | -29 | 0 | 623 | 27 |
Strength Scores led by Euro & New Zealand Dollar
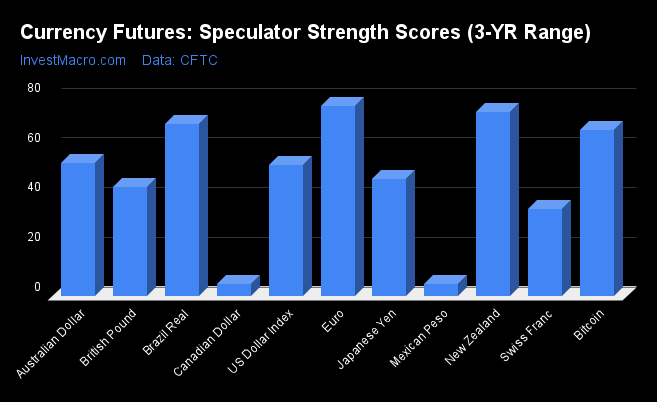
COT Strength Scores (a normalized measure of Speculator positions over a 3-Year range, from 0 to 100 where above 80 is Extreme-Bullish and below 20 is Extreme-Bearish) showed that the EuroFX (76 percent) and the New Zealand Dollar (74 percent) lead the currency markets this week. The Brazilian Real (69 percent), Bitcoin (67 percent) and the Australian Dollar (54 percent) come in as the next highest in the weekly strength scores.
On the downside, the Mexican Peso (5 percent) and the Canadian Dollar (5 percent) come in at the lowest strength levels currently and are in Extreme-Bearish territory (below 20 percent). The next lowest strength scores are the Swiss Franc (35 percent) and the British Pound (44 percent).
Strength Statistics:
US Dollar Index (52.5 percent) vs US Dollar Index previous week (54.6 percent)
EuroFX (76.4 percent) vs EuroFX previous week (74.9 percent)
British Pound Sterling (43.7 percent) vs British Pound Sterling previous week (51.6 percent)
Japanese Yen (47.1 percent) vs Japanese Yen previous week (40.0 percent)
Swiss Franc (35.1 percent) vs Swiss Franc previous week (47.1 percent)
Canadian Dollar (4.9 percent) vs Canadian Dollar previous week (9.9 percent)
Australian Dollar (53.6 percent) vs Australian Dollar previous week (51.2 percent)
New Zealand Dollar (73.9 percent) vs New Zealand Dollar previous week (74.2 percent)
Mexican Peso (4.6 percent) vs Mexican Peso previous week (3.3 percent)
Brazilian Real (69.2 percent) vs Brazilian Real previous week (76.1 percent)
Bitcoin (66.6 percent) vs Bitcoin previous week (83.7 percent)
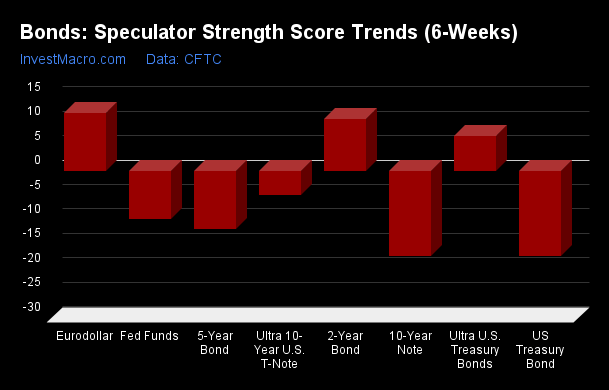
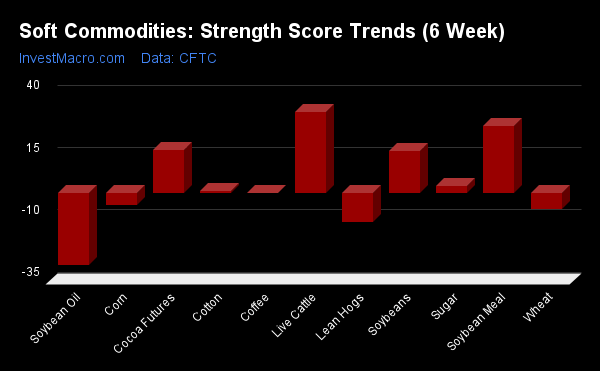
New Zealand Dollar & Japanese Yen top the 6-Week Strength Trends
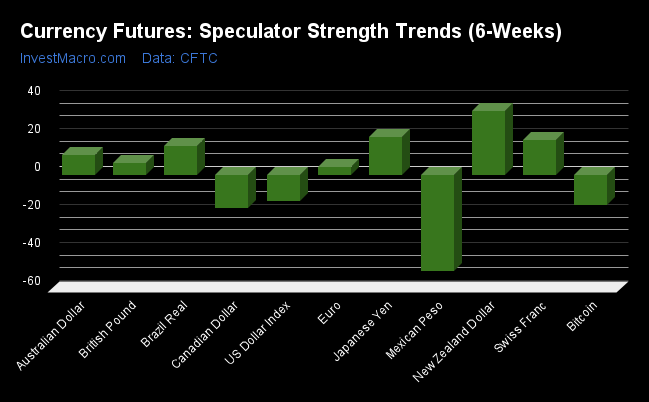
COT Strength Score Trends (or move index, calculates the 6-week changes in strength scores) showed that the New Zealand Dollar (33 percent) and the Japanese Yen (20 percent) lead the past six weeks trends for the currencies. The Swiss Franc (18 percent), the Brazilian Real (15 percent) and the Australian Dollar (10 percent) are the next highest positive movers in the latest trends data.
The Mexican Peso (-51 percent) leads the downside trend scores currently with the Canadian Dollar (-18 percent), Bitcoin (-16 percent) and the US Dollar Index (-14 percent) following next with lower trend scores.
Strength Trend Statistics:
US Dollar Index (-13.9 percent) vs US Dollar Index previous week (-10.5 percent)
EuroFX (3.9 percent) vs EuroFX previous week (2.1 percent)
British Pound Sterling (6.1 percent) vs British Pound Sterling previous week (13.4 percent)
Japanese Yen (19.7 percent) vs Japanese Yen previous week (11.1 percent)
Swiss Franc (18.2 percent) vs Swiss Franc previous week (30.7 percent)
Canadian Dollar (-17.7 percent) vs Canadian Dollar previous week (-18.0 percent)
Australian Dollar (10.1 percent) vs Australian Dollar previous week (6.0 percent)
New Zealand Dollar (33.2 percent) vs New Zealand Dollar previous week (31.5 percent)
Mexican Peso (-50.9 percent) vs Mexican Peso previous week (-51.0 percent)
Brazilian Real (15.1 percent) vs Brazilian Real previous week (20.9 percent)
Bitcoin (-16.0 percent) vs Bitcoin previous week (-5.5 percent)
Individual COT Forex Markets:
US Dollar Index Futures:
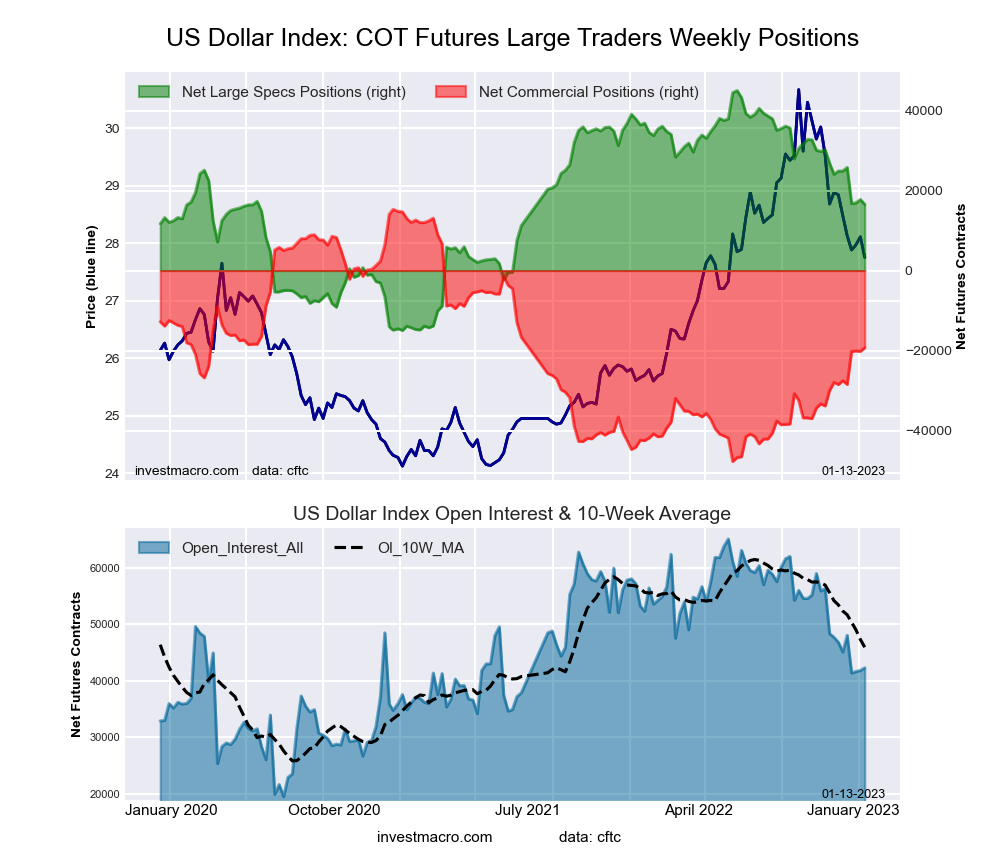 The US Dollar Index large speculator standing this week equaled a net position of 16,540 contracts in the data reported through Tuesday. This was a weekly fall of -1,221 contracts from the previous week which had a total of 17,761 net contracts.
This week’s current strength score (the trader positioning range over the past three years, measured from 0 to 100) shows the speculators are currently Bullish with a score of 52.5 percent. The commercials are Bearish with a score of 45.1 percent and the small traders (not shown in chart) are Bearish with a score of 46.5 percent.
| US DOLLAR INDEX Statistics | SPECULATORS | COMMERCIALS | SMALL TRADERS |
| – Percent of Open Interest Longs: | 80.2 | 2.7 | 13.7 |
| – Percent of Open Interest Shorts: | 41.1 | 48.3 | 7.2 |
| – Net Position: | 16,540 | -19,280 | 2,740 |
| – Gross Longs: | 33,928 | 1,158 | 5,784 |
| – Gross Shorts: | 17,388 | 20,438 | 3,044 |
| – Long to Short Ratio: | 2.0 to 1 | 0.1 to 1 | 1.9 to 1 |
| NET POSITION TREND: | | | |
| – Strength Index Score (3 Year Range Pct): | 52.5 | 45.1 | 46.5 |
| – Strength Index Reading (3 Year Range): | Bullish | Bearish | Bearish |
| NET POSITION MOVEMENT INDEX: | | | |
| – 6-Week Change in Strength Index: | -13.9 | 14.6 | -9.4 |
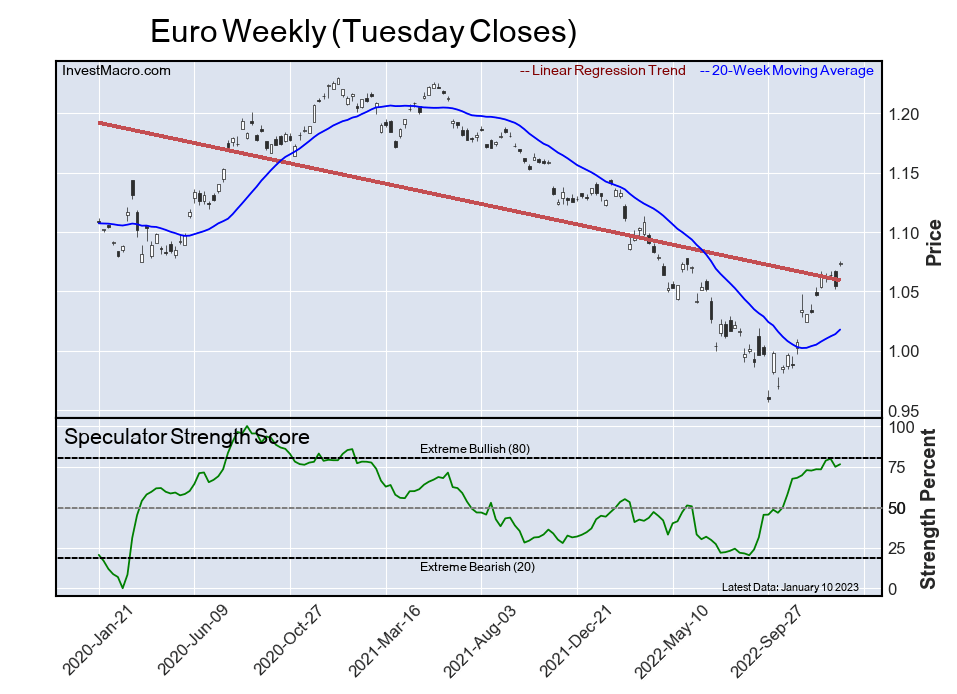
Euro Currency Futures:
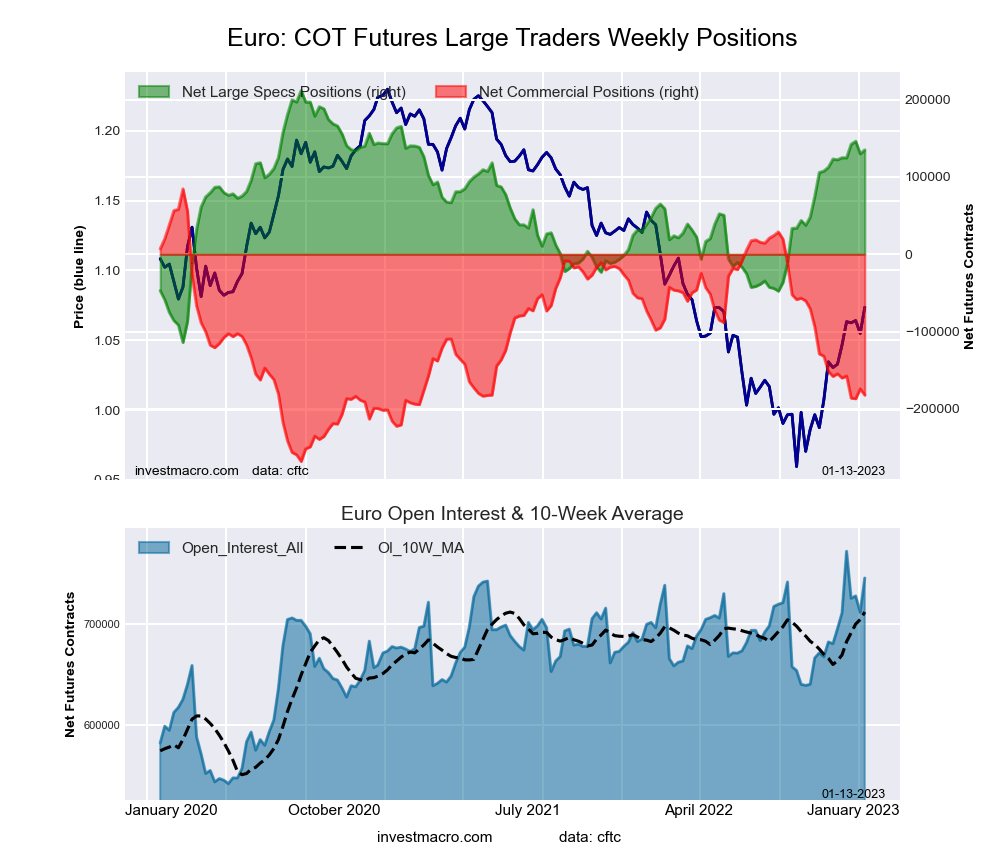 The Euro Currency large speculator standing this week equaled a net position of 134,982 contracts in the data reported through Tuesday. This was a weekly advance of 5,067 contracts from the previous week which had a total of 129,915 net contracts.
This week’s current strength score (the trader positioning range over the past three years, measured from 0 to 100) shows the speculators are currently Bullish with a score of 76.4 percent. The commercials are Bearish with a score of 24.3 percent and the small traders (not shown in chart) are Bullish with a score of 54.3 percent.
| EURO Currency Statistics | SPECULATORS | COMMERCIALS | SMALL TRADERS |
| – Percent of Open Interest Longs: | 32.0 | 53.7 | 12.2 |
| – Percent of Open Interest Shorts: | 13.9 | 78.1 | 5.9 |
| – Net Position: | 134,982 | -182,210 | 47,228 |
| – Gross Longs: | 238,623 | 400,775 | 91,275 |
| – Gross Shorts: | 103,641 | 582,985 | 44,047 |
| – Long to Short Ratio: | 2.3 to 1 | 0.7 to 1 | 2.1 to 1 |
| NET POSITION TREND: | | | |
| – Strength Index Score (3 Year Range Pct): | 76.4 | 24.3 | 54.3 |
| – Strength Index Reading (3 Year Range): | Bullish | Bearish | Bullish |
| NET POSITION MOVEMENT INDEX: | | | |
| – 6-Week Change in Strength Index: | 3.9 | -7.8 | 23.7 |
British Pound Sterling Futures:
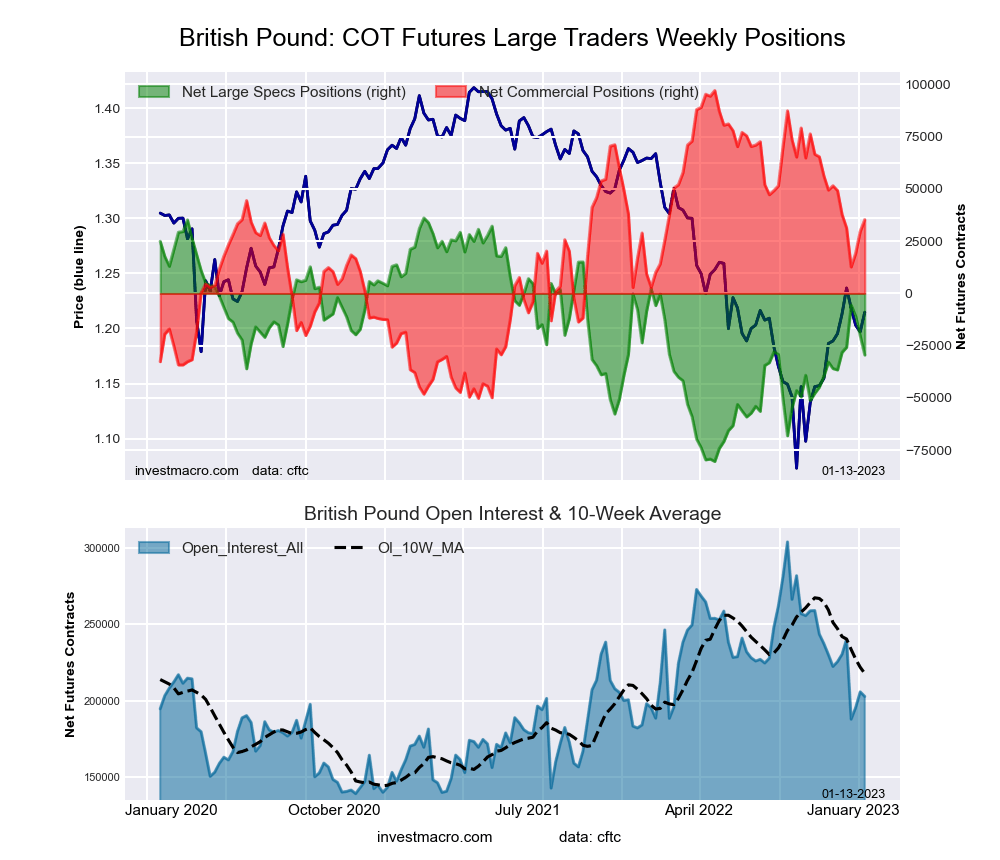 The British Pound Sterling large speculator standing this week equaled a net position of -29,456 contracts in the data reported through Tuesday. This was a weekly decrease of -9,155 contracts from the previous week which had a total of -20,301 net contracts.
This week’s current strength score (the trader positioning range over the past three years, measured from 0 to 100) shows the speculators are currently Bearish with a score of 43.7 percent. The commercials are Bullish with a score of 58.0 percent and the small traders (not shown in chart) are Bearish with a score of 46.6 percent.
| BRITISH POUND Statistics | SPECULATORS | COMMERCIALS | SMALL TRADERS |
| – Percent of Open Interest Longs: | 17.8 | 68.3 | 11.6 |
| – Percent of Open Interest Shorts: | 32.3 | 50.9 | 14.5 |
| – Net Position: | -29,456 | 35,268 | -5,812 |
| – Gross Longs: | 36,007 | 138,532 | 23,559 |
| – Gross Shorts: | 65,463 | 103,264 | 29,371 |
| – Long to Short Ratio: | 0.6 to 1 | 1.3 to 1 | 0.8 to 1 |
| NET POSITION TREND: | | | |
| – Strength Index Score (3 Year Range Pct): | 43.7 | 58.0 | 46.6 |
| – Strength Index Reading (3 Year Range): | Bearish | Bullish | Bearish |
| NET POSITION MOVEMENT INDEX: | | | |
| – 6-Week Change in Strength Index: | 6.1 | -9.5 | 13.4 |
Japanese Yen Futures:
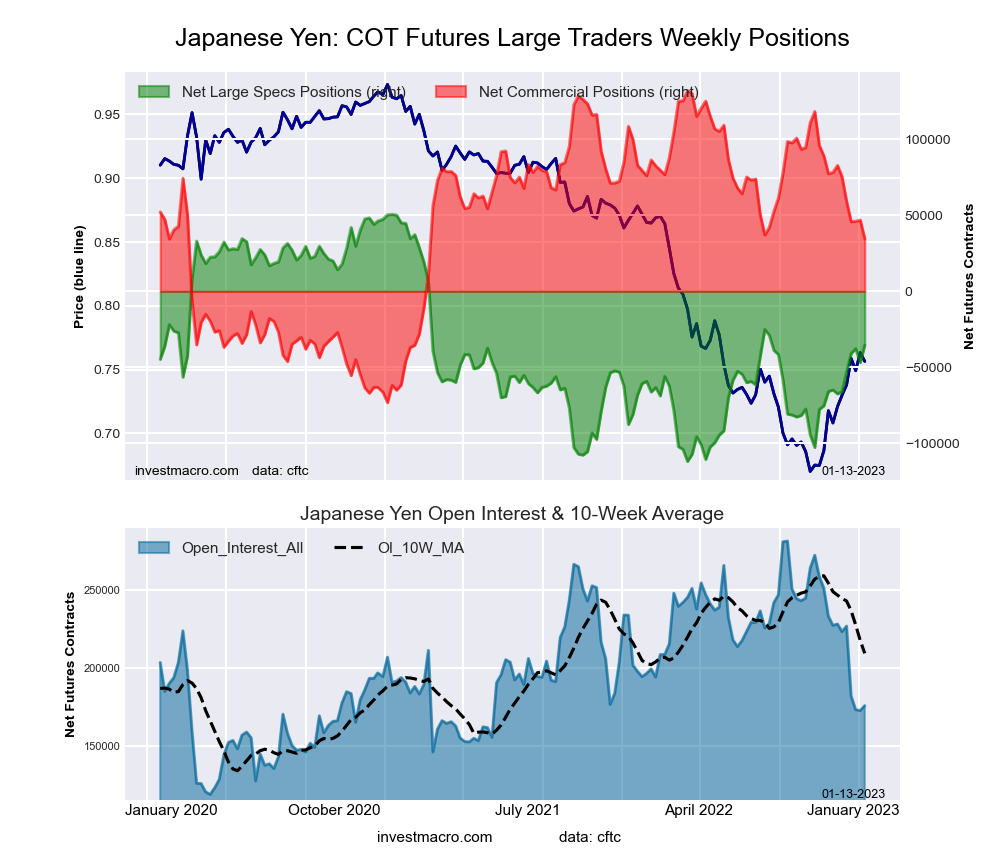 The Japanese Yen large speculator standing this week equaled a net position of -35,377 contracts in the data reported through Tuesday. This was a weekly lift of 11,487 contracts from the previous week which had a total of -46,864 net contracts.
This week’s current strength score (the trader positioning range over the past three years, measured from 0 to 100) shows the speculators are currently Bearish with a score of 47.1 percent. The commercials are Bullish with a score of 52.5 percent and the small traders (not shown in chart) are Bullish with a score of 55.2 percent.
| JAPANESE YEN Statistics | SPECULATORS | COMMERCIALS | SMALL TRADERS |
| – Percent of Open Interest Longs: | 15.0 | 67.8 | 16.5 |
| – Percent of Open Interest Shorts: | 35.1 | 48.2 | 16.0 |
| – Net Position: | -35,377 | 34,488 | 889 |
| – Gross Longs: | 26,395 | 119,166 | 28,973 |
| – Gross Shorts: | 61,772 | 84,678 | 28,084 |
| – Long to Short Ratio: | 0.4 to 1 | 1.4 to 1 | 1.0 to 1 |
| NET POSITION TREND: | | | |
| – Strength Index Score (3 Year Range Pct): | 47.1 | 52.5 | 55.2 |
| – Strength Index Reading (3 Year Range): | Bearish | Bullish | Bullish |
| NET POSITION MOVEMENT INDEX: | | | |
| – 6-Week Change in Strength Index: | 19.7 | -23.5 | 32.8 |
Swiss Franc Futures:
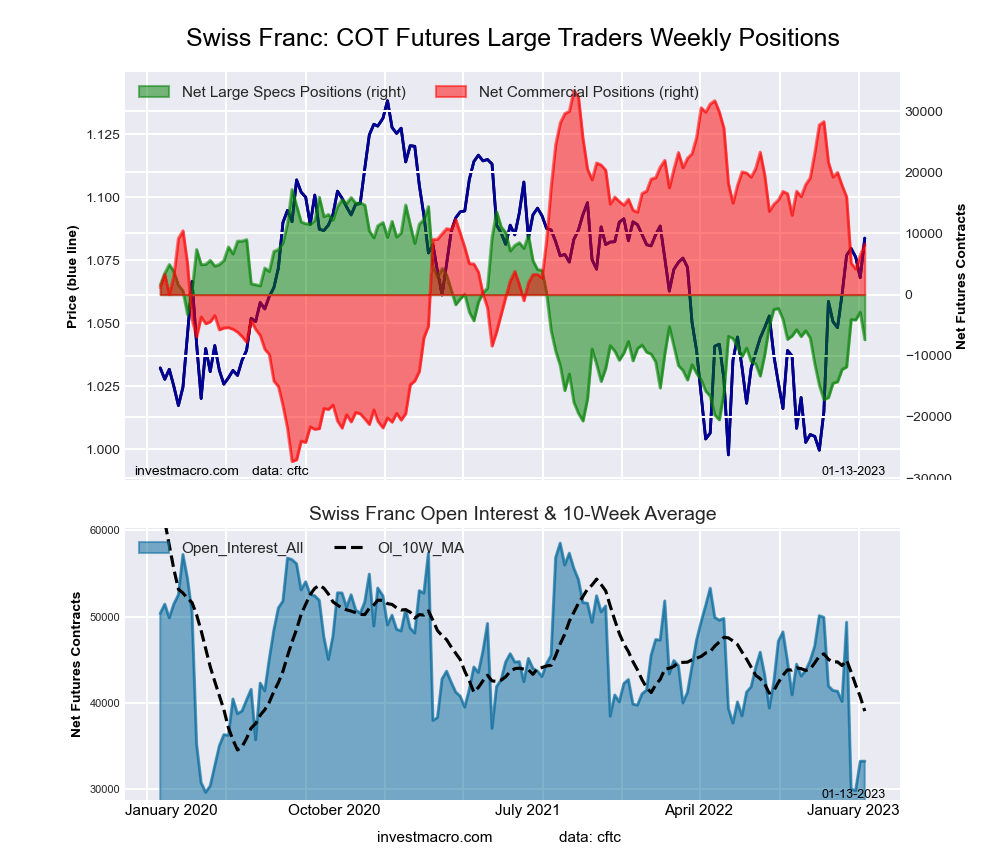 The Swiss Franc large speculator standing this week equaled a net position of -7,370 contracts in the data reported through Tuesday. This was a weekly decrease of -4,516 contracts from the previous week which had a total of -2,854 net contracts.
This week’s current strength score (the trader positioning range over the past three years, measured from 0 to 100) shows the speculators are currently Bearish with a score of 35.1 percent. The commercials are Bullish with a score of 58.5 percent and the small traders (not shown in chart) are Bullish with a score of 54.7 percent.
| SWISS FRANC Statistics | SPECULATORS | COMMERCIALS | SMALL TRADERS |
| – Percent of Open Interest Longs: | 11.0 | 51.2 | 37.7 |
| – Percent of Open Interest Shorts: | 33.2 | 26.5 | 40.2 |
| – Net Position: | -7,370 | 8,206 | -836 |
| – Gross Longs: | 3,668 | 17,034 | 12,542 |
| – Gross Shorts: | 11,038 | 8,828 | 13,378 |
| – Long to Short Ratio: | 0.3 to 1 | 1.9 to 1 | 0.9 to 1 |
| NET POSITION TREND: | | | |
| – Strength Index Score (3 Year Range Pct): | 35.1 | 58.5 | 54.7 |
| – Strength Index Reading (3 Year Range): | Bearish | Bullish | Bullish |
| NET POSITION MOVEMENT INDEX: | | | |
| – 6-Week Change in Strength Index: | 18.2 | -19.4 | 16.5 |
Canadian Dollar Futures:
 The Canadian Dollar large speculator standing this week equaled a net position of -30,955 contracts in the data reported through Tuesday. This was a weekly reduction of -4,189 contracts from the previous week which had a total of -26,766 net contracts.
This week’s current strength score (the trader positioning range over the past three years, measured from 0 to 100) shows the speculators are currently Bearish-Extreme with a score of 4.9 percent. The commercials are Bullish-Extreme with a score of 91.4 percent and the small traders (not shown in chart) are Bearish with a score of 37.5 percent.
| CANADIAN DOLLAR Statistics | SPECULATORS | COMMERCIALS | SMALL TRADERS |
| – Percent of Open Interest Longs: | 16.6 | 56.1 | 24.9 |
| – Percent of Open Interest Shorts: | 39.7 | 35.7 | 22.1 |
| – Net Position: | -30,955 | 27,265 | 3,690 |
| – Gross Longs: | 22,166 | 75,060 | 33,283 |
| – Gross Shorts: | 53,121 | 47,795 | 29,593 |
| – Long to Short Ratio: | 0.4 to 1 | 1.6 to 1 | 1.1 to 1 |
| NET POSITION TREND: | | | |
| – Strength Index Score (3 Year Range Pct): | 4.9 | 91.4 | 37.5 |
| – Strength Index Reading (3 Year Range): | Bearish-Extreme | Bullish-Extreme | Bearish |
| NET POSITION MOVEMENT INDEX: | | | |
| – 6-Week Change in Strength Index: | -17.7 | 11.1 | 3.1 |
Australian Dollar Futures:
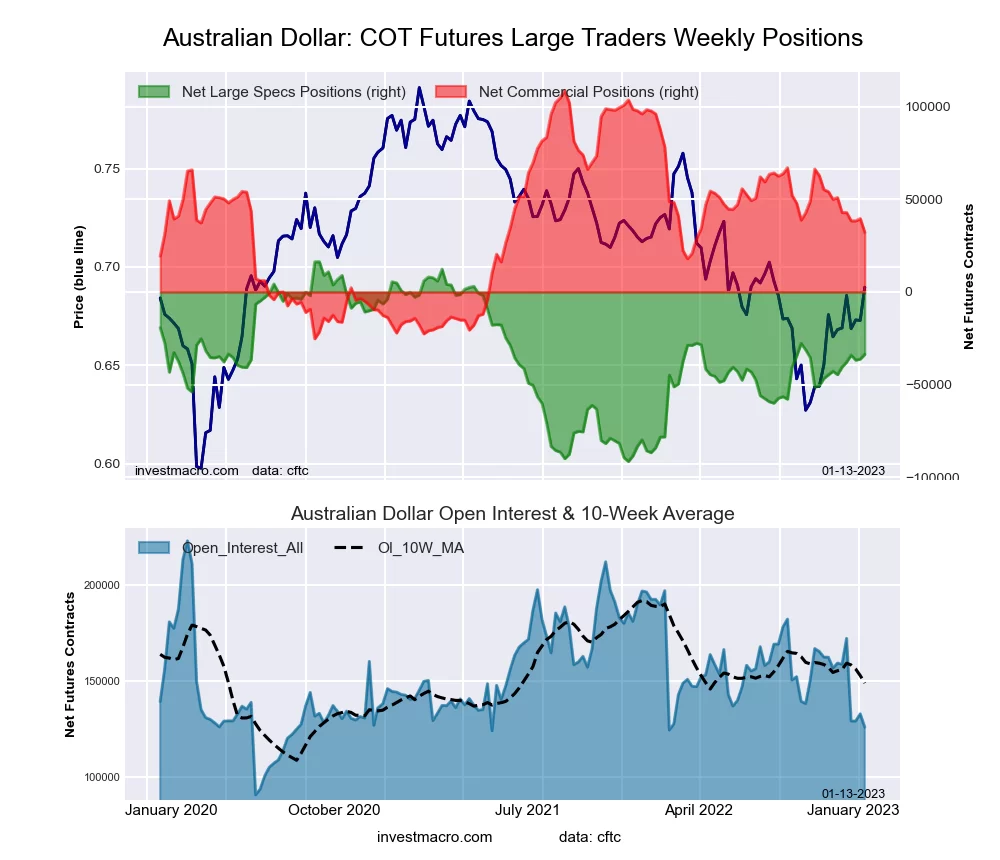 The Australian Dollar large speculator standing this week equaled a net position of -33,690 contracts in the data reported through Tuesday. This was a weekly increase of 2,577 contracts from the previous week which had a total of -36,267 net contracts.
This week’s current strength score (the trader positioning range over the past three years, measured from 0 to 100) shows the speculators are currently Bullish with a score of 53.6 percent. The commercials are Bearish with a score of 42.9 percent and the small traders (not shown in chart) are Bullish with a score of 56.0 percent.
| AUSTRALIAN DOLLAR Statistics | SPECULATORS | COMMERCIALS | SMALL TRADERS |
| – Percent of Open Interest Longs: | 24.0 | 56.9 | 16.3 |
| – Percent of Open Interest Shorts: | 50.7 | 31.3 | 15.1 |
| – Net Position: | -33,690 | 32,210 | 1,480 |
| – Gross Longs: | 30,210 | 71,696 | 20,573 |
| – Gross Shorts: | 63,900 | 39,486 | 19,093 |
| – Long to Short Ratio: | 0.5 to 1 | 1.8 to 1 | 1.1 to 1 |
| NET POSITION TREND: | | | |
| – Strength Index Score (3 Year Range Pct): | 53.6 | 42.9 | 56.0 |
| – Strength Index Reading (3 Year Range): | Bullish | Bearish | Bullish |
| NET POSITION MOVEMENT INDEX: | | | |
| – 6-Week Change in Strength Index: | 10.1 | -14.0 | 18.9 |
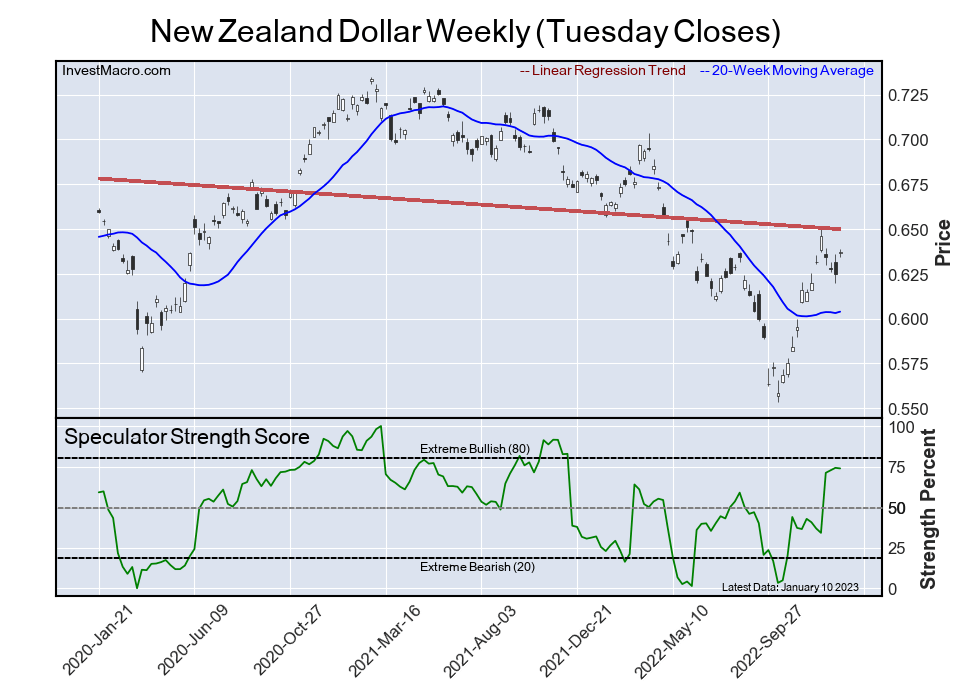
New Zealand Dollar Futures:
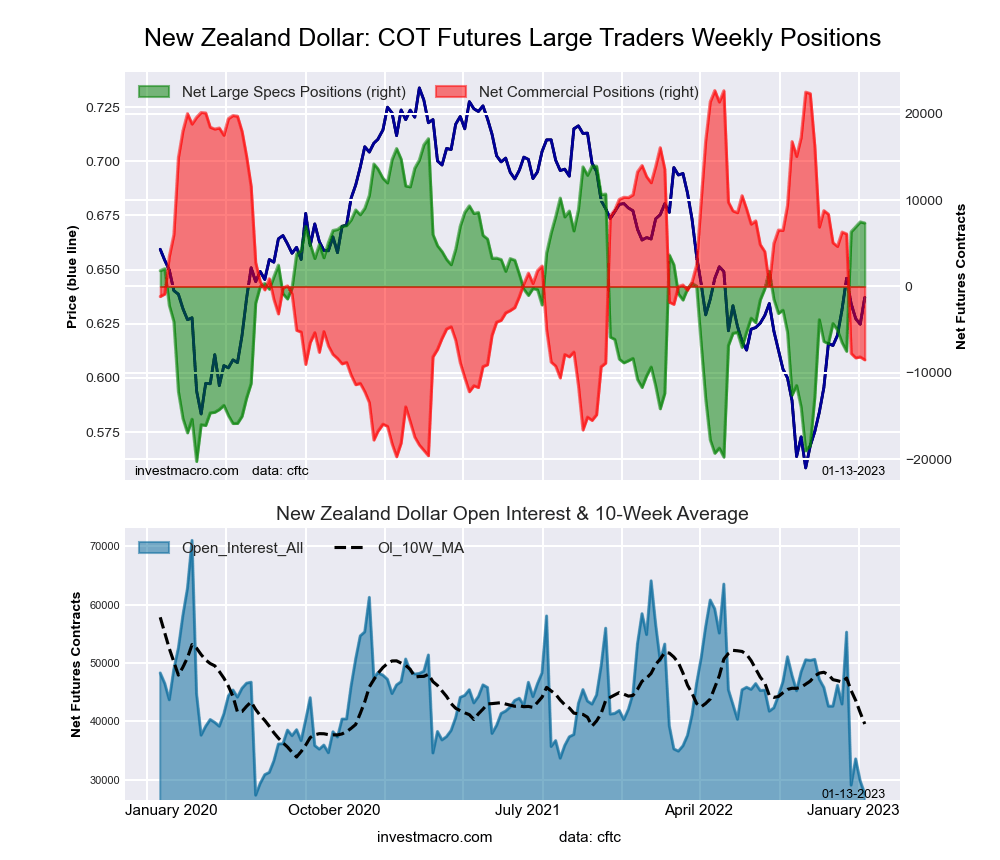 The New Zealand Dollar large speculator standing this week equaled a net position of 7,350 contracts in the data reported through Tuesday. This was a weekly reduction of -130 contracts from the previous week which had a total of 7,480 net contracts.
This week’s current strength score (the trader positioning range over the past three years, measured from 0 to 100) shows the speculators are currently Bullish with a score of 73.9 percent. The commercials are Bearish with a score of 26.5 percent and the small traders (not shown in chart) are Bullish with a score of 64.9 percent.
| NEW ZEALAND DOLLAR Statistics | SPECULATORS | COMMERCIALS | SMALL TRADERS |
| – Percent of Open Interest Longs: | 45.7 | 38.2 | 15.3 |
| – Percent of Open Interest Shorts: | 19.1 | 69.0 | 11.1 |
| – Net Position: | 7,350 | -8,499 | 1,149 |
| – Gross Longs: | 12,607 | 10,520 | 4,206 |
| – Gross Shorts: | 5,257 | 19,019 | 3,057 |
| – Long to Short Ratio: | 2.4 to 1 | 0.6 to 1 | 1.4 to 1 |
| NET POSITION TREND: | | | |
| – Strength Index Score (3 Year Range Pct): | 73.9 | 26.5 | 64.9 |
| – Strength Index Reading (3 Year Range): | Bullish | Bearish | Bullish |
| NET POSITION MOVEMENT INDEX: | | | |
| – 6-Week Change in Strength Index: | 33.2 | -31.0 | 8.5 |
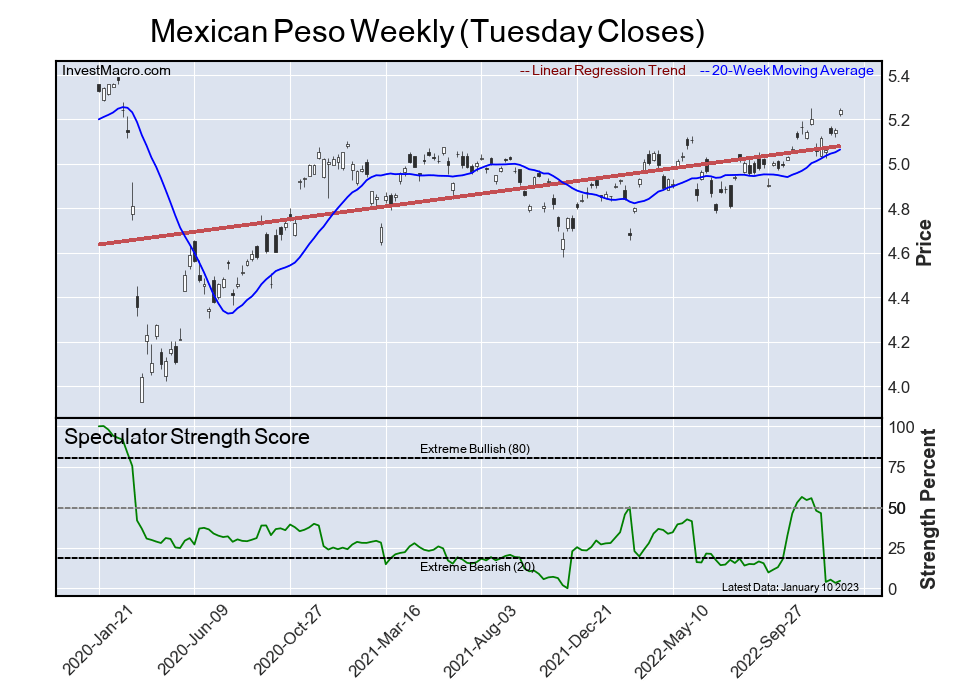
Mexican Peso Futures:
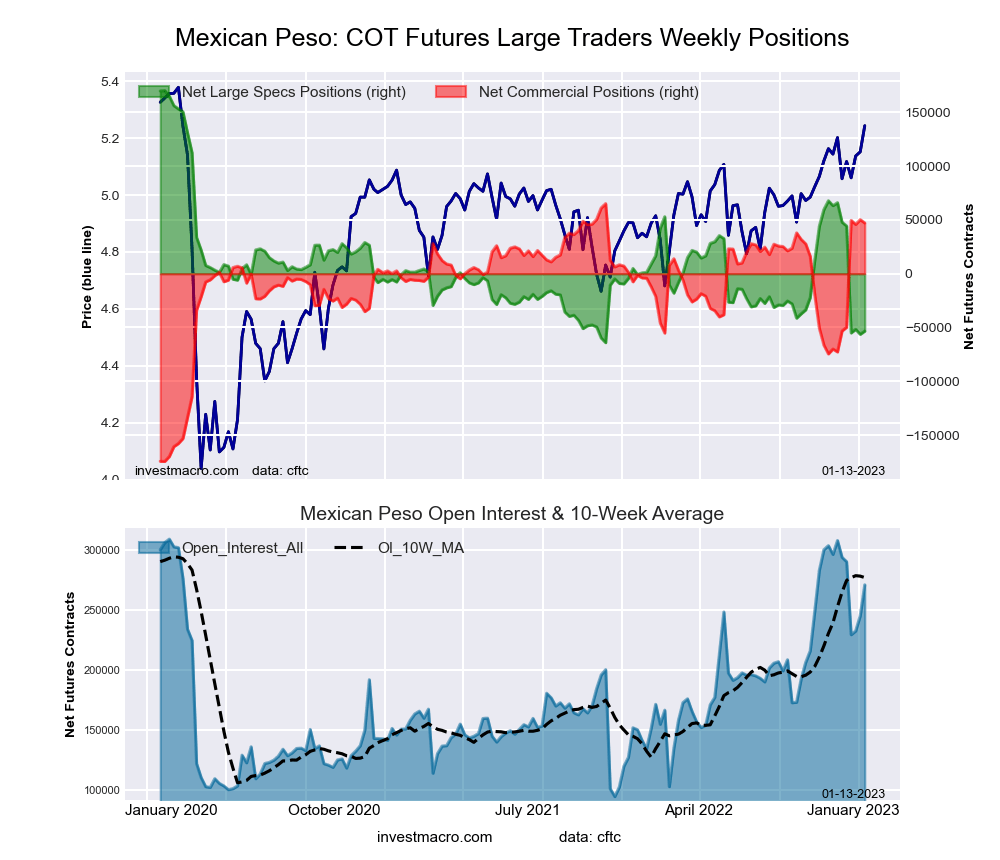 The Mexican Peso large speculator standing this week equaled a net position of -53,381 contracts in the data reported through Tuesday. This was a weekly boost of 2,995 contracts from the previous week which had a total of -56,376 net contracts.
This week’s current strength score (the trader positioning range over the past three years, measured from 0 to 100) shows the speculators are currently Bearish-Extreme with a score of 4.6 percent. The commercials are Bullish-Extreme with a score of 92.5 percent and the small traders (not shown in chart) are Bullish-Extreme with a score of 93.9 percent.
| MEXICAN PESO Statistics | SPECULATORS | COMMERCIALS | SMALL TRADERS |
| – Percent of Open Interest Longs: | 55.2 | 41.3 | 3.2 |
| – Percent of Open Interest Shorts: | 74.9 | 23.9 | 0.9 |
| – Net Position: | -53,381 | 47,206 | 6,175 |
| – Gross Longs: | 149,517 | 111,970 | 8,593 |
| – Gross Shorts: | 202,898 | 64,764 | 2,418 |
| – Long to Short Ratio: | 0.7 to 1 | 1.7 to 1 | 3.6 to 1 |
| NET POSITION TREND: | | | |
| – Strength Index Score (3 Year Range Pct): | 4.6 | 92.5 | 93.9 |
| – Strength Index Reading (3 Year Range): | Bearish-Extreme | Bullish-Extreme | Bullish-Extreme |
| NET POSITION MOVEMENT INDEX: | | | |
| – 6-Week Change in Strength Index: | -50.9 | 50.0 | -2.9 |
Brazilian Real Futures:
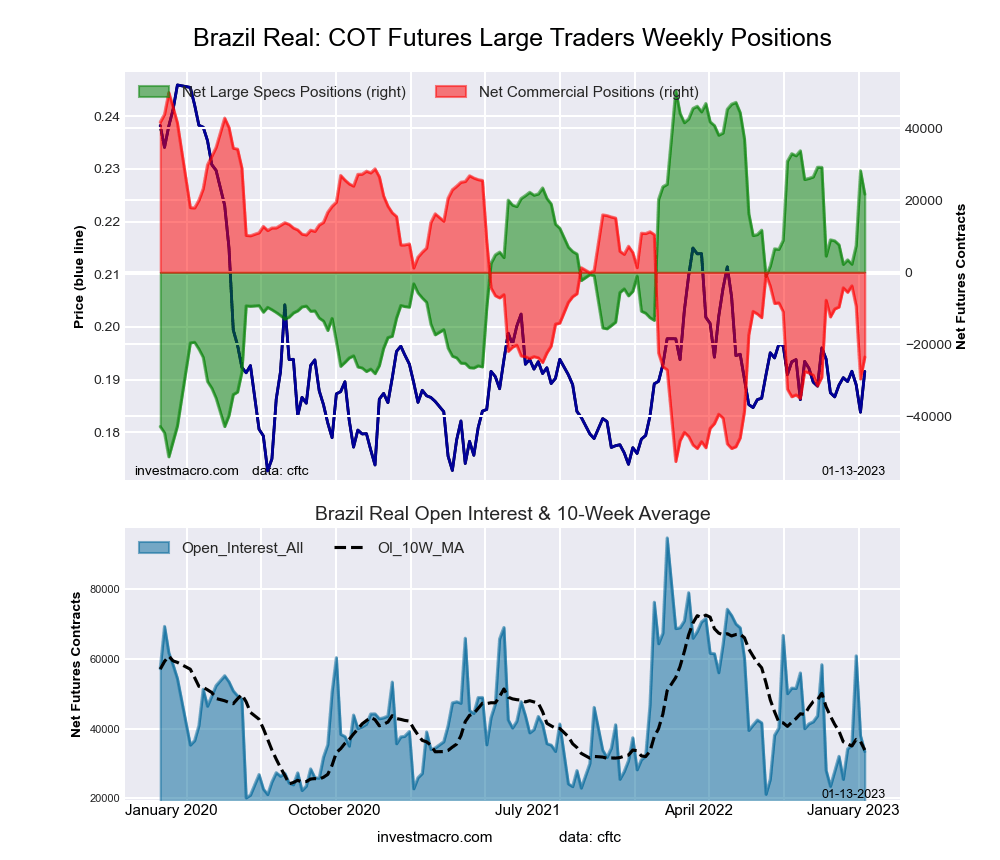 The Brazilian Real large speculator standing this week equaled a net position of 21,701 contracts in the data reported through Tuesday. This was a weekly fall of -6,510 contracts from the previous week which had a total of 28,211 net contracts.
This week’s current strength score (the trader positioning range over the past three years, measured from 0 to 100) shows the speculators are currently Bullish with a score of 69.2 percent. The commercials are Bearish with a score of 30.4 percent and the small traders (not shown in chart) are Bullish-Extreme with a score of 83.0 percent.
| BRAZIL REAL Statistics | SPECULATORS | COMMERCIALS | SMALL TRADERS |
| – Percent of Open Interest Longs: | 75.4 | 12.9 | 10.7 |
| – Percent of Open Interest Shorts: | 10.5 | 83.4 | 5.0 |
| – Net Position: | 21,701 | -23,574 | 1,873 |
| – Gross Longs: | 25,210 | 4,322 | 3,561 |
| – Gross Shorts: | 3,509 | 27,896 | 1,688 |
| – Long to Short Ratio: | 7.2 to 1 | 0.2 to 1 | 2.1 to 1 |
| NET POSITION TREND: | | | |
| – Strength Index Score (3 Year Range Pct): | 69.2 | 30.4 | 83.0 |
| – Strength Index Reading (3 Year Range): | Bullish | Bearish | Bullish-Extreme |
| NET POSITION MOVEMENT INDEX: | | | |
| – 6-Week Change in Strength Index: | 15.1 | -14.6 | -1.7 |
Bitcoin Futures:
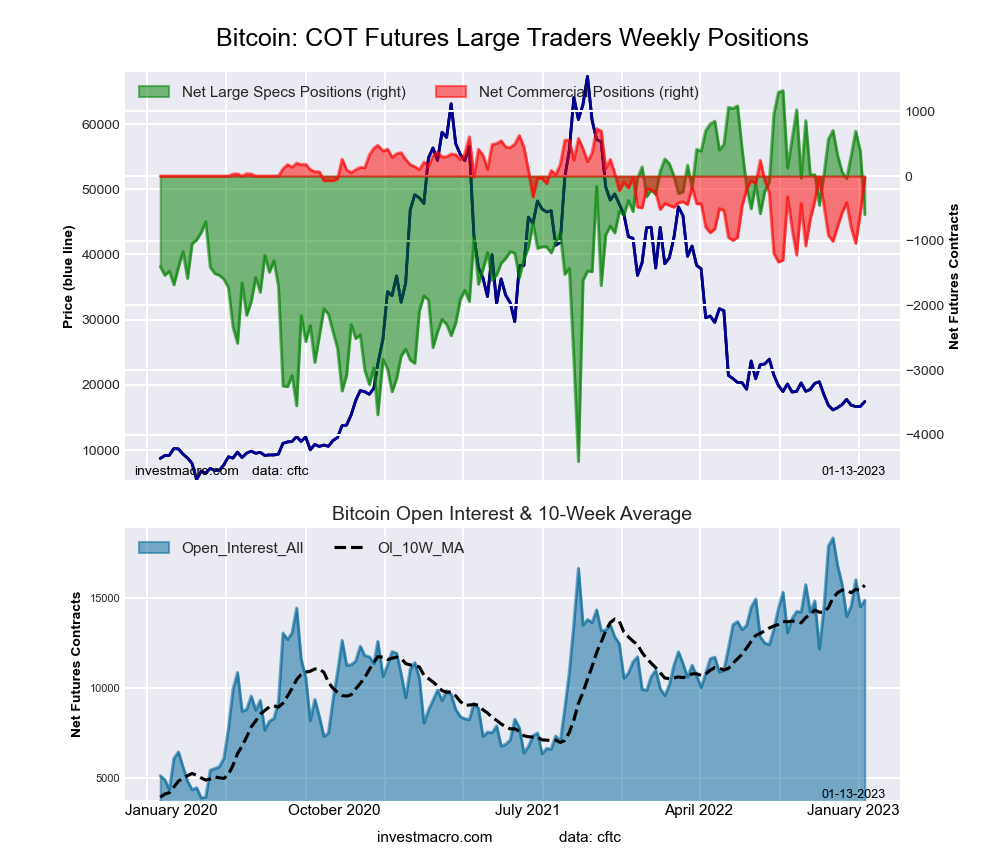 The Bitcoin large speculator standing this week equaled a net position of -594 contracts in the data reported through Tuesday. This was a weekly lowering of -983 contracts from the previous week which had a total of 389 net contracts.
This week’s current strength score (the trader positioning range over the past three years, measured from 0 to 100) shows the speculators are currently Bullish with a score of 66.6 percent. The commercials are Bullish with a score of 63.1 percent and the small traders (not shown in chart) are Bearish with a score of 27.1 percent.
| BITCOIN Statistics | SPECULATORS | COMMERCIALS | SMALL TRADERS |
| – Percent of Open Interest Longs: | 80.5 | 3.0 | 9.0 |
| – Percent of Open Interest Shorts: | 84.5 | 3.2 | 4.8 |
| – Net Position: | -594 | -29 | 623 |
| – Gross Longs: | 11,989 | 447 | 1,339 |
| – Gross Shorts: | 12,583 | 476 | 716 |
| – Long to Short Ratio: | 1.0 to 1 | 0.9 to 1 | 1.9 to 1 |
| NET POSITION TREND: | | | |
| – Strength Index Score (3 Year Range Pct): | 66.6 | 63.1 | 27.1 |
| – Strength Index Reading (3 Year Range): | Bullish | Bullish | Bearish |
| NET POSITION MOVEMENT INDEX: | | | |
| – 6-Week Change in Strength Index: | -16.0 | 36.5 | 3.8 |
Article By InvestMacro – Receive our weekly COT Newsletter
*COT Report: The COT data, released weekly to the public each Friday, is updated through the most recent Tuesday (data is 3 days old) and shows a quick view of how large speculators or non-commercials (for-profit traders) were positioned in the futures markets.
The CFTC categorizes trader positions according to commercial hedgers (traders who use futures contracts for hedging as part of the business), non-commercials (large traders who speculate to realize trading profits) and nonreportable traders (usually small traders/speculators) as well as their open interest (contracts open in the market at time of reporting). See CFTC criteria here.


