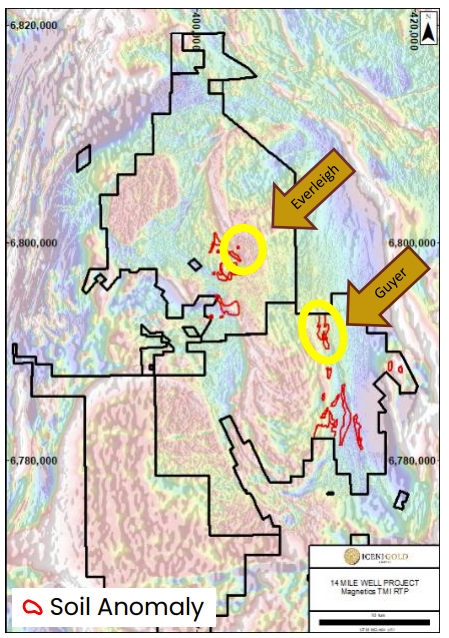
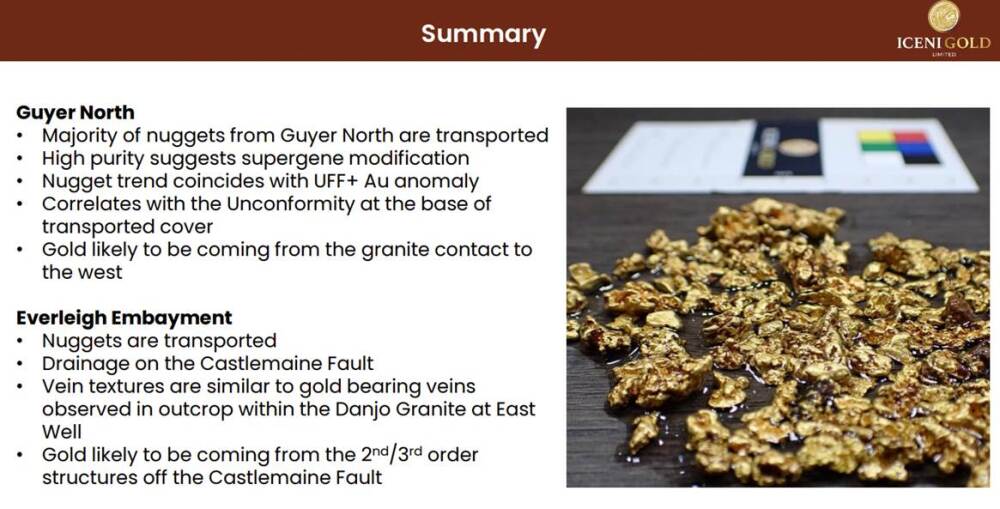
What Will Happen to PM Stocks During a Market Crash?

Source: Clive Maund  (12/20/22) 

Expert Clive Maund reviews three charts to explain to you what he believes will happen to precious metals if the stock market crashes.

The U.S. stock market is in a position to crash and has been for some time, but so far, it has held up, and a reason for this is that risk has moderated somewhat. An important signal that a crash may be imminent will be if we suddenly see the 10-year yield starting to trend higher again, which could be due to a “black swan” event.

The current story is that the Fed’s trend of rising rates is slowing, but that could change abruptly if inflation gathers pace again. There are plenty of black swans not least of which is the growing risk of Russia launching a nuke or nukes. Russia is under attack from cruise missiles launched from Ukraine deep into its territory, which is obviously the handiwork of the U.S. and faces an existential crisis that may result in it playing its big card.

While we can expect the PM sector to drop hard if the market crashes, it can also be expected to come back strongly way ahead of the broad market hitting bottom.

If this happens, markets could crater.

On the 6-month chart for the 10-year Treasury Yield, we can see that the debt market is still relatively tranquil, with the yield down at 3.48%, having peaked above 4.2% in mid-late October.

However, this chart also suggests that yields could start higher again rather than they did early in August, as the drop from October looks like a reaction back towards a rising 200-day moving average within a larger uptrend, with it now being considerably oversold on its MACD indicator.

If they do start rising again, and especially if they should rise sharply, it would probably rip the rug out from under the stock market which remains very vulnerable to such a development.

The chief purpose of this update is to consider what will happen to the PM sector in the event that the stock market does crash soon. Market crashes generally involve “pan selloffs” because the financial stresses created cause investors to “dump everything over the side” in many instances because they are forced to due to margin calls.

This is why during the initial crash phase we can expect the PM sector to drop too. To illustrate this point and see what is likely to happen to the PM sector, we are now going to go back and see what happened during the 2008 crash.

The chart below, which is for a 15-month timeframe, shows what happened to GDX during the 2008 market crash. One of the most important points to note is that the PM sector suffered a severe decline from July through September 2008 before the stock market had even begun to crash. and this decline may correspond to the heavy drop we saw in the sector from April through September this year.

That drop in 2008 was followed by a sharp relief rally in September before the stock market crashed and took the PM sector down with it, so it is interesting to observe that we have just seen a sharp relief rally in November back into an area of heavy resistance where the sector appears to be rolling over again.

Clearly, if we see a repeat of what happened in 2008 — and so far, the broad market has had an uncanny resemblance to what happened then — then the stock market will crash soon and take the PM sector with it down to a final low.

Now compare the chart above to the 15-month chart, for now, keeping in mind that there is no crash on this chart because it hasn’t started yet, but might be about to.

A very important point to note that is a big reason why we are looking at the chart for 2008 is that during the 2008 crash, the PM sector bottomed way ahead of the broad market and a powerful rally ensued that recouped almost all of the losses occasioned by the crash.

What this means is that while we can expect the PM sector to drop hard if the market crashes, it can also be expected to come back strongly way ahead of the broad market hitting bottom.

We will shortly consider the most effective ways to position for a severe sector selloff provoked by a market crash.

CliveMaund.com Disclosures

The above represents the opinion and analysis of Mr. Maund, based on data available to him, at the time of writing. Mr. Maund’s opinions are his own, and are not a recommendation or an offer to buy or sell securities. Mr. Maund is an independent analyst who receives no compensation of any kind from any groups, individuals or corporations mentioned in his reports. As trading and investing in any financial markets may involve serious risk of loss, Mr. Maund recommends that you consult with a qualified investment advisor, one licensed by appropriate regulatory agencies in your legal jurisdiction and do your own due diligence and research when making any kind of a transaction with financial ramifications. Although a qualified and experienced stock market analyst, Clive Maund is not a Registered Securities Advisor. Therefore Mr. Maund’s opinions on the market and stocks can only be construed as a solicitation to buy and sell securities when they are subject to the prior approval and endorsement of a Registered Securities Advisor operating in accordance with the appropriate regulations in your area of jurisdiction.

Disclosures:
1) Statements and opinions expressed are the opinions of Clive Maund and not of Streetwise Reports or its officers. The author is wholly responsible for the validity of the statements. Streetwise Reports was not involved in any aspect of the article preparation. The author was not paid by Streetwise Reports LLC for this article. Streetwise Reports was not paid by the author to publish or syndicate this article.

2) This article does not constitute investment advice. Each reader is encouraged to consult with his or her individual financial professional and any action a reader takes as a result of information presented here is his or her own responsibility. By opening this page, each reader accepts and agrees to Streetwise Reports’ terms of use and full legal disclaimer. This article is not a solicitation for investment. Streetwise Reports does not render general or specific investment advice and the information on Streetwise Reports should not be considered a recommendation to buy or sell any security. Streetwise Reports does not endorse or recommend the business, products, services or securities of any company mentioned on Streetwise Reports.

3) From time to time, Streetwise Reports LLC and its directors, officers, employees or members of their families, as well as persons interviewed for articles and interviews on the site, may have a long or short position in securities mentioned. Directors, officers, employees or members of their immediate families are prohibited from making purchases and/or sales of those securities in the open market or otherwise from the time of the decision to publish an article until three business days after the publication of the article. The foregoing prohibition does not apply to articles that in substance only restate previously published company releases.

The US Real Estate Market is showing weakness. Bank of Japan aims to normalize monetary policy

By JustMarkets

The Bank of Japan alarmed investors yesterday after it announced it would allow Japan’s 10-year government bond yields to rise 50 basis points or 0.5%. That’s above the previous limit of 25 basis points and signals the Bank of Japan’s first move to tighten monetary policy by expanding its target range for bond yields. This is a forced measure of policy tightening due to a lack of demand and liquidity in the country’s debt market, as well as capital outflows from Japan. Japan’s rising government bond yields led to rising global bond yields, including Treasuries, which in turn led to falling indices. Nevertheless, the growth of energy companies’ shares due to a jump in oil prices helped stabilize the stock market as a whole. At the close of the stock exchange, the Dow Jones Index (US30) gained 0.28%, and the S&P 500 Index (US500) added 0.10%. The Technology Index NASDAQ (US100) closed at its opening level.

In the US, housing construction exceeded expectations in November. Still, the number of permits, an indicator of future project activity, fell to an 18-month low, adding to fears of further activity decline.

European stock markets traded flat yesterday. Germany’s DAX (DE30) decreased by 0.42%, France’s CAC 40 (FR40) lost 0.35%, Spain’s IBEX 35 (ES35) added 0.59%, and the British FTSE 100 (UK100) closed Tuesday at plus 0.13%.

European stocks fell on Tuesday due to rate-sensitive tech and industrial stocks after the Bank of Japan (BOJ) shocked global markets with a surprise policy change. While this was a minor policy adjustment, it was the first adjustment by the BOJ in a very long time. That’s why the market reaction has been substantial.

Gold and silver continue to rise amid a decline in US government bonds. Gold has an inverse correlation to the dollar index and government bonds, and that’s why the “yellow metal” was falling against a background of tighter monetary policy from the Fed. But now the Fed is getting closer to the end of the cycle, so more and more investors are moving into gold amid the approaching recession.

Oil prices ended higher Tuesday as a worsening forecast for a major storm in the US raised fears that millions of Americans could limit their travel plans during the New Year holiday. Oil prices were supported by a weaker dollar and a US oil restocking plan, but gains were limited by uncertainty over the rising number of COVID-19 cases in China.

TC Energy Corp. submitted its plan to US regulators to restart the Keystone pipeline nearly two weeks after the pipeline rupture that led to the largest oil spill in the United States in nine years.

Asian markets were mostly down yesterday. Japan’s Nikkei 225м(JP225) decreased by 2.46%, China’s FTSE China A50 (CHA50) lost 2.41%, Hong Kong’s Hang Seng (HK50) ended the day down by 1.33%, India’s NIFTY 50 (IND50) fell by 0.19%, and Australia’s S&P/ASX 200 (AU200) ended Tuesday down by 1.54%.

Tighter Bank of Japan policy will remove one of the last global anchors that helped keep borrowing costs low more broadly. Many economists now expect the Bank of Japan to raise interest rates next year, joining the Fed, ECB, and others after a decade of extraordinary stimulus.

S&P 500 (F) (US500) 3,821.62 +3.96 (+0.10%)

Dow Jones (US30) 32,849.74 +92.20 (+0.28%)

DAX (DE40) 13,884.66 −58.21 (−0.42%)

FTSE 100 (UK100) 7,370.62 +9.31 (+0.13%)

USD Index 104.00 -0.72 (-0.68%)

Important events for today:
  • – Canada Consumer Price Index (m/m) at 15:30 (GMT+2);
  • – US CB Consumer Confidence (m/m) at 17:00 (GMT+2);
  • – US Existing Home Sales (m/m) at 17:00 (GMT+2);
  • – US Crude Oil Reserves (w/w) at 17:30 (GMT+2).

By JustMarkets


This article reflects a personal opinion and should not be interpreted as an investment advice, and/or offer, and/or a persistent request for carrying out financial transactions, and/or a guarantee, and/or a forecast of future events.

Data on New Cell Therapy for LBCL Encouraging, Analyst Says

The biopharma behind the investigational treatment plans to advance it into a potentially pivotal clinical program next year, noted a BTIG report.

Adicet Bio Inc. (ACET:NASDAQ) presented “encouraging” data from its ongoing Phase 1 trial evaluating the company’s lead therapeutic ADI-001, its chimeric antigen receptor (CAR) T-cell therapy, in large B-cell lymphoma, reported BTIG analyst Justin Zelin in a Dec. 12 research note. The data update took place at the American Society of Hematology’s annual meeting on Dec. 10 to 13.

The study showed Adicet’s anti-CD20, allogeneic, gamma delta CAR T-cell therapy to have a six-month complete response rate that is comparable to that of autologous CAR-T therapy as well as key safety advantages, Zelin highlighted.

“An off-the-shelf, allogeneic therapy with [a] differentiated and well-tolerated safety profile carries a strong value proposition in this setting,” Zelin commented.

Next Steps and Possible Catalysts

Massachusetts-based Adicet will continue enrolling patients in the study to gain further insights into durability and the recommended Phase 2 dose selection, noted Zelin. The likely choices are two infusions of DL3 (300 million cells) with one lymphodepletion or one dose of DL4 (1 billion cells).

“We look forward to clinical and regulatory updates from the company next year,” wrote Zelin.

Also, in about Q2/23, Adicet plans to move ADI-001 into a potentially pivotal clinical program, Zelin noted.

This would include two studies, one in post-CAR-T large B cell lymphoma patients and the other in earlier-line large B cell lymphoma patients. Discussions are planned with the U.S. Food and Drug Administration and the European Medicines Agency about the regulatory path forward for this program.

“We look forward to clinical and regulatory updates from the company next year,” wrote Zelin.

Positive Efficacy and Safety

The updated Phase 1 data indicated a potential efficacy signal for ADI-001 in post-CAR-T large B cell lymphoma patients, Zelin wrote. At all ADI-001 dose levels, patients showed a 75% overall response rate and a 69% complete response rate. Five patients, who previously relapsed on anti-CD19 autologous CAR-T therapy, had 100% overall response and complete response rates.

Zelin relayed that Dr. Sattva Neelapu, in the Department of Lymphoma-Myeloma at the MD Anderson Cancer Center, “expressed his excitement of the complete response rate in heavily pretreated patients with few alternative treatment options (estimated median progression-free survival is about two months), especially in post-CAR-T large B cell lymphoma patients. Dr. Neelapu notes a roughly 30% duration of response at six months would be viewed favorably.”

BTIG has a Buy rating and a US$34 per share price target on Adicet, which is currently trading at about US$19.88 per share.

In terms of safety, at the DL3+ dose (DL3: 300 million CAR+ cells; DL4: 1 billion CAR+ cells), at which the complete response rate was 86%, there were no grade 3 or higher side effects, including cytokine release syndrome, immune effector cell associated neurotoxicity, graft versus host disease or dose-limiting toxicities. Infections were minimal despite enhanced lymphodepletion being employed.

The “ability to safely redose with a single lymphodepletion regimen supports outpatient-community dosing as key advantages for Adicet’s allogeneic cell therapy,” Zelin added.

BTIG has a Buy rating and a US$34 per share price target on Adicet, which is currently trading at about US$19.88 per share.

Disclosures:

1) Doresa Banning compiled this article for Streetwise Reports LLC and provides services to Streetwise Reports as an independent contractor. She or members of her household own securities of the following companies mentioned in the article: None. She or members of her household are paid by the following companies mentioned in this article: None.

2) The following companies mentioned in this article are billboard sponsors of Streetwise Reports: None. Click here for important disclosures about sponsor fees.

3) Comments and opinions expressed are those of the specific experts and not of Streetwise Reports or its officers. The information provided above is for informational purposes only and is not a recommendation to buy or sell any security.

4) The article does not constitute investment advice. Each reader is encouraged to consult with his or her individual financial professional and any action a reader takes as a result of information presented here is his or her own responsibility. By opening this page, each reader accepts and agrees to Streetwise Reports’ terms of use and full legal disclaimer. This article is not a solicitation for investment. Streetwise Reports does not render general or specific investment advice and the information on Streetwise Reports should not be considered a recommendation to buy or sell any security. Streetwise Reports does not endorse or recommend the business, products, services or securities of any company mentioned on Streetwise Reports.

5) From time to time, Streetwise Reports LLC and its directors, officers, employees or members of their families, as well as persons interviewed for articles and interviews on the site, may have a long or short position in securities mentioned. Directors, officers, employees or members of their immediate families are prohibited from making purchases and/or sales of those securities in the open market or otherwise from the time of the decision to publish an article until three business days after the publication of the article. The foregoing prohibition does not apply to articles that in substance only restate previously published company releases.

6) This article does not constitute medical advice. Officers, employees and contributors to Streetwise Reports are not licensed medical professionals. Readers should always contact their healthcare professionals for medical advice.

BTIG Research, Adicet Bio Inc., December 12, 2022

Analyst Certification: I, Justin Zelin, hereby certify that the views about the companies and securities discussed in this report are accurately expressed and that I have not received and will not receive direct or indirect compensation in exchange for expressing specific recommendations or views in this report.

I, Vishal Sethi, hereby certify that the views about the companies and securities discussed in this report are accurately expressed and that I have not received and will not receive direct or indirect compensation in exchange for expressing specific recommendations or views in this report.

General Disclosures: Research reports produced by BTIG LLC (“BTIG”) are published for and intended to be distributed solely to BTIG institutional and corporate clients. Recipients of BTIG reports will not be considered clients of BTIG solely because they may have received such BTIG report.

To the extent recipient accesses BTIG research, whether on a BTIG research website or through a third-party platform, BTIG is able to search, filter, download and review information on the readership of BTIG’s research, including the specific research consumed and the name, company name, email address and, in certain circumstances, the location of the individual who accessed the research (the “Readership Information”). Recipient consents to BTIG’s receipt of the Readership Information, including receipt of that information from a third party.

The research analyst(s) responsible for the preparation of this report receives compensation based upon a variety of factors, including the quality and accuracy of research, internal/client feedback, and overall Firm revenues. BTIG reports are based on public information and BTIG considers the same to be reliable, comprehensive information, but makes no representation or warranty that the reports are accurate or complete. BTIG opinions and information provided in this report are as of the date of the report and may change without notice. An issuer may be classified as “Under Review” or “Research Restricted”. In these cases, investors should consider any previous investment recommendation and/or rating to a subject company/issuer to no longer be current and should not be relied upon nor considered a solicitation.

This research report is not an offer to buy or sell or solicitation of an offer to buy or sell any security in any jurisdiction where such an offer or solicitation would be illegal. This research report was not drafted specifically for any particular individual or entity and is not a personal recommendation to participate in any particular trading strategy or transaction. Any recipient of this research report should obtain independent advice specific to their personal circumstances before undertaking any investment activity and must make their own independent evaluation of any securities or financial instruments.

Facts, views or opinions presented in this report have not been reviewed by, and may not reflect information known to, employees or other professionals in the “BTIG Group” (BTIG Group includes, but is not limited to, BTIG and its parents, subsidiaries and/ or affiliates). BTIG Group employees, including Sales Representatives and Traders, may provide oral or written commentary or advice that may be inconsistent with the opinions and/or views expressed in this research report. BTIG Group employees and/or its affiliates not involved in the preparation of this research report may have investments in securities or derivatives of securities of companies mentioned in this report that are inconsistent with the views discussed in this report.

Investors in securities products bear certain risks in conjunction with those investments. The value of, and income from, any investments may vary because of changes in interest rates or foreign exchange rates, securities prices or market indexes, operational or financial conditions of companies or other factors within or beyond the companies’ control. Recipient of the research reports should be aware that investments in securities may pose significant risks due to the inherent uncertainty associated with relying on forecasts of various factors that can affect the earnings, cash flow and overall valuation of a company.

Any investment in securities should be undertaken only upon consideration of issues relating to the recipient’s overall investment portfolio and objectives (such as diversification by asset class, industry or company) as well as time horizon and liquidity needs. Further, past performance should not be taken as an indication or guarantee of future performance, and no representation or warranty, express or implied, is made regarding future performance. There may be time limitations on the exercise of options or other rights in any securities transactions.

Investing in foreign markets and securities, including ADRs, is subject to additional risks such as currency fluctuation, limited information, political instability, economic risk, and the potential for illiquid markets. Investing in emerging markets may accentuate these risks. Non-U.S. reporting issuers of foreign securities, however, may not make regular or complete public disclosure relating to their financial condition or the securities that they issue.

The trademarks and service marks contained herein are the property of their respective owners. Third-party data providers make no warranties or representations of any kind relating to the accuracy, completeness, or timeliness of the data they provide and shall not have liability of any damages of any kind relating to such data. The report or any portion hereof may not be reprinted, sold or redistributed without the written consent of BTIG. This report is intended only for use by the recipient. The recipient acknowledges that all research and analysis in this report are the property of BTIG and agrees to limit the use of all publications received from BTIG within his, or her or its, own company or organization. No rights are given for passing on, transmitting, re transmitting or reselling the information provided.

Jurisdiction and Dissemination: BTIG is a U.S. broker-dealer and member of FINRA and SIPC

Franco’s Largest Asset Is at Risk

Source: Adrian Day  (12/19/22)

Today, expert Adrian Day gives updates on developments affecting several of his favorite companies, mostly positive but with one potentially damaging piece of news.

Franco-Nevada Corp. (FNV:TSX; FNV:NYSE) shares were down sharply after the government of Panama effectively seized First Quantum’s Cobre Panama mine, on which Franco has its largest stream, representing about 15% of both Net Asset Value and revenues.

The government announced it had ordered the mine shut down and that it was taking over care and maintenance until another “partner” could be found. There has been a long-simmering dispute over payments due from the company to the government. The mine represents the country’s largest investment and a large tax contributor.

The move stunned the local business community as well as Canada’s mining industry. It may be a negotiating tactic by the government, but given the drastic action, it would seem that there is something else behind this. Perhaps the government simply wants to show that it is serious, though that would be a pretty high-stakes move.

We suspect, however, that there will be a resolution. The mine means too much to First Quantum and to the government, whose reputation would be severely damaged were the seizure to hold. In fact, the mine is continuing to operate since halting operations would require resolutions to rescind the contracts, thus allowing time for talks to continue.

Franco Will Survive in Any Event

Franco has a gold stream on the copper mine that has only just achieved a full run rate. With over US$1 billion in cash, Franco can withstand the financial risk. It may yet reach its annual guidance, even with the shortfall from Cobre Panama. More important is whether First Quantum resumes ownership since streams are usually with the operator.

The shares fell from Wednesday’s close of US$144, where they were arguably ahead of themselves anyway. Franco has a rock-solid balance sheet, top management, and a well-diversified portfolio. It is still too early to jump back in — the shares are still well above where they were early last month — and the Panama issue may drag on for a while, but we shall certainly be looking for opportunities to buy shares in this blue chip.

Orogen Cash-flow Positive With Jump in Revenues

Orogen Royalties Inc. (OGN:TSX.V) reported a strong quarter, with royalty revenue from Ermitaño in Mexico up nearly 40% from previous quarters. The company also generated net income from its prospect generation business, involving gains on project sales and active option agreements. It has also been busy with transactions; so far this year, nine deals have been completed adding eight royalties. Overall, the company achieved positive cash flow from operations and ended the quarter with about CA$8.5 in cash and short-term investments.

The year ahead promises to be a very strong one. First Majestic Silver Corp. (FR:TSX; AG:NYSE; FMV:FSE) has indicated that all the ore feed for its mill in 2023 will come from Ermitaño (rather than a blend with the original lower-grade Santa Elena deposit), which should boost Orogen’s revenue.

This Could Be Huge and May Spur M&A

In addition, in February, AngloGold Ashanti Ltd. (AU:NYSE; ANG:JSE; AGG:ASX; AGD:LSE) is expected to publish a pre-feasibility study on its central Silicon deposit as well as a conceptual study of the Merlin deposit, in southern Nevada. Orogen holds a 1% royalty on an area covering both deposits. Altius has a 1.5% royalty over the same area and also claims a royalty of a “larger area of interest,” but Anglo is disputing that, and the claim is currently in arbitration.

We have been looking for some transaction of some type involving Orogen and Altius’ Silicon royalties, but the arbitration may delay this. Anglo has been publicly excited about the Silicon district, indicating it expects a multidecade operation. Silicon itself, known to be mineralized to 625 meters, remains open at depth. The district is clearly large and Anglo is planning to take its time in methodically studying the entire area.

Orogen is one of our top holdings. After meandering around the CA$0,40 mark for the past six months, the stock suddenly jumped last week amid higher-than-normal volume. The company has been doing some investor meetings, and there is no other reason for stock strength that we can discern.

Although we like Orogen and believe it represents strong value even at the higher price, we will hold off on additional buying to see if there is an easing over the normally quiet holiday period. But we want to be building positions.

More Activity and Success at Midland Means Shares Should Be Owned

Midland Exploration Inc. (MD:TSX.V) continues to achieve exploration success at various properties; it is in as good a position as any exploration company for discovery success, while its shares continue to languish, providing an excellent opportunity for investors to continue to accumulate.

First, Midland announced the discovery of a large copper-gold-silver-molybdenum mineralized system on its La Peltrie property in the Detour region of northern Quebec. The property is under the option to Probe Metals. The discovery was made from a single drill hole in the first drilling but suggests a larger system. The companies plan to follow up early next year.

Earlier, Midland had reported the discovery of at least two new gold-bearing structures during a recent prospecting program on the Laflamme joint-venture project in Abitibi, Quebec. This is an early stage, but the area is highly prospective for new discoveries.

Separately, the company announced it was beginning a 10,000-metre drilling program on its gold and nickel-copper projects in the Abitibi region, designed to test more than 40 of its targets developed over the past few years. The targets are on five separate projects, and drilling will continue until March.

Midland has a solid balance sheet and strong management. It has numerous projects, including 10 active joint ventures, across Quebec and is very active. With a market cap of only CA$28 million, it is very undervalued and trading around its all-time lows. It is a strong Buy at this level.

Altius Ups Interest in Renewal Unit

Altius Minerals Corp. (ALS:TSX.V) invested a further US$21 million in Altius Renewal Royalties (ARR.NY), which in turn holds 50% of Great Bear Renewables. This brings Altius’ interest in ARR to 59%. Great Bear, which is already cash flow positive, also announced a US$46 million royalty investment in a California solar project. See also comments above regarding Altius’ Silicon royalty.

Altius is a core holding for us, with innovative management which has the discipline to act counter-cyclically — essential in a highly cyclical sector — and a diversified group of royalties. There are several potential growth opportunities in the next year or two.

We recommend buying back in July when the shares were around US$16. Given the volatility of the stock, we will wait for new buying opportunities.

Nestle Reaffirms Focus and Continues To Grow

Nestle SA (NESN:VX; NSRGY:OTC) confirmed an 8% organic sales growth target and upper single-digit earnings-per-share annual growth. At its investor seminar in Europe, it also confirmed that it would continue to focus on food and beverages, including Nestlé Health Science and nutritional health products, as an additional growth platform.

The company also said it aims to continue increasing its annual dividend each year. Analyst forecasts are for an April dividend of Sfr 3, up from 2.80 earlier this year. Next year’s dividend has not yet been announced. Nestlé also confirmed its ongoing program to repurchase CHF 20 billion of its shares over the period 2022 to 2024.

The company has already bought around CHF 9.7 billion of shares in 2022. Nestlé is a core global holding, and for those who do not already own it, it can be bought at this level.

TOP BUYS, in addition to above, include Ares Capital Corp. (ARCC:NASDAQ).

Adrian Day Disclosures:

Adrian Day’s Global Analyst is distributed for $990 per year by Investment Consultants International, Ltd., P.O. Box 6644, Annapolis, MD 21401. (410) 224-8885. www.AdrianDayGlobalAnalyst.com. Publisher: Adrian Day. Owner: Investment Consultants International, Ltd. Staff may have positions in securities discussed herein. Adrian Day is also President of Global Strategic Management (GSM), a registered investment advisor, and a separate company from this service. In his capacity as GSM president, Adrian Day may be buying or selling for clients securities recommended herein concurrently, before or after recommendations herein, and may be acting for clients in a manner contrary to recommendations herein. This is not a solicitation for GSM. Views herein are the editor’s opinion and not fact. All information is believed to be correct, but its accuracy cannot be guaranteed. The owner and editor are not responsible for errors and omissions. © 2022. Adrian Day’s Global Analyst. Information and advice herein are intended purely for the subscriber’s own account. Under no circumstances may any part of a Global Analyst e-mail be copied or distributed without prior written permission of the editor. Given the nature of this service, we will pursue any violations aggressively.

Disclosures:

1) Adrian Day: I, or members of my immediate household or family, own securities of the following companies mentioned in this article: All. I personally am, or members of my immediate household or family are, paid by the following companies mentioned in this article: None. My company has a financial relationship with the following companies mentioned in this article: None. Funds controlled by Adrian Day Asset Management, which is unaffiliated with Adrian Day’s newsletter, hold shares of the following companies mentioned in this article: All. I determined which companies would be included in this article based on my research and understanding of the sector.

2) The following companies mentioned in this article are billboard sponsors of Streetwise Reports: None. Click here for important disclosures about sponsor fees. The information provided above is for informational purposes only and is not a recommendation to buy or sell any security.

3) Statements and opinions expressed are the opinions of the author and not of Streetwise Reports or its officers. The author is wholly responsible for the validity of the statements. The author was not paid by Streetwise Reports for this article. Streetwise Reports was not paid by the author to publish or syndicate this article. Streetwise Reports requires contributing authors to disclose any shareholdings in, or economic relationships with, companies that they write about. Streetwise Reports relies upon the authors to accurately provide this information and Streetwise Reports has no means of verifying its accuracy.

4) This article does not constitute investment advice. Each reader is encouraged to consult with his or her individual financial professional and any action a reader takes as a result of information presented here is his or her own responsibility. By opening this page, each reader accepts and agrees to Streetwise Reports’ terms of use and full legal disclaimer. This article is not a solicitation for investment. Streetwise Reports does not render general or specific investment advice and the information on Streetwise Reports should not be considered a recommendation to buy or sell any security. Streetwise Reports does not endorse or recommend the business, products, services, or securities of any company mentioned on Streetwise Reports.

5) From time to time, Streetwise Reports LLC and its directors, officers, employees, or members of their families, as well as persons interviewed for articles and interviews on the site, may have a long or short position in the securities mentioned. Directors, officers, employees, or members of their immediate families are prohibited from making purchases and/or sales of those securities in the open market or otherwise from the time of the decision to publish an article until three business days after the publication of the article. The foregoing prohibition does not apply to articles that in substance only restate previously published company release. As of the date of this article, officers and/or employees of Streetwise Reports LLC (including members of their household) own securities of First Majestic Silver Corp., a company mentioned in this article.

What’s program-related investment? A management scholar explains one way that foundations support charities without giving money away for good

By Jessica Jones, University of Tennessee 

Most U.S. foundations seek to preserve the money that funds their grants and operations for the long term. They accomplish this by not giving away more money than they earn as returns on the assets held in their endowments.

By law, foundations must give away or spend on their operations a total of at least 5% of what they hold in endowments every year. In practice, foundations spend more than that on their total grants and expenses – around 8% of their assets in 2018, for example.

One way that foundations can stretch their charitable dollars is by making program-related investments – a philanthropic form of lending. Instead of giving money away, those funds are typically repaid several years later. With this model, foundations can recycle some of their charitable funds by dispatching them again.

The investments may count toward that 5% payout minimum and must, in the IRS’ words, “significantly further the foundation’s exempt activities.”

That means a foundation’s program-related investments, like the money it gives away as grants, must support work that’s in keeping with its charitable goals. Foundations can accomplish this by supporting, for instance, affordable housing, backing cancer research efforts or supporting efforts that are a part of their IRS-authorized mission.

Foundations may also use program-related investments to financially back either nonprofits or for-profit social organizations, also known as social enterprises.

Below-market rates

By injecting funds into organizations that would perhaps otherwise be deemed too risky to attract investment, foundations may use some of their assets as a catalyst that can speed up innovation tied to a cause they support through their grants.

The foundations are free to charge any interest rate they see fit, but must be below-market on a risk-adjusted basis. This keeps the program-related investments focused on the charitable mission rather than the opportunity for gaining a high return on their investment.

Program-related investments are most appropriate for organizations that private investors are unlikely to back due to high risks or expectations of limited financial returns, such as small businesses in low-income neighborhoods.

While program-related investments are intended to be repaid and provide heightened accountability for allocating charitable dollars for both the foundation and its recipient, there are no formal penalties if the money is not repaid. This is because the alternative would have been in the form of a grant, where the money was given with no expectation of repayment in the first place.

Why program-related investments matter

Foundations and other large philanthropic institutions have long faced pressure to do more with their money to advance the causes they support.

As of late 2022, U.S. foundations held a total of more than US$1.1 trillion in their endowments and had relegated some of those assets to program-related investments.

Although this practice was established following passage of a comprehensive tax reform package in 1969, relatively few of the nation’s nearly 130,000 foundations have embraced it.

But many of the largest ones, such as the Rockefeller, MacArthur and Bill and Melinda Gates foundations, do regularly make program-related investments to advance their missions.The Conversation

About the Author:

Jessica Jones, Assistant Professor of Management & Entrepreneurship, University of Tennessee

This article is republished from The Conversation under a Creative Commons license. Read the original article.


JPY is growing. Overview for 20.12.2022

By RoboForex.com

The Japanese yen has grown quite a bit against the US dollar. The current quote is 132.60.

At today’s meeting, the BoJ decided to keep the interest rate without a change at -0.10% a year.

What came as a surprise was the announcement of an unlimited purchase of one to five-year bonds. The sum meant to spent on it from now on is 600 billion yen. On one to three-year bonds, three to five-year bonds, and ten to twenty-five year bonds, 100 billion Japanese yen will be spent, respectively. 300 billion yen more will be spent on five to ten-year bonds. Extra bond purchases are scheduled for 22 December.

The Bank plans to react to each bond issuing, to increase purchases, and expand volumes of operations with fixed-rate securities, when necessary. Moreover, the Bank of Japan will set a fixed rate for auctions with ten-year bonds.

For the yen, everything happening is interventions, either open or hidden.

A peculiar situation has formed: the BoJ decided against changing its ultra-soft policy but brought the debt sector out of balance totally, thus supporting the JPY.

Article By RoboForex.com

Attention!
Forecasts presented in this section only reflect the author’s private opinion and should not be considered as guidance for trading. RoboForex LP bears no responsibility for trading results based on trading recommendations described in these analytical reviews.

The Analytical Overview of the Main Currency Pairs on 2022.12.20

By JustMarkets

The EUR/USD currency pair

Technical indicators of the currency pair:
  • Prev Open: 1.0585
  • Prev Close: 1.0606
  • % chg. over the last day: +0.19

European Central Bank Vice President Luis de Guindos said on Monday that the ECB would continue to raise rates in the Eurozone to curb inflation and is not considering revising its own medium-term inflation target of 2%. Germany’s leading Ifo index rose to 88.6 in December from 86.4 in November. The index is now back to levels last seen in the summer. The outlook for Europe’s largest economy is improving despite the energy crisis.

Trading recommendations
  • Support levels: 1.0549, 1.0483, 1.0361, 1.0332, 1.0284, 1.0193
  • Resistance levels: 1.0641, 1.0695

The trend on the EUR/USD currency pair on the hourly time frame is bullish. The price is adjusting to the nearest support levels. The MACD indicator has become inactive, and the price is forming a narrow flat. Under such market conditions, buy trades are best considered from the support level of 1.0549 but with additional confirmation. Sell deals can be considered from the resistance level of 1.0641, but it is better with a confirmation in the form of a reverse initiative or false breakout because the level has already been tested.

Alternative scenario: if the price breaks down through the support level of 1.0446 and fixes below it, the downtrend will likely resume.

EUR/USD
News feed for 2022.12.20:
  • – US Building Permits (m/m) at 15:30 (GMT+2).

The GBP/USD currency pair

Technical indicators of the currency pair:
  • Prev Open: 1.2143
  • Prev Close: 1.2144
  • % chg. over the last day: +0.01 %

UK Chancellor Jeremy Hunt instructed the Office for Budget Responsibility (OBR) to “prepare an economic and fiscal outlook to be presented with the Spring Budget on March 15, 2023. There are no significant events on the economic calendar at the start of the week, so GBP/USD is likely to be dependent on the US dollar index until the UK GDP is released on Thursday. A hawkish Fed forecast is supposed to keep the bulls on the dollar index in play, increasing downward pressure on GBP/USD quotes.

Trading recommendations
  • Support levels: 1.2092, 1.2177, 1.2024, 1.1964, 1.1684, 1.1476, 1.1418
  • Resistance levels: 1.2218, 1.2308, 1.2431, 1.2519

From the technical point of view, the GBP/USD currency pair trend on the hourly time frame is bullish. But the price is trading below the moving averages and is approaching the priority change level. The MACD indicator is in the negative zone, but there are signs of divergence, which indicates some weakness of the sellers. Under such market conditions, it is better to look for buy trades from the support level of 1.2092 but with confirmation on the intraday time frames. Sell trades are best sought from the resistance level of 1.2218 but also better with confirmation.

Alternative scenario: if the price breaks down of the 1.2092 support level and fixes below it, the downtrend will likely resume.

GBP/USD
There is no news feed for today.

The USD/JPY currency pair

Technical indicators of the currency pair:
  • Prev Open: 135.85
  • Prev Close: 136.90
  • % chg. over the last day: +0.77 %

The Bank of Japan shocked the markets by doubling the 10-year bond yield cap, causing the yen to jump and government bonds to fall, which helped pave the way for a possible policy normalization. The Japanese yen strengthened sharply on the back of this news. Kyodo News reported that Japanese Prime Minister Fumio Kishida is considering a more flexible approach to the 2% inflation target. The Central Bank will likely abandon its soft monetary policy when a new governor of the Bank of Japan is appointed in April 2023. A stronger yen could bring some relief to the Japanese economy, which is struggling with high import costs caused by this year’s yen depreciation.

Trading recommendations
  • Support levels: 133.12, 131.54
  • Resistance levels: 134.73, 135.88, 137.03, 138.00, 139.09

From the technical point of view, the medium-term trend on the currency pair USD/JPY is bearish. The price has fallen sharply on the BoJ meeting. The MACD indicator is deeply negative, with no sign of reversal but with a sign of oversold. Buy trades are best considered on intraday time frames from the support level of 133.12, but only with confirmation. Sell deals can be looked for from the resistance level of 134.73, provided there is a reversal.

Alternative scenario: If the price fixes above 139.00, the uptrend will likely resume.

USD/JPY
News feed for 2022.12.20:
  • – Japan BoJ Interest Rate Decision at 05:00 (GMT+2);
  • – Japan BoJ Monetary Policy Statement at 05:00 (GMT+2);
  • – Japan BoJ Press Conference at 05:00 (GMT+2).

The USD/CAD currency pair

Technical indicators of the currency pair:
  • Prev Open: 1.3677
  • Prev Close: 1.3650
  • % chg. over the last day: -0.19 %

Oil prices rose on Monday as optimism over China’s easing COVID-19 restrictions outweighed fears of a global recession affecting energy demand. Oil also received support from the US Department of Energy, which said Friday it would begin buying crude oil for the Strategic Petroleum Reserve. A rise in oil prices is always accompanied by a fall in USD/CAD since the Canadian dollar is a commodity currency.

Trading recommendations
  • Support levels: 1.3601, 1.3521, 1.3438, 1.3386, 1.3360, 1.3281, 1.3212
  • Resistance levels: 1.3700, 1.3776, 1.3855

From the point of view of technical analysis, the trend on the USD/CAD currency pair has changed to bullish. The price is trading above the average lines, but the price has hit a strong resistance level at 1.3700. The MACD indicator has become inactive, but the divergence indicates that the buyers are limited in their potential. Buy trades should be considered only after a breakout and a fixation above 1.3700. Sell deals is better to look for on the intraday time frames from 1.3601, but with a confirmation in the form of a reverse initiative or after a false breakdown.

Alternative scenario: if the price breaks down and consolidates below the support level of 1.3386, the downtrend will likely resume.

USD/CAD
News feed for 2022.12.20:
  • – Canada Retail Sales (m/m) at 15:30 (GMT+2).

By JustMarkets


This article reflects a personal opinion and should not be interpreted as an investment advice, and/or offer, and/or a persistent request for carrying out financial transactions, and/or a guarantee, and/or a forecast of future events.

Stock indices continue to fall due to recession worries

By JustMarkets

The US stock market fell on Monday for the fourth straight session as investors fear that the Federal Reserve’s campaign to tighten monetary policy could push the US economy into recession. This sentiment is creating downward pressure on major indices. At the stock market’s close, Dow Jones (US30) decreased by 0.49%, while S&P 500 (US500) fell by 0.90%. The Technology Index NASDAQ (US100) was down by 1.49% on Monday. All three indices closed the day lower.

Stock markets in Europe mostly rose yesterday. German DAX (DE30) gained 0.36%, French CAC 40 (FR40) added 0.32%, Spanish IBEX 35 (ES35) increased by 0.30%, and British FTSE 100 (UK100) closed on Monday plus 0.40%.

Germany may avoid a recession this winter. The fiscal stimulus packages implemented by the government have prevented the economy from falling off a cliff. But at the same time, the cold winter of the last few days has shown how quickly the nation’s replenished gas reserves could disappear again. Today, many official forecasts suggest that the German economy will return to its average quarterly growth rate by mid-2023.

Oil prices rose Monday as optimism over China’s easing COVID-19 restrictions outweighed fears of a global recession affecting energy demand. Oil also received support from the US Department of Energy, which said Friday it would begin buying crude for the Strategic Petroleum Reserve.

European Union energy ministers on Monday agreed to limit gas prices as the EU aims to tackle the energy crisis. The restriction could be imposed starting February 15, 2023. Germany voted to support the deal despite expressing concerns about the policy’s impact on Europe’s ability to attract gas supplies. Ministers agreed to impose a cap if prices exceed 180 euros per megawatt hour for three days on the contract for the coming month with the Dutch gas transmission center (TTF), which serves as the European benchmark. The Intercontinental Exchange ICE, which trades the TTF on its exchange in Amsterdam, said last week that it might move TTF trading outside the EU if the bloc caps prices.

Asian markets were mostly down yesterday. Japan’s Nikkei 225 (JP225) decreased by 1.05%, China’s FTSE China A50 (CHA50) fell by 0.33%, Hong Kong’s Hang Seng (HK50) ended the day down by 0.50%, India’s NIFTY 50 (IND50) rose by 0.83%, and Australia’s S&P/ASX 200 (AU200) ended Monday in minus 0.18%.

The Bank of Japan shocked markets Tuesday by doubling the 10-year bond yield cap, causing the yen to spike and government bonds to fall, helping pave the way for a possible policy normalization. The Bank of Japan will now allow Japan’s 10-year bond yield to rise to about 0.5%, up from the previous limit of 0.25%. The Central Bank said the move would enhance the sustainability of its monetary easing, but many economists interpreted the move as laying a preliminary foundation for an exit from a decade of extraordinary stimulus policies.

In Australia, the minutes of the November monetary policy meeting showed that the Australian economy continues to grow steadily. However, economic growth is expected to slow next year. The council expects further interest rate increases in the coming period. The size and timing of future interest rate increases will continue to be determined by incoming data and the Board’s assessment of inflation and labor market prospects.

S&P 500 (F) (US500) 3,817.66 −34.70 (−0.90%)

Dow Jones (US30) 32,757.54 −162.92 (−0.49%)

DAX (DE40) 13,942.87 +49.80 (+0.36%)

FTSE 100 (UK100) 7,361.31 +29.19 (+0.40%)

USD Index 104.35 -0.45 (-0.43%)

Important events for today:
  • – Australia RBA Meeting Minutes (m/m) at 02:30 (GMT+2);
  • – China PBoC Loan Prime Rate at 03:15 (GMT+2);
  • – Japan BoJ Interest Rate Decision at 05:00 (GMT+2);
  • – Japan BoJ Monetary Policy Statement at 05:00 (GMT+2);
  • – Japan BoJ Press Conference at 05:00 (GMT+2);
  • – US Building Permits (m/m) at 15:30 (GMT+2);
  • – Canada Retail Sales (m/m) at 15:30 (GMT+2).

By JustMarkets


This article reflects a personal opinion and should not be interpreted as an investment advice, and/or offer, and/or a persistent request for carrying out financial transactions, and/or a guarantee, and/or a forecast of future events.

Did Jerome Powell Just Steal Christmas?

Source: Michael Ballanger  (12/19/22) 

 Expert Michael Ballanger looks at the S&P 500, the current state of gold and silver, and some resource companies, including Getchell Gold. Ballanger also touches on Powell’s anti-inflation campaign and tells you his 2023 outlook.

Last Tuesday afternoon, there was an attempted theft of untold magnitude and unimaginable loss; the chairman of the U.S. Federal Reserve Board attempted to make off with what was shaping up to be a powerful year-end rally, commonly referred to as “The Santa Claus Rally” (SCR).

S&P 500

Citing easing financial conditions as represented by the 17.5% rally of the October 13th lows in the S&P 500, the Fed jacked rates up by another 50 basis points to 4.4%. Still, it was the hawkish rhetoric spewed out during the 2:30 presser that aged like a toxic brew overnight, with the following three sessions shaving roughly 6% from the move.

As this is being written (Friday pre-opening), futures are called another 1% lower. Investors have been snapped to attention by a particularly Grinch-like central banker that would rather see a million lost jobs over a 7% inflation rate, especially when his “legacy before charity” is the seasonal policy of choice.

Wall Street cheerleaders are still calling for a face-ripping rally to 4,500 before the next real onslaught of selling but after the events of last Tuesday, their optimism is being put to a test of immense proportion.

What Mr. Powell surely realizes is the madness behind his intention to impersonate Paul Volcker, given that the size of the U.S. national debt is trillions greater in 2022 than in 1980 and that the cost of servicing that debt has grown commensurately.

With demographics clearly, worlds apart in 2022 from the impact of Babyboomers in the 1980s, if these Fed rate hikes continue to choke off growth (and jobs), the tax receipts normally collected due to increased employment and surging stock markets will quickly and fatally reverse exerting even greater pressure on debt serviceability and financial stability.

The outlook for financial conditions is, at best uncertain as we approach 2023, and markets abhor uncertainty the same way the Grinch abhorred Christmas . . .

From a technical perspective, the advance stopped right where it should have, punctuated by a downtrend line connecting peaks in late 2021, April, and August of 2022, and now the December peak at 4,100.

Wall Street cheerleaders are still calling for a face-ripping rally to 4,500 before the next real onslaught of selling but after the events of last Tuesday, their optimism is being put to a test of immense proportion.

I took profits on the UPRO:US position in two tranches, the first at a predetermined US$40 and then on a protective stop at US$38.95. I currently have a small call option position on the UPRO:US on the assumption that the Santa Claus Rally, scheduled to commence on Monday, will actually materialize as seasonality wins out over Fed jawboning.

Since the first half of December typically includes selling pressure brought about by year-end distributions from the funds, I expect to see diminished selling pressure next week with the possibility of a more pronounced uptick into New Year’s Day.

Gold and Silver

Gold for February delivery clawed its way back above US$1,800/ounce after getting bombed back to US$1,785 on Thursday. I am long a small trading position in the GLD January US$165 calls looking for US$175 by expiry, which translates into a test of the upper resistance band for February gold at US$1,875.

Silver is also acting well, coming off an overbought condition (RSI at 78.49) and a price peak at US$24.39 on Tuesday morning just prior to the FOMC shenanigans.

The gold mining stocks represented by the HUI have been in a downtrend since August 2020, peaking at around 373 and troughing out last summer at around 173 and currently residing at around 221. That is a big correction in any market, and to think that it has been inconsequential for the junior developers and explorers verges on the inane.

The VanEck Junior Gold Miner ETF (GDXJ:US) topped in August 2020 just shy of US$64.00 and today resides at US$35.18. The TSX Venture Exchange topped in August 2020 at a tad above 1,100 and today sits at 576.26.

Many of the high-flying juniors from the first half of the year with new, exciting discoveries have had their wings clipped, and no better example than MAX Resource Corp. (MAX:TSX.V; MXROF:OTCBB) whose Cesar project in Columbia drove its price to CA$0.90 before lethargy set in during the fourth quarter sending the stock to less than a third of that today.

Every gold bull has their personal and very private “penny dreadful” tucked away beside or beneath their physical gold and silver and Newmont and Barrick positions if for no other reason than to sprinkle some comic relief on the task of managing their precious metals portfolios.

I, too, have the bulk of my holdings in physical gold and silver held on my property (right next to my 30-odd-six and 357 Magnum), but I have an equal number of “dreadfuls” where the leverage to a rising gold price is immense (as long as you pick the right ones).

Alas, here is where the opportunity-cost “rubber” meets the risk-management “road” and where “glass-half-full” optimists like me get into trouble. The more I keep chirping about “market cap per ounce,” the more the eyes of the Millennial and Gen-X portfolio managers glaze over.

Valuation is irrelevant in a world governed by pattern-recognition technology, and if they buy shares in a junior and news is released that should carry it higher but doesn’t, “to hell with the Babyboomer metric that says Nevada in-ground ounces should be booked at US$75 or US$100 per ounce; it trades at US$18.42 per ounce and looks lower . . . ” and down she goes.

I went through a similar exercise in late 2015 with gold at the US$1,050 level and sentiment scraping the basement and as I was telling the world that gold was officially “on-sale,” most investment firm “analysts” were reciting the bullion bank party line chapter-and-verse and trying to engineer a sub-US$1,000 gold price in the same manner in which the kiddies over at TD Bank recently opened up a “tactical short” on silver in the US$18-plus range only to get stopped out for a 14% “tactical loss” on the trade.

What we really want to know is the number of TD hedge book clients that covered short silver positions into sell-side volume created by that very public display of bearishness. The same thing happened in 2015 as every bank in existence was negative on gold until mid-December when the COT report showed that the Commercial traders (bullion banks) had actually gone net long gold futures for the first time in decades after being net short for the better part of the 21st Century.

You have all read my plagiarism of my newsletter hero, Richard Russell (“Dow Theory Letters”), over the years but the one thing he left me with as he departed this world in 2015 was “Follow the Money.”

You have all read my plagiarism of my newsletter hero, Richard Russell (“Dow Theory Letters”), over the years but the one thing he left me with as he departed this world in 2015 was “Follow the Money.”

Back in the day, the bucket shops that pumped juniors had their “trading desks” backed by partners’ capital that would make sure that their underwritings would go out “oversubscribed,” and how they did that was make sure that the issue was “premium bid” as the deal was being marketed to clients. It was “standard operating procedure” for Foo-Foo Mines Inc. to be a US$0.50 bid as their US$0.40 private placement was being pitched to customers and that was all thanks to “the desk.”

In today’s world, such obvious stock price manipulation would never be tolerated, but I can tell you that a lot of exploration funding was successfully closed back then thanks to the efforts of “the desk.” You see, rules designed by the “WOKE” generation may have virtue at heart but most of the time, it is simply make-work programs for rules-based, anal-retentive Millennials that need justification for their own private versions of corporate correctness.

The plight of junior gold developers is one that grates on my nerves and that is entirely understandable because the biggest passes I have had in my nigh-on seven decades on the planet have come at the helm of resource discoveries. Having lost millions of dollars due to blind optimism and misplaced loyalties, I have made an even greater amount than that due to the blessings of Mother Nature and Lady Luck, the two Devine Deities of the World of Mineral Exploration.

Getchell Gold Corp.

To wit, knowing the extreme difficulties in identifying a sound project worthy of my speculative dollars, I do not tread lightly in the catacombs of due diligence, nor do I take anything for granted. No better example of that resides in my undying faith in Getchell Gold Corp. (GTCH:CSE; GGLDF:OTCQB), whose Maiden Resource Estimate was announced Friday with a global resource of 2,059,900 ounces of gold located in arguably the best mining jurisdiction in the world.

Having invested my first centablo in 2017, Getchell’s Fondaway Canyon Property has metamorphosed into a beast of a project due in no small degree to the intuitive work of geologist and President Mike Sieb and Vice-President of Exploration Scott Frostad.

Prior to the acquisition of Fondaway Canyon by Getchell in 2019, it was seen as a “marginal project” with low-grade ore at depths prohibitive to open-pit mining and grades prohibitive to underground mining.

That narrative was exacerbated and enforced by the vendors (Canarc Resource Corp. (CCM:TSX; CRCUF:OTC) et al.) and considered the “insider’s view” by many of the newsletter writers that love to pick scabs from projects outside of their personal portfolios which explains the lack of coverage by the newsletters which affects the investment bankers because their institutional clients need to know that retail interest will provide them with adequate liquidity when they elect to sell the shares and ride the warrants usually attached to these until financings.

That was a convenient excuse to blow off inquiries into Getchell and the Fondaway asset but once Sieb and Frosted began to chip away at that flawed narrative through skillful interpretation of the myriad of data that had to be digitized (during the pandemic shutdown in 2020), the resultant drill results began to arrive with impressive widths and grades that blew away any need for the word “marginal” in referring to Fondaway.

Intercepts such as 25 meters of 10.4 g/t Au in brand new zones such as North Fork and Colorado SW started to seriously redefine the Fondaway asset. As this is being written, they are now 43101-compliant on their first Maiden Resource Estimate, which incorporates all data not included in the 2017 43101 report and doubles the resource while at the same time awaiting the results of five holes drilled after the cut-off point for the engineers’ assessment of the data.

With Fondaway now open along strike and to depth, I see this eventually morphing into a “Tier One Asset” (5 million ounces or greater), and if I am correct in my forecast of US$2,250/ounce gold in the first half of 2023, valuation per ounce could be quite easily pegged in the US$200-300 per ounce levels for in-ground ounces in favorable jurisdictions such as Nevada.

In case you are wondering if I have a “hidden agenda” in devoting so much of this week’s missive on one junior name, the answer is “Yes, I do,” but once divulged, it moves from “hidden” to “admitted” (something Kevin O’Leary might wish to practice). My “agenda” is two-fold: a) to introduce this undervalued asset to some prospective new investors and b) to attract new subscribers to my service.

As to disclosure, I also own a ton of shares, so coupled with the other reasons given, call it a “shameless book pump” if you wish, but it does not alter the opportunity that I believe resides in this name.

Powell’s Anti-Inflation Campaign

Next week is the last week before Christmas, and as it usually takes me a solid two weeks to finalize the GGMA 2023 Forecast Issue, there will be no more missives until the end of the first week of January. This is going to be a very daunting exercise in attempting to lay out a course of investment actions to be taken in 2023.

It was a veritable “walk in the park” last year because we were coming out of two years of monetary and fiscal madness and long overdue for a comeuppance of sorts, which we got in spades and continue to get as the inflation monster dominates central bank policies around the globe.

I leave you all today with the notion that if there is one glaring difference between the anti-inflation campaign of Paul Volcker in 1980-82 and the one being orchestrated by Jay Powell, it lies in the differences in the sizes of the national debt.

My suspicion is that 2023 will be a better year — how could it be any worse? — and that a resurgence in global demand will create sharp price movements in the electrification metals such as copper, lead, cobalt, and nickel while sovereign debt worries keep the precious metals “bid” well into the decade.

I leave you all today with the notion that if there is one glaring difference between the anti-inflation campaign of Paul Volcker in 1980-82 and the one being orchestrated by Jay Powell, it lies in the differences in the sizes of the national debt. In 1980, the Federal debt in the U.S. was around US$900 billion, with the U.S. the world’s largest creditor nation, while in 2022, the national debt is US$31.28 trillion, with the U.S. the world’s largest debtor nation.

Since the U.S. military is a policeman to the Western World, you cannot send the nation with the global reserve currency into fits of insolvency with escalating debt service costs crippling the economy and, with it, the war machine.

There was a superb exchange back in the election campaign of 1988 during the vice-presidential debate when Senator Lloyd Bentsen took exception to Dan Quayle’s attempt to frame himself as being “more experienced than Jack Kennedy” by saying, “Senator, I served with Jack Kennedy; I knew Jack Kennedy; Jack Kennedy was a friend of mine. YOU, Sir, are NO JACK KENNEDY.” Well, here in 2022, soon-to-be 2023, I would say to Jerome Powell: “I survived the Volcker Recession of 1981-1982 with interest rates at 16.5%. YOU, SIR, are NO PAUL VOLCKER.”

With debt levels off the charts, it is either grow or die. Powell knows this all too well . . .


Michael Ballanger Disclaimer:

This letter makes no guarantee or warranty on the accuracy or completeness of the data provided. Nothing contained herein is intended or shall be deemed to be investment advice, implied or otherwise. This letter represents my views and replicates trades that I am making but nothing more than that. Always consult your registered advisor to assist you with your investments. I accept no liability for any loss arising from the use of the data contained on this letter. Options and junior mining stocks contain a high level of risk that may result in the loss of part or all invested capital and therefore are suitable for experienced and professional investors and traders only. One should be familiar with the risks involved in junior mining and options trading and we recommend consulting a financial adviser if you feel you do not understand the risks involved.

Disclosures:

1) Michael J. Ballanger: I, or members of my immediate household or family, own securities of the following companies mentioned in this article: All. I personally am, or members of my immediate household or family are, paid by the following companies mentioned in this article: My company, Bonaventure Explorations Ltd., has a consulting relationship with: None.

2) The following companies mentioned in this article are billboard sponsors of Streetwise Reports: None. Click here for important disclosures about sponsor fees. As of the date of this article, an affiliate of Streetwise Reports has a consulting relationship with Western Uranium & Vanadium Corp. Please click here for more information.

3) Statements and opinions expressed are the opinions of the author and not of Streetwise Reports or its officers. The author is wholly responsible for the validity of the statements. The author was not paid by Streetwise Reports for this article. Streetwise Reports was not paid by the author to publish or syndicate this article. Streetwise Reports requires contributing authors to disclose any shareholdings in, or economic relationships with, companies that they write about. Streetwise Reports relies upon the authors to accurately provide this information and Streetwise Reports has no means of verifying its accuracy.

4) This article does not constitute investment advice. Each reader is encouraged to consult with his or her individual financial professional and any action a reader takes as a result of information presented here is his or her own responsibility. By opening this page, each reader accepts and agrees to Streetwise Reports’ terms of use and full legal disclaimer. This article is not a solicitation for investment. Streetwise Reports does not render general or specific investment advice and the information on Streetwise Reports should not be considered a recommendation to buy or sell any security. Streetwise Reports does not endorse or recommend the business, products, services or securities of any company mentioned on Streetwise Reports.

5) From time to time, Streetwise Reports LLC and its directors, officers, employees or members of their families, as well as persons interviewed for articles and interviews on the site, may have a long or short position in securities mentioned. Directors, officers, employees or members of their immediate families are prohibited from making purchases and/or sales of those securities in the open market or otherwise from the time of the decision to publish an article until three business days after the publication of the article. The foregoing prohibition does not apply to articles that in substance only restate previously published company releases.

As of the date of this article, officers and/or employees of Streetwise Reports LLC (including members of their household) own securities of Getchell Gold Corp., a company mentioned in this article.

Why is the Japanese Yen soaring?

By ForexTime

In our latest Week Ahead article (posted on Fridays), we posed the question:

“Can USDJPY break below its 200-day SMA?”

We now have the answer: Yes!


But not only did this FX pair go beyond that widely-watched technical indicator, it smashed right past!

At the time of writing, the Japanese Yen skyrocketed by nearly 4% against the US dollar, even briefly dipping just below the psychological 132.0 mark, before slightly paring its gains versus the greenback at the time of writing.


Consider also how the FXTM JPY index, which measures the Yen’s performance against six of its G10 peers, has also skyrocketed to a 4-month high!


These big JPY moves are in response to a totally unexpected move by the Bank of Japan today!


How did the Bank of Japan shock markets?

Coming into its final policy meeting of 2022, the BoJ was widely expected to keep its policy settings untouched.

To be fair, Japan’s central bank did keep its policy bank rate at -0.10% and its 10-year yield target was also left at zero percent …

except …

Shocker: the BoJ doubled the limit / cap on yields for Japanese 10-year government bonds now up to 0.50%.


Why does this matter? How could higher Japanese yields impact markets?

  1. Higher Japanese yields, stronger Japanese Yen

Recall that, as an oversimplification, rising yields tend to be accompanied by currency strength.

Hence, with the BOJ allowing 10-year yields to rise, this BoJ move was met with a surge in the Japanese Yen.

After all, suppressed Japanese yields have been one of the main reasons why the Yen has struggled in 2022 and is still (barely) the worst-performing G10 currency against the US dollar so far this year.

Though that title (worst G10 performer) could be handed over to the Swedish Krona (SEK) soon, if the Japanese Yen can keep extending today’s advance into the final trading day of 2022.

READ MORE: (21 April 2022) Why is the Yen so weak?


  1. Selloff in global stocks / bonds?

Japan is the world’s biggest creditor (which means that the world owes Japan a lot of money).

According to the IMF, as of September 2021, Japanese investors held about US$3.4 trillion worth of assets overseas.

That’s enough money to buy up all of Apple, Alphabet, and Nike (using today’s much-lowered valuations)!

Hence, in light of today’s decision by the BoJ, onshore investors could be tempted to bring some of that money back home to take advantage of those raised yields in Japan.

The repatriation of such funds (presumably to take advantage of higher Japanese yields) may translate into further selling of such foreign assets (e.g. US stocks and bonds).


Is the BoJ ready to pivot?

BoJ Governor Haruhiko Kuroda went to great lengths today to insist that today’s policy tweak should not be seen as the equivalent of a rate hike.

NOTE: Bond yields tend to move higher when interest rates go up.

Yet, markets are interpreting today’s move as a sign that the BoJ is ready to “normalise” its policy settings.

After all, central bankers around the world have been furiously hiking rates this year, while the BoJ keeps theirs at minus 0.1%.


Here’s one last reference (I promise) to last Friday’s Week Ahead article, which carried this line:

… the mere hint that the BOJ is finally ready to hop onto this global policy tightening bandwagon could jolt the Japanese Yen.

And sure enough, that’s exactly what happened today.

Instead of the forecasts as of yesterday for two BOJ rate hikes by September 2023, markets have now priced in 3 rate hikes by then (Q3 3023).

Can the Yen climb even higher?

Overall, if markets build on this idea (or if the BoJ fails to quash such a notion) that today’s move is truly a precursor to the BoJ’s eventual exit out of negative interest rates …

that should pave the way for USDJPY to trade in sub-130 region in the months ahead.

In light of today’s BoJ shocker, markets have almost doubled the odds of USDJPY trading below 130.0 in Q1 2023, from 23% yesterday, now up to 44%.


Forex-Time-LogoArticle by ForexTime

ForexTime Ltd (FXTM) is an award winning international online forex broker regulated by CySEC 185/12 www.forextime.com