By JustMarkets
The US indices traded yesterday without a single trend. At yesterday’s stock market close, Dow Jones (US30) decreased by 1.14%, and S&P 500 (US500) lost 0.20%. The NASDAQ Technology Index (US100) gained 0.14% on Tuesday.
The Empire State Manufacturing Index, which measures activity in New York State, fell to 32.9 in January, the worst reading since the pandemic.
Goldman Sachs (GS) financial performance fell short of expectations. The company’s price fell more than 6% on the report. The report showed weakness in consumer banking and a 48% drop in investment banking revenue. On the other hand, Morgan Stanley’s (MS) stock was up more than 6% on the report. Record revenues in the asset management business offset weakness in investment banking.
Investors are waiting for Netflix’s quarterly results to be released Thursday. Analysts at UBS said they expect the streaming giant’s subscriber count to rise in the fourth quarter amid “strong content and seasonality.” Netflix is expected to add about 4.5 million subscribers in the fourth quarter, up from 2.4 million in the previous quarter.
Tesla (TSLA) shares jumped by 6% after Deutsche Bank issued its recommendation to buy the company on expectations that recent price declines are likely to support sales growth.
According to Harvard University professor Kenneth Rogoff, sustained inflation above the 2% target will force Federal Reserve policymakers to keep interest rates higher for longer. Eventually, inflation will fall, but interest rates will not fall to the level they were before.
The Ukrainian government has hired BlackRock Inc. to help set up the country’s reconstruction fund.
According to a survey released at the annual World Economic Forum in Davos, two-thirds of private and public sector economists surveyed expect a global recession this year. Meanwhile, German Chancellor Olaf Scholz said Europe’s largest economy would avoid a recession this year thanks to efforts to limit the impact of the region’s energy crisis on the economy. Bob Prince, chief investment officer at Bridgewater Associates, said the economic cycle has returned and that more people will have to lose their jobs before inflation is brought under control. According to the chief economist of the European Bank for Reconstruction and Development, it will take years for sanctions against Russia to force Vladimir Putin to back down because oil and gas revenues outweigh sanctions losses many times over. Hopes that US and European sanctions will change the balance of power in the near future are an unrealistic scenario.
Equity markets in Europe mostly rose yesterday. German DAX (DE30) gained 0.35%, French CAC 40 (FR40) jumped by 0.48%, Spanish IBEX 35 (ES35) added +0.15%, and British FTSE 100 (UK100) closed yesterday down by 0.12%.
Germany’s inflation rate fell sharply from 10% to 8.6% year-on-year. The inflation rate slowed in December 2022, mainly due to lower energy prices. But despite the decline in inflation rates across Europe, according to Philip Lane, chief economist at the ECB, the central bank should continue to aggressively raise rates to levels that will begin to limit growth.
The British FTSE 100 index is close to an all-time high. Yesterday’s labor market data showed that the UK unemployment rate remained at 3.7%, but average earnings rose to 6.4% from 6.1% the previous month, the highest rate of growth. Wage growth is a major concern for the Bank of England, as there is a risk of a wage-price spiral that will eventually lead to higher inflationary expectations. UK inflation data will be released today, where consumer prices are expected to fall for the first time in 12 months.
Reuters predicts that gold prices will return to their all-time highs above the psychologically critical $2,000 level this year unless, of course, there is a major change in the US inflation picture. The highest gold price ever in US dollars is $2077.88. This peak was reached on August 7, 2020.
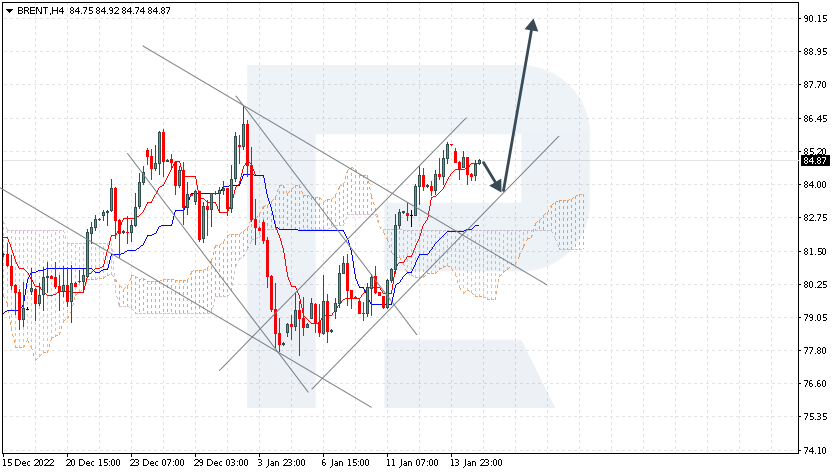
Oil prices continue to rise amid hopes for a rebound in Chinese demand, even despite weak economic data. The Organization of the Petroleum Exporting Countries (OPEC) reported in its monthly report that oil demand in China will increase by 510,000 BPD this year. The rise in oil was also supported by a weaker US dollar, which fell against most major currencies on Tuesday. A weaker dollar makes oil less expensive for other currency holders.
Asian markets traded flat yesterday. Japan’s Nikkei 225 (JP225) added 1.23% on Tuesday, China’s FTSE China A50 (CHA50) decreased by 0.47%, Hong Kong’s Hang Seng (HK50) ended the day down by 0.78%, India’s NIFTY 50 (IND50) added 0.89%, and Australia’s S&P/ASX 200 (AU200) ended the day up by 0.03%.
The Bank of Japan left all policy settings unchanged at its meeting. This includes the discount rate (maintained at -0.1%) and the 10-year bond yield target of about 0%. Policymakers also mentioned that they would continue to buy bonds with a degree of flexibility. This underscores the central bank’s intention to continue to control the yield curve as planned. This disappointed investors who had hoped for the first steps of monetary policy normalization.
S&P 500 (F) (US500) 3,990.97 −8.12 (−0.20%)
Dow Jones (US30) 33,910.85 −391.76 (−1.14%)
DAX (DE40) 15,187.07 +53.03 (+0.35%)
FTSE 100 (UK100) 7,851.03 −9.04 (−0.12%)
USD Index 102.40 +0.20 (+0.19%)
- – Japan BoJ Interest Rate Decision at 05:00 (GMT+2);
- – Japan BoJ Monetary Policy Statement at 05:00 (GMT+2);
- – Japan BoJ Outlook Report at 05:00 (GMT+2);
- – Japan Industrial Production (m/m) at 06:30 (GMT+2);
- – Japan BoJ Press Conference (Tentative);
- – UK Consumer Price Index (m/m) at 09:00 (GMT+2);
- – World Economic Forum Annual Meetings at 10:00 (GMT+2);
- – Eurozone Consumer Price Index (m/m) at 12:00 (GMT+2);
- – US Retail Sales (m/m) at 15:30 (GMT+2);
- – US Producer Price Index (m/m) at 15:30 (GMT+2);
- – US Industrial Production (m/m) at 16:15 (GMT+2);
- – US FOMC Member Harker Speaks at 21:00 (GMT+2).
By JustMarkets
This article reflects a personal opinion and should not be interpreted as an investment advice, and/or offer, and/or a persistent request for carrying out financial transactions, and/or a guarantee, and/or a forecast of future events.