Metals Speculators raise Platinum bullish bets to 20-week high

By InvestMacro

Here are the latest charts and statistics for the Commitment of Traders (COT) data published by the Commodities Futures Trading Commission (CFTC).

The latest COT data is updated through Tuesday April 25th and shows a quick view of how large traders (for-profit speculators and commercial entities) were positioned in the futures markets.

Weekly Speculator Changes led by Platinum & Silver

The COT metals markets speculator bets were lower this week as two out of the six metals markets we cover had higher positioning while the other four markets had lower speculator contracts.

Leading the gains for the metals was Platinum (5,298 contracts) with Silver (4,008 contracts) also showing a positive week.

The markets with declines in speculator bets for the week were Copper (-25,976 contracts), Gold (-4,629 contracts), Steel (-785 contracts) and Palladium (-240 contracts) seeing lower bets on the week.

Speculators increase Platinum bullish bets to 20-week high

Highlighting the COT metals data this week is the rise in bullish bets for the Platinum speculative positions. The large speculator position in Platinum futures rose by over +5,000 contracts this week and are higher for the fourth time in the past five weeks as well as higher in six out of the past nine weeks.

A total of +20,091 contracts have been added to the net speculator position over the past five-week period, bringing the current standing to the most bullish level in twenty weeks, dating back to January 10th. Overall, the Platinum positioning has now been in bullish territory for thirty-two straight weeks.

The Platinum futures price recently hit its highest level in over a year with a high of $1102.00 on April 23rd. This marked the best level since March 9th of 2022 when prices reached all the way to $1197.00.

This week, however, Platinum gave back some of its gains and prices fell for the first time in the past five weeks and closed at the $1090.10 threshold. Despite this week’s decline, Platinum overall has risen by over twenty percent since it’s most recent low of $904 in February.


Data Snapshot of Commodity Market Traders | Columns Legend
Apr-25-2023OIOI-IndexSpec-NetSpec-IndexCom-NetCOM-IndexSmalls-NetSmalls-Index
Gold473,20924185,26459-211,9284226,66447
Silver149,6923730,60362-41,5234410,92027
Copper202,42244-17,042138,304808,73874
Palladium12,27088-5,877116,30990-43216
Platinum72,1257929,61784-34,316234,69931


Strength Scores led by Platinum & Silver

COT Strength Scores (a normalized measure of Speculator positions over a 3-Year range, from 0 to 100 where above 80 is Extreme-Bullish and below 20 is Extreme-Bearish) showed that Platinum (84 percent) and Silver (62 percent) lead the metals markets this week.

On the downside, Palladium (11 percent) and Copper (13 percent) come in at the lowest strength level currently and are in Extreme-Bearish territory (below 20 percent).

Strength Statistics:
Gold (58.6 percent) vs Gold previous week (60.6 percent)
Silver (61.9 percent) vs Silver previous week (56.2 percent)
Copper (13.2 percent) vs Copper previous week (36.4 percent)
Platinum (83.9 percent) vs Platinum previous week (71.7 percent)
Palladium (11.3 percent) vs Palladium previous week (13.5 percent)
Steel (57.0 percent) vs Palladium previous week (59.3 percent)


Silver & Platinum top the 6-Week Strength Trends

COT Strength Score Trends (or move index, calculates the 6-week changes in strength scores) showed that Silver (45 percent) and Platinum (44 percent) lead the past six weeks trends for metals.

Copper (-3 percent) leads the downside trend scores currently with Steel (-2 percent) as the next market with lower trend scores.

Move Statistics:
Gold (19.8 percent) vs Gold previous week (40.2 percent)
Silver (45.4 percent) vs Silver previous week (49.1 percent)
Copper (-2.6 percent) vs Copper previous week (14.9 percent)
Platinum (44.0 percent) vs Platinum previous week (44.3 percent)
Palladium (5.5 percent) vs Palladium previous week (13.5 percent)
Steel (-2.2 percent) vs Steel previous week (-1.2 percent)


Individual Markets:

Gold Comex Futures:

Gold Futures COT ChartThe Gold Comex Futures large speculator standing this week equaled a net position of 185,264 contracts in the data reported through Tuesday. This was a weekly fall of -4,629 contracts from the previous week which had a total of 189,893 net contracts.

This week’s current strength score (the trader positioning range over the past three years, measured from 0 to 100) shows the speculators are currently Bullish with a score of 58.6 percent. The commercials are Bearish with a score of 42.1 percent and the small traders (not shown in chart) are Bearish with a score of 46.8 percent.

Gold Futures StatisticsSPECULATORSCOMMERCIALSSMALL TRADERS
– Percent of Open Interest Longs:53.526.310.8
– Percent of Open Interest Shorts:14.471.15.2
– Net Position:185,264-211,92826,664
– Gross Longs:253,186124,51851,048
– Gross Shorts:67,922336,44624,384
– Long to Short Ratio:3.7 to 10.4 to 12.1 to 1
NET POSITION TREND:
– Strength Index Score (3 Year Range Pct):58.642.146.8
– Strength Index Reading (3 Year Range):BullishBearishBearish
NET POSITION MOVEMENT INDEX:
– 6-Week Change in Strength Index:19.8-21.829.0


Silver Comex Futures:

Silver Futures COT ChartThe Silver Comex Futures large speculator standing this week equaled a net position of 30,603 contracts in the data reported through Tuesday. This was a weekly lift of 4,008 contracts from the previous week which had a total of 26,595 net contracts.

This week’s current strength score (the trader positioning range over the past three years, measured from 0 to 100) shows the speculators are currently Bullish with a score of 61.9 percent. The commercials are Bearish with a score of 43.6 percent and the small traders (not shown in chart) are Bearish with a score of 27.0 percent.

Silver Futures StatisticsSPECULATORSCOMMERCIALSSMALL TRADERS
– Percent of Open Interest Longs:44.230.716.2
– Percent of Open Interest Shorts:23.758.48.9
– Net Position:30,603-41,52310,920
– Gross Longs:66,14545,90724,230
– Gross Shorts:35,54287,43013,310
– Long to Short Ratio:1.9 to 10.5 to 11.8 to 1
NET POSITION TREND:
– Strength Index Score (3 Year Range Pct):61.943.627.0
– Strength Index Reading (3 Year Range):BullishBearishBearish
NET POSITION MOVEMENT INDEX:
– 6-Week Change in Strength Index:45.4-39.12.6


Copper Grade #1 Futures:

Copper Futures COT ChartThe Copper Grade #1 Futures large speculator standing this week equaled a net position of -17,042 contracts in the data reported through Tuesday. This was a weekly fall of -25,976 contracts from the previous week which had a total of 8,934 net contracts.

This week’s current strength score (the trader positioning range over the past three years, measured from 0 to 100) shows the speculators are currently Bearish-Extreme with a score of 13.2 percent. The commercials are Bullish-Extreme with a score of 80.5 percent and the small traders (not shown in chart) are Bullish with a score of 73.6 percent.

Copper Futures StatisticsSPECULATORSCOMMERCIALSSMALL TRADERS
– Percent of Open Interest Longs:28.345.610.4
– Percent of Open Interest Shorts:36.741.56.1
– Net Position:-17,0428,3048,738
– Gross Longs:57,22492,29421,052
– Gross Shorts:74,26683,99012,314
– Long to Short Ratio:0.8 to 11.1 to 11.7 to 1
NET POSITION TREND:
– Strength Index Score (3 Year Range Pct):13.280.573.6
– Strength Index Reading (3 Year Range):Bearish-ExtremeBullish-ExtremeBullish
NET POSITION MOVEMENT INDEX:
– 6-Week Change in Strength Index:-2.61.010.7


Platinum Futures:

Platinum Futures COT ChartThe Platinum Futures large speculator standing this week equaled a net position of 29,617 contracts in the data reported through Tuesday. This was a weekly increase of 5,298 contracts from the previous week which had a total of 24,319 net contracts.

This week’s current strength score (the trader positioning range over the past three years, measured from 0 to 100) shows the speculators are currently Bullish-Extreme with a score of 83.9 percent. The commercials are Bearish with a score of 22.5 percent and the small traders (not shown in chart) are Bearish with a score of 31.1 percent.

Platinum Futures StatisticsSPECULATORSCOMMERCIALSSMALL TRADERS
– Percent of Open Interest Longs:57.225.410.5
– Percent of Open Interest Shorts:16.173.04.0
– Net Position:29,617-34,3164,699
– Gross Longs:41,24018,3027,597
– Gross Shorts:11,62352,6182,898
– Long to Short Ratio:3.5 to 10.3 to 12.6 to 1
NET POSITION TREND:
– Strength Index Score (3 Year Range Pct):83.922.531.1
– Strength Index Reading (3 Year Range):Bullish-ExtremeBearishBearish
NET POSITION MOVEMENT INDEX:
– 6-Week Change in Strength Index:44.0-41.312.6


Palladium Futures:

Palladium Futures COT ChartThe Palladium Futures large speculator standing this week equaled a net position of -5,877 contracts in the data reported through Tuesday. This was a weekly decline of -240 contracts from the previous week which had a total of -5,637 net contracts.

This week’s current strength score (the trader positioning range over the past three years, measured from 0 to 100) shows the speculators are currently Bearish-Extreme with a score of 11.3 percent. The commercials are Bullish-Extreme with a score of 90.1 percent and the small traders (not shown in chart) are Bearish-Extreme with a score of 15.7 percent.

Palladium Futures StatisticsSPECULATORSCOMMERCIALSSMALL TRADERS
– Percent of Open Interest Longs:11.668.19.4
– Percent of Open Interest Shorts:59.516.712.9
– Net Position:-5,8776,309-432
– Gross Longs:1,4288,3611,152
– Gross Shorts:7,3052,0521,584
– Long to Short Ratio:0.2 to 14.1 to 10.7 to 1
NET POSITION TREND:
– Strength Index Score (3 Year Range Pct):11.390.115.7
– Strength Index Reading (3 Year Range):Bearish-ExtremeBullish-ExtremeBearish-Extreme
NET POSITION MOVEMENT INDEX:
– 6-Week Change in Strength Index:5.5-5.75.3


Steel Futures Futures:

Steel Futures COT ChartThe Steel Futures large speculator standing this week equaled a net position of -5,564 contracts in the data reported through Tuesday. This was a weekly lowering of -785 contracts from the previous week which had a total of -4,779 net contracts.

This week’s current strength score (the trader positioning range over the past three years, measured from 0 to 100) shows the speculators are currently Bullish with a score of 57.0 percent. The commercials are Bearish with a score of 43.0 percent and the small traders (not shown in chart) are Bearish with a score of 27.8 percent.

Steel Futures StatisticsSPECULATORSCOMMERCIALSSMALL TRADERS
– Percent of Open Interest Longs:11.977.90.8
– Percent of Open Interest Shorts:30.459.70.6
– Net Position:-5,5645,49965
– Gross Longs:3,59523,482244
– Gross Shorts:9,15917,983179
– Long to Short Ratio:0.4 to 11.3 to 11.4 to 1
NET POSITION TREND:
– Strength Index Score (3 Year Range Pct):57.043.027.8
– Strength Index Reading (3 Year Range):BullishBearishBearish
NET POSITION MOVEMENT INDEX:
– 6-Week Change in Strength Index:-2.23.5-58.1


Article By InvestMacroReceive our weekly COT Newsletter

*COT Report: The COT data, released weekly to the public each Friday, is updated through the most recent Tuesday (data is 3 days old) and shows a quick view of how large speculators or non-commercials (for-profit traders) were positioned in the futures markets.

The CFTC categorizes trader positions according to commercial hedgers (traders who use futures contracts for hedging as part of the business), non-commercials (large traders who speculate to realize trading profits) and nonreportable traders (usually small traders/speculators) as well as their open interest (contracts open in the market at time of reporting). See CFTC criteria here.

Bonds Speculators push their 5-Year Bond bets to most bearish on record

By InvestMacro

Here are the latest charts and statistics for the Commitment of Traders (COT) reports data published by the Commodities Futures Trading Commission (CFTC).

The latest COT data is updated through Tuesday April 25th and shows a quick view of how large traders (for-profit speculators and commercial hedgers) were positioned in the futures markets.

Weekly Speculator Changes led by Fed Funds & 2-Year Bonds

The COT bond market speculator bets were higher this week as six out of the nine bond markets we cover had higher positioning while the other three markets had lower speculator contracts.

Leading the gains for the bond markets was the 2-Year Bonds (28,607 contracts) with the Fed Funds (28,111 contracts), the US Treasury Bonds (19,560 contracts), the Ultra 10-Year Bonds (15,667 contracts), the Eurodollar (8,395 contracts) and the Ultra Treasury Bonds (1,016 contracts) also showing positive weeks.

The bond markets with declines in speculator bets for the week were the 5-Year Bonds (-114,786 contracts), the SOFR 3-Months (-89,967 contracts) and the 10-Year Bonds (-60,180 contracts) seeing lower bets on the week.

Speculators push their 5-Year Bond bets to most bearish on record

Highlighting the COT bond’s data this week is the historic weakness in the 5-Year Bonds speculator net contracts. Large speculative 5-Year Bond positions dropped sharply this week by over -114,000 net contracts, marking the largest decline in 20 weeks and have now decreased in four out of the past six weeks. The 5-Year net positions have fallen by a total of -312,076 contracts over the past six-week period, going from a total of -557,212 contracts on March 14th to a total net position of -869,288 contracts this week.

This bearishness has pushed the net position to the most bearish level in history, according to CFTC data that goes back to 1988. The previous record bearish position was a total of -867,556 contracts that took place on August 7th of 2018 and coincided with an almost exact bottom in the 5-Year Bond futures price (see image below comparing the price on dates of record bearish levels).

The 5-Year Bond futures price has not followed along lately with the extreme bearishness of the speculators in this case and has potentially already bottomed with a low of 105.14 in October and a more recent dip to 106.02 in March. The 5-Year futures closed this week higher near the 109.24 level and about 3.25 percent higher than the most recent low in March. In terms of bond yields, the 5-Year yield is currently trading at the 3.48 percent level and also down from a recent high of 4.37 percent in March. Only time will tell if the 5-Year Bond price has bottomed (and yields have topped out) with the future paths of the US Federal Reserve and the US economy likely weighing heavily on the future direction.

Chart by TradingView

Data Snapshot of Bond Market Traders | Columns Legend
Apr-25-2023OIOI-IndexSpec-NetSpec-IndexCom-NetCOM-IndexSmalls-NetSmalls-Index
Eurodollar604,7220-42,8367352,68223-9,84697
FedFunds1,909,06781-90,60828103,00672-12,39867
2-Year2,719,44185-546,30719486,7577659,55084
Long T-Bond1,193,35855-97,3685326,6982070,670100
10-Year4,362,22290-740,2610685,2169555,04597
5-Year4,576,091100-869,2880837,20910032,07990


Strength Scores led by Eurodollar & US Treasury Bonds

COT Strength Scores (a normalized measure of Speculator positions over a 3-Year range, from 0 to 100 where above 80 is Extreme-Bullish and below 20 is Extreme-Bearish) showed that the Eurodollar (73 percent) and the US Treasury Bonds (53 percent) lead the bond markets this week. The SOFR 3-Months (36 percent) comes in as the next highest in the weekly strength scores.

On the downside, the 5-Year Bonds (0 percent), the 10-Year Bonds (0 percent), the Ultra 10-Year Bonds (3 percent) and the 2-Year Bonds (19 percent) come in at the lowest strength level currently and are in Extreme-Bearish territory (below 20 percent).

Strength Statistics:
Fed Funds (28.4 percent) vs Fed Funds previous week (25.0 percent)
2-Year Bond (19.2 percent) vs 2-Year Bond previous week (15.5 percent)
5-Year Bond (0.0 percent) vs 5-Year Bond previous week (11.9 percent)
10-Year Bond (0.0 percent) vs 10-Year Bond previous week (6.5 percent)
Ultra 10-Year Bond (3.3 percent) vs Ultra 10-Year Bond previous week (0.0 percent)
US Treasury Bond (52.9 percent) vs US Treasury Bond previous week (46.5 percent)
Ultra US Treasury Bond (19.6 percent) vs Ultra US Treasury Bond previous week (19.1 percent)
Eurodollar (72.9 percent) vs Eurodollar previous week (72.7 percent)
SOFR 3-Months (36.5 percent) vs SOFR 3-Months previous week (43.8 percent)


Ultra Treasury Bonds & US Treasury Bonds top the 6-Week Strength Trends

COT Strength Score Trends (or move index, calculates the 6-week changes in strength scores) showed that the Ultra Treasury Bonds (19 percent) and the US Treasury Bonds (17 percent) lead the past six weeks trends for bonds.

The 5-Year Bond (-32.3 percent) leads the downside trend scores currently with the SOFR 3-Months (-31 percent) and the 10-Year Bonds (-25 percent) following next with lower trend scores.

Strength Trend Statistics:
Fed Funds (-0.2 percent) vs Fed Funds previous week (15.2 percent)
2-Year Bond (-1.9 percent) vs 2-Year Bond previous week (5.5 percent)
5-Year Bond (-32.3 percent) vs 5-Year Bond previous week (-10.2 percent)
10-Year Bond (-25.3 percent) vs 10-Year Bond previous week (-13.5 percent)
Ultra 10-Year Bond (0.3 percent) vs Ultra 10-Year Bond previous week (-3.0 percent)
US Treasury Bond (17.1 percent) vs US Treasury Bond previous week (18.3 percent)
Ultra US Treasury Bond (19.4 percent) vs Ultra US Treasury Bond previous week (11.3 percent)
Eurodollar (15.9 percent) vs Eurodollar previous week (23.1 percent)
SOFR 3-Months (-31.3 percent) vs SOFR 3-Months previous week (43.8 percent)


Individual Bond Markets:

3-Month Eurodollars Futures:

Eurodollar Bonds Futures COT ChartThe 3-Month Eurodollars large speculator standing this week was a net position of -42,836 contracts in the data reported through Tuesday. This was a weekly lift of 8,395 contracts from the previous week which had a total of -51,231 net contracts.

This week’s current strength score (the trader positioning range over the past three years, measured from 0 to 100) shows the speculators are currently Bullish with a score of 72.9 percent. The commercials are Bearish with a score of 23.0 percent and the small traders (not shown in chart) are Bullish-Extreme with a score of 97.2 percent.

3-Month Eurodollars StatisticsSPECULATORSCOMMERCIALSSMALL TRADERS
– Percent of Open Interest Longs:26.862.29.5
– Percent of Open Interest Shorts:33.953.511.2
– Net Position:-42,83652,682-9,846
– Gross Longs:162,210375,92457,705
– Gross Shorts:205,046323,24267,551
– Long to Short Ratio:0.8 to 11.2 to 10.9 to 1
NET POSITION TREND:
– Strength Index Score (3 Year Range Pct):72.923.097.2
– Strength Index Reading (3 Year Range):BullishBearishBullish-Extreme
NET POSITION MOVEMENT INDEX:
– 6-Week Change in Strength Index:15.9-20.752.8


Secured Overnight Financing Rate (3-Month) Futures:

SOFR 3-Months Bonds Futures COT ChartThe Secured Overnight Financing Rate (3-Month) large speculator standing this week was a net position of -716,355 contracts in the data reported through Tuesday. This was a weekly decrease of -89,967 contracts from the previous week which had a total of -626,388 net contracts.

This week’s current strength score (the trader positioning range over the past three years, measured from 0 to 100) shows the speculators are currently Bearish with a score of 36.5 percent. The commercials are Bullish with a score of 63.9 percent and the small traders (not shown in chart) are Bullish-Extreme with a score of 84.5 percent.

SOFR 3-Months StatisticsSPECULATORSCOMMERCIALSSMALL TRADERS
– Percent of Open Interest Longs:14.264.00.4
– Percent of Open Interest Shorts:21.756.40.5
– Net Position:-716,355722,508-6,153
– Gross Longs:1,351,6486,105,24641,555
– Gross Shorts:2,068,0035,382,73847,708
– Long to Short Ratio:0.7 to 11.1 to 10.9 to 1
NET POSITION TREND:
– Strength Index Score (3 Year Range Pct):36.563.984.5
– Strength Index Reading (3 Year Range):BearishBullishBullish-Extreme
NET POSITION MOVEMENT INDEX:
– 6-Week Change in Strength Index:-31.318.984.5


30-Day Federal Funds Futures:

Federal Funds 30-Day Bonds Futures COT ChartThe 30-Day Federal Funds large speculator standing this week was a net position of -90,608 contracts in the data reported through Tuesday. This was a weekly boost of 28,111 contracts from the previous week which had a total of -118,719 net contracts.

This week’s current strength score (the trader positioning range over the past three years, measured from 0 to 100) shows the speculators are currently Bearish with a score of 28.4 percent. The commercials are Bullish with a score of 72.4 percent and the small traders (not shown in chart) are Bullish with a score of 66.7 percent.

30-Day Federal Funds StatisticsSPECULATORSCOMMERCIALSSMALL TRADERS
– Percent of Open Interest Longs:3.779.72.2
– Percent of Open Interest Shorts:8.474.32.8
– Net Position:-90,608103,006-12,398
– Gross Longs:70,4411,520,81641,850
– Gross Shorts:161,0491,417,81054,248
– Long to Short Ratio:0.4 to 11.1 to 10.8 to 1
NET POSITION TREND:
– Strength Index Score (3 Year Range Pct):28.472.466.7
– Strength Index Reading (3 Year Range):BearishBullishBullish
NET POSITION MOVEMENT INDEX:
– 6-Week Change in Strength Index:-0.2-3.966.7


2-Year Treasury Note Futures:

2-Year Treasury Bonds Futures COT ChartThe 2-Year Treasury Note large speculator standing this week was a net position of -546,307 contracts in the data reported through Tuesday. This was a weekly increase of 28,607 contracts from the previous week which had a total of -574,914 net contracts.

This week’s current strength score (the trader positioning range over the past three years, measured from 0 to 100) shows the speculators are currently Bearish-Extreme with a score of 19.2 percent. The commercials are Bullish with a score of 75.8 percent and the small traders (not shown in chart) are Bullish-Extreme with a score of 84.3 percent.

2-Year Treasury Note StatisticsSPECULATORSCOMMERCIALSSMALL TRADERS
– Percent of Open Interest Longs:9.881.08.2
– Percent of Open Interest Shorts:29.963.16.0
– Net Position:-546,307486,75759,550
– Gross Longs:265,7112,203,465221,675
– Gross Shorts:812,0181,716,708162,125
– Long to Short Ratio:0.3 to 11.3 to 11.4 to 1
NET POSITION TREND:
– Strength Index Score (3 Year Range Pct):19.275.884.3
– Strength Index Reading (3 Year Range):Bearish-ExtremeBullishBullish-Extreme
NET POSITION MOVEMENT INDEX:
– 6-Week Change in Strength Index:-1.9-3.418.5


5-Year Treasury Note Futures:

5-Year Treasury Bonds Futures COT ChartThe 5-Year Treasury Note large speculator standing this week was a net position of -869,288 contracts in the data reported through Tuesday. This was a weekly decline of -114,786 contracts from the previous week which had a total of -754,502 net contracts.

This week’s current strength score (the trader positioning range over the past three years, measured from 0 to 100) shows the speculators are currently Bearish-Extreme with a score of 0.0 percent. The commercials are Bullish-Extreme with a score of 100.0 percent and the small traders (not shown in chart) are Bullish-Extreme with a score of 89.8 percent.

5-Year Treasury Note StatisticsSPECULATORSCOMMERCIALSSMALL TRADERS
– Percent of Open Interest Longs:6.784.17.9
– Percent of Open Interest Shorts:25.765.87.2
– Net Position:-869,288837,20932,079
– Gross Longs:307,6403,846,432359,672
– Gross Shorts:1,176,9283,009,223327,593
– Long to Short Ratio:0.3 to 11.3 to 11.1 to 1
NET POSITION TREND:
– Strength Index Score (3 Year Range Pct):0.0100.089.8
– Strength Index Reading (3 Year Range):Bearish-ExtremeBullish-ExtremeBullish-Extreme
NET POSITION MOVEMENT INDEX:
– 6-Week Change in Strength Index:-32.327.516.4


10-Year Treasury Note Futures:

10-Year Treasury Notes Bonds Futures COT ChartThe 10-Year Treasury Note large speculator standing this week was a net position of -740,261 contracts in the data reported through Tuesday. This was a weekly decline of -60,180 contracts from the previous week which had a total of -680,081 net contracts.

This week’s current strength score (the trader positioning range over the past three years, measured from 0 to 100) shows the speculators are currently Bearish-Extreme with a score of 0.0 percent. The commercials are Bullish-Extreme with a score of 95.2 percent and the small traders (not shown in chart) are Bullish-Extreme with a score of 96.9 percent.

10-Year Treasury Note StatisticsSPECULATORSCOMMERCIALSSMALL TRADERS
– Percent of Open Interest Longs:8.979.49.2
– Percent of Open Interest Shorts:25.963.77.9
– Net Position:-740,261685,21655,045
– Gross Longs:389,7283,462,741400,768
– Gross Shorts:1,129,9892,777,525345,723
– Long to Short Ratio:0.3 to 11.2 to 11.2 to 1
NET POSITION TREND:
– Strength Index Score (3 Year Range Pct):0.095.296.9
– Strength Index Reading (3 Year Range):Bearish-ExtremeBullish-ExtremeBullish-Extreme
NET POSITION MOVEMENT INDEX:
– 6-Week Change in Strength Index:-25.311.830.8


Ultra 10-Year Notes Futures:

Ultra 10-Year Treasury Notes Bonds Futures COT ChartThe Ultra 10-Year Notes large speculator standing this week was a net position of -190,916 contracts in the data reported through Tuesday. This was a weekly advance of 15,667 contracts from the previous week which had a total of -206,583 net contracts.

This week’s current strength score (the trader positioning range over the past three years, measured from 0 to 100) shows the speculators are currently Bearish-Extreme with a score of 3.3 percent. The commercials are Bullish-Extreme with a score of 91.9 percent and the small traders (not shown in chart) are Bullish with a score of 67.4 percent.

Ultra 10-Year Notes StatisticsSPECULATORSCOMMERCIALSSMALL TRADERS
– Percent of Open Interest Longs:8.680.010.0
– Percent of Open Interest Shorts:20.563.214.9
– Net Position:-190,916269,304-78,388
– Gross Longs:137,5311,281,853160,380
– Gross Shorts:328,4471,012,549238,768
– Long to Short Ratio:0.4 to 11.3 to 10.7 to 1
NET POSITION TREND:
– Strength Index Score (3 Year Range Pct):3.391.967.4
– Strength Index Reading (3 Year Range):Bearish-ExtremeBullish-ExtremeBullish
NET POSITION MOVEMENT INDEX:
– 6-Week Change in Strength Index:0.311.5-32.6


US Treasury Bonds Futures:

US Year Treasury Notes Long Bonds Futures COT ChartThe US Treasury Bonds large speculator standing this week was a net position of -97,368 contracts in the data reported through Tuesday. This was a weekly advance of 19,560 contracts from the previous week which had a total of -116,928 net contracts.

This week’s current strength score (the trader positioning range over the past three years, measured from 0 to 100) shows the speculators are currently Bullish with a score of 52.9 percent. The commercials are Bearish with a score of 20.1 percent and the small traders (not shown in chart) are Bullish-Extreme with a score of 100.0 percent.

US Treasury Bonds StatisticsSPECULATORSCOMMERCIALSSMALL TRADERS
– Percent of Open Interest Longs:6.877.914.8
– Percent of Open Interest Shorts:15.075.78.8
– Net Position:-97,36826,69870,670
– Gross Longs:81,222929,608176,053
– Gross Shorts:178,590902,910105,383
– Long to Short Ratio:0.5 to 11.0 to 11.7 to 1
NET POSITION TREND:
– Strength Index Score (3 Year Range Pct):52.920.1100.0
– Strength Index Reading (3 Year Range):BullishBearishBullish-Extreme
NET POSITION MOVEMENT INDEX:
– 6-Week Change in Strength Index:17.1-30.123.2


Ultra US Treasury Bonds Futures:

Ultra US Year Treasury Notes Long Bonds Futures COT ChartThe Ultra US Treasury Bonds large speculator standing this week was a net position of -397,985 contracts in the data reported through Tuesday. This was a weekly rise of 1,016 contracts from the previous week which had a total of -399,001 net contracts.

This week’s current strength score (the trader positioning range over the past three years, measured from 0 to 100) shows the speculators are currently Bearish-Extreme with a score of 19.6 percent. The commercials are Bullish with a score of 76.7 percent and the small traders (not shown in chart) are Bullish-Extreme with a score of 90.2 percent.

Ultra US Treasury Bonds StatisticsSPECULATORSCOMMERCIALSSMALL TRADERS
– Percent of Open Interest Longs:5.882.012.0
– Percent of Open Interest Shorts:33.757.78.4
– Net Position:-397,985347,57550,410
– Gross Longs:83,0531,171,201170,666
– Gross Shorts:481,038823,626120,256
– Long to Short Ratio:0.2 to 11.4 to 11.4 to 1
NET POSITION TREND:
– Strength Index Score (3 Year Range Pct):19.676.790.2
– Strength Index Reading (3 Year Range):Bearish-ExtremeBullishBullish-Extreme
NET POSITION MOVEMENT INDEX:
– 6-Week Change in Strength Index:19.4-23.22.5


Article By InvestMacroReceive our weekly COT Newsletter

*COT Report: The COT data, released weekly to the public each Friday, is updated through the most recent Tuesday (data is 3 days old) and shows a quick view of how large speculators or non-commercials (for-profit traders) were positioned in the futures markets.

The CFTC categorizes trader positions according to commercial hedgers (traders who use futures contracts for hedging as part of the business), non-commercials (large traders who speculate to realize trading profits) and nonreportable traders (usually small traders/speculators) as well as their open interest (contracts open in the market at time of reporting). See CFTC criteria here.

COT Stock Market Charts: Weekly Speculator Changes led by Russell & Nasdaq

By InvestMacro

Here are the latest charts and statistics for the Commitment of Traders (COT) data published by the Commodities Futures Trading Commission (CFTC).

The latest COT data is updated through Tuesday April 25th and shows a quick view of how large traders (for-profit speculators and commercial entities) were positioned in the futures markets.

Weekly Speculator Changes led by Russell-Mini & Nasdaq-Mini

The COT stock markets speculator bets were lower this week as two out of the seven stock markets we cover had higher positioning while the other six markets had lower speculator contracts.

Leading the gains for the stock markets was the Russell-Mini (7,043 contracts) with the Nasdaq-Mini (2,457 contracts) also showing a positive week.

The markets with the declines in speculator bets this week were the S&P500-Mini (-19,010 contracts), the VIX (-18,089 contracts), MSCI EAFE-Mini (-2,041 contracts), DowJones-Mini (-1,276 contracts) and with the Nikkei 225 (-16 contracts) also registering lower bets on the week.


Data Snapshot of Stock Market Traders | Columns Legend
Apr-25-2023OIOI-IndexSpec-NetSpec-IndexCom-NetCOM-IndexSmalls-NetSmalls-Index
S&P500-Mini2,265,79420-363,2670386,640100-23,37322
Nikkei 22512,3746-2,572611,8064176638
Nasdaq-Mini247,654395,130783,46929-8,59937
DowJones-Mini99,21762-25,673832,600100-6,92710
VIX370,16375-81,8506082,90635-1,05690
Nikkei 225 Yen44,218295,4665115,71154-21,17735


Strength Scores led by Nasdaq-Mini & Nikkei 225

COT Strength Scores (a normalized measure of Speculator positions over a 3-Year range, from 0 to 100 where above 80 is Extreme-Bullish and below 20 is Extreme-Bearish) showed that the Nasdaq-Mini (78 percent) and the Nikkei 225 (61 percent) lead the stock markets this week. The VIX (60 percent) comes in as the next highest in the weekly strength scores.

On the downside, the S&P500-Mini (0 percent) and the DowJones-Mini (8 percent) come in at the lowest strength level currently and is in Extreme-Bearish territory (below 20 percent).

Strength Statistics:
VIX (59.6 percent) vs VIX previous week (72.9 percent)
S&P500-Mini (0.0 percent) vs S&P500-Mini previous week (3.2 percent)
DowJones-Mini (8.1 percent) vs DowJones-Mini previous week (11.5 percent)
Nasdaq-Mini (77.9 percent) vs Nasdaq-Mini previous week (76.5 percent)
Russell2000-Mini (40.7 percent) vs Russell2000-Mini previous week (36.5 percent)
Nikkei USD (61.3 percent) vs Nikkei USD previous week (61.4 percent)
EAFE-Mini (21.4 percent) vs EAFE-Mini previous week (23.9 percent)


Nasdaq-Mini tops the 6-Week Strength Trends

COT Strength Score Trends (or move index, calculates the 6-week changes in strength scores) showed that the Nasdaq-Mini (6.5 percent) leads the past six weeks trends and is the only positive mover for the stock markets this week.

The S&P500-Mini (-41 percent) leads the downside trend scores currently with the MSCI EAFE-Mini (-29 percent) coming in as the next market with lower trend scores.

Strength Trend Statistics:
VIX (-14.9 percent) vs VIX previous week (-1.3 percent)
S&P500-Mini (-40.6 percent) vs S&P500-Mini previous week (-22.5 percent)
DowJones-Mini (-14.7 percent) vs DowJones-Mini previous week (-30.8 percent)
Nasdaq-Mini (6.5 percent) vs Nasdaq-Mini previous week (8.4 percent)
Russell2000-Mini (-1.7 percent) vs Russell2000-Mini previous week (-5.2 percent)
Nikkei USD (-1.1 percent) vs Nikkei USD previous week (4.8 percent)
EAFE-Mini (-29.3 percent) vs EAFE-Mini previous week (-14.1 percent)


Individual Stock Market Charts:

VIX Volatility Futures:

VIX Volatility Futures COT ChartThe VIX Volatility large speculator standing this week was a net position of -81,850 contracts in the data reported through Tuesday. This was a weekly lowering of -18,089 contracts from the previous week which had a total of -63,761 net contracts.

This week’s current strength score (the trader positioning range over the past three years, measured from 0 to 100) shows the speculators are currently Bullish with a score of 59.6 percent. The commercials are Bearish with a score of 35.5 percent and the small traders (not shown in chart) are Bullish-Extreme with a score of 90.4 percent.

VIX Volatility Futures StatisticsSPECULATORSCOMMERCIALSSMALL TRADERS
– Percent of Open Interest Longs:19.654.26.8
– Percent of Open Interest Shorts:41.731.87.1
– Net Position:-81,85082,906-1,056
– Gross Longs:72,595200,74725,269
– Gross Shorts:154,445117,84126,325
– Long to Short Ratio:0.5 to 11.7 to 11.0 to 1
NET POSITION TREND:
– Strength Index Score (3 Year Range Pct):59.635.590.4
– Strength Index Reading (3 Year Range):BullishBearishBullish-Extreme
NET POSITION MOVEMENT INDEX:
– 6-Week Change in Strength Index:-14.912.019.1


S&P500 Mini Futures:

SP500 Mini Futures COT ChartThe S&P500 Mini large speculator standing this week was a net position of -363,267 contracts in the data reported through Tuesday. This was a weekly decline of -19,010 contracts from the previous week which had a total of -344,257 net contracts.

This week’s current strength score (the trader positioning range over the past three years, measured from 0 to 100) shows the speculators are currently Bearish-Extreme with a score of 0.0 percent. The commercials are Bullish-Extreme with a score of 100.0 percent and the small traders (not shown in chart) are Bearish with a score of 22.0 percent.

S&P500 Mini Futures StatisticsSPECULATORSCOMMERCIALSSMALL TRADERS
– Percent of Open Interest Longs:9.277.110.6
– Percent of Open Interest Shorts:25.260.111.6
– Net Position:-363,267386,640-23,373
– Gross Longs:207,3331,747,428240,239
– Gross Shorts:570,6001,360,788263,612
– Long to Short Ratio:0.4 to 11.3 to 10.9 to 1
NET POSITION TREND:
– Strength Index Score (3 Year Range Pct):0.0100.022.0
– Strength Index Reading (3 Year Range):Bearish-ExtremeBullish-ExtremeBearish
NET POSITION MOVEMENT INDEX:
– 6-Week Change in Strength Index:-40.630.18.6


Dow Jones Mini Futures:

Dow Jones Mini Futures COT ChartThe Dow Jones Mini large speculator standing this week was a net position of -25,673 contracts in the data reported through Tuesday. This was a weekly fall of -1,276 contracts from the previous week which had a total of -24,397 net contracts.

This week’s current strength score (the trader positioning range over the past three years, measured from 0 to 100) shows the speculators are currently Bearish-Extreme with a score of 8.1 percent. The commercials are Bullish-Extreme with a score of 100.0 percent and the small traders (not shown in chart) are Bearish-Extreme with a score of 10.1 percent.

Dow Jones Mini Futures StatisticsSPECULATORSCOMMERCIALSSMALL TRADERS
– Percent of Open Interest Longs:23.063.811.4
– Percent of Open Interest Shorts:48.930.918.4
– Net Position:-25,67332,600-6,927
– Gross Longs:22,82963,28111,297
– Gross Shorts:48,50230,68118,224
– Long to Short Ratio:0.5 to 12.1 to 10.6 to 1
NET POSITION TREND:
– Strength Index Score (3 Year Range Pct):8.1100.010.1
– Strength Index Reading (3 Year Range):Bearish-ExtremeBullish-ExtremeBearish-Extreme
NET POSITION MOVEMENT INDEX:
– 6-Week Change in Strength Index:-14.712.3-2.4


Nasdaq Mini Futures:

Nasdaq Mini Futures COT ChartThe Nasdaq Mini large speculator standing this week was a net position of 5,130 contracts in the data reported through Tuesday. This was a weekly increase of 2,457 contracts from the previous week which had a total of 2,673 net contracts.

This week’s current strength score (the trader positioning range over the past three years, measured from 0 to 100) shows the speculators are currently Bullish with a score of 77.9 percent. The commercials are Bearish with a score of 28.6 percent and the small traders (not shown in chart) are Bearish with a score of 37.3 percent.

Nasdaq Mini Futures StatisticsSPECULATORSCOMMERCIALSSMALL TRADERS
– Percent of Open Interest Longs:26.257.614.2
– Percent of Open Interest Shorts:24.156.217.7
– Net Position:5,1303,469-8,599
– Gross Longs:64,807142,70735,188
– Gross Shorts:59,677139,23843,787
– Long to Short Ratio:1.1 to 11.0 to 10.8 to 1
NET POSITION TREND:
– Strength Index Score (3 Year Range Pct):77.928.637.3
– Strength Index Reading (3 Year Range):BullishBearishBearish
NET POSITION MOVEMENT INDEX:
– 6-Week Change in Strength Index:6.5-19.437.3


Russell 2000 Mini Futures:

Russell 2000 Mini Futures COT ChartThe Russell 2000 Mini large speculator standing this week was a net position of -52,119 contracts in the data reported through Tuesday. This was a weekly gain of 7,043 contracts from the previous week which had a total of -59,162 net contracts.

This week’s current strength score (the trader positioning range over the past three years, measured from 0 to 100) shows the speculators are currently Bearish with a score of 40.7 percent. The commercials are Bullish with a score of 62.8 percent and the small traders (not shown in chart) are Bearish-Extreme with a score of 9.7 percent.

Russell 2000 Mini Futures StatisticsSPECULATORSCOMMERCIALSSMALL TRADERS
– Percent of Open Interest Longs:11.683.33.9
– Percent of Open Interest Shorts:21.772.15.0
– Net Position:-52,11957,566-5,447
– Gross Longs:59,738428,83220,133
– Gross Shorts:111,857371,26625,580
– Long to Short Ratio:0.5 to 11.2 to 10.8 to 1
NET POSITION TREND:
– Strength Index Score (3 Year Range Pct):40.762.89.7
– Strength Index Reading (3 Year Range):BearishBullishBearish-Extreme
NET POSITION MOVEMENT INDEX:
– 6-Week Change in Strength Index:-1.74.6-16.4


Nikkei Stock Average (USD) Futures:

Nikkei Stock Average (USD) Futures COT ChartThe Nikkei Stock Average (USD) large speculator standing this week was a net position of -2,572 contracts in the data reported through Tuesday. This was a weekly decline of -16 contracts from the previous week which had a total of -2,556 net contracts.

This week’s current strength score (the trader positioning range over the past three years, measured from 0 to 100) shows the speculators are currently Bullish with a score of 61.3 percent. The commercials are Bearish with a score of 41.2 percent and the small traders (not shown in chart) are Bearish with a score of 37.9 percent.

Nikkei Stock Average Futures StatisticsSPECULATORSCOMMERCIALSSMALL TRADERS
– Percent of Open Interest Longs:20.147.432.5
– Percent of Open Interest Shorts:40.932.826.3
– Net Position:-2,5721,806766
– Gross Longs:2,4855,8674,022
– Gross Shorts:5,0574,0613,256
– Long to Short Ratio:0.5 to 11.4 to 11.2 to 1
NET POSITION TREND:
– Strength Index Score (3 Year Range Pct):61.341.237.9
– Strength Index Reading (3 Year Range):BullishBearishBearish
NET POSITION MOVEMENT INDEX:
– 6-Week Change in Strength Index:-1.13.0-4.4


MSCI EAFE Mini Futures:

MSCI EAFE Mini Futures COT ChartThe MSCI EAFE Mini large speculator standing this week was a net position of -18,693 contracts in the data reported through Tuesday. This was a weekly decline of -2,041 contracts from the previous week which had a total of -16,652 net contracts.

This week’s current strength score (the trader positioning range over the past three years, measured from 0 to 100) shows the speculators are currently Bearish with a score of 21.4 percent. The commercials are Bullish with a score of 74.1 percent and the small traders (not shown in chart) are Bearish with a score of 47.9 percent.

MSCI EAFE Mini Futures StatisticsSPECULATORSCOMMERCIALSSMALL TRADERS
– Percent of Open Interest Longs:7.189.52.8
– Percent of Open Interest Shorts:11.786.41.2
– Net Position:-18,69312,4906,203
– Gross Longs:28,394359,98011,143
– Gross Shorts:47,087347,4904,940
– Long to Short Ratio:0.6 to 11.0 to 12.3 to 1
NET POSITION TREND:
– Strength Index Score (3 Year Range Pct):21.474.147.9
– Strength Index Reading (3 Year Range):BearishBullishBearish
NET POSITION MOVEMENT INDEX:
– 6-Week Change in Strength Index:-29.341.6-52.1


Article By InvestMacroReceive our weekly COT Newsletter

*COT Report: The COT data, released weekly to the public each Friday, is updated through the most recent Tuesday (data is 3 days old) and shows a quick view of how large speculators or non-commercials (for-profit traders) were positioned in the futures markets.

The CFTC categorizes trader positions according to commercial hedgers (traders who use futures contracts for hedging as part of the business), non-commercials (large traders who speculate to realize trading profits) and nonreportable traders (usually small traders/speculators) as well as their open interest (contracts open in the market at time of reporting). See CFTC criteria here.

Speculator Extremes: Cocoa, 5-Year & 10-Year Bonds lead weekly Bullish & Bearish Positions

By InvestMacro

The latest update for the weekly Commitment of Traders (COT) report was released by the Commodity Futures Trading Commission (CFTC) on Friday for data ending on April 25th.

This weekly Extreme Positions report highlights the Most Bullish and Most Bearish Positions for the speculator category. Extreme positioning in these markets can foreshadow strong moves in the underlying market.

To signify an extreme position, we use the Strength Index (also known as the COT Index) of each instrument, a common method of measuring COT data. The Strength Index is simply a comparison of current trader positions against the range of positions over the previous 3 years. We use over 80 percent as extremely bullish and under 20 percent as extremely bearish. (Compare Strength Index scores across all markets in the data table or cot leaders table)


Speculators or Non-Commercials Notes:

Speculators, classified as non-commercial traders by the CFTC, are made up of large commodity funds, hedge funds and other significant for-profit participants. The Specs are generally regarded as trend-followers in their behavior towards price action – net speculator bets and prices tend to go in the same directions. These traders often look to buy when prices are rising and sell when prices are falling. To illustrate this point, many times speculator contracts can be found at their most extremes (bullish or bearish) when prices are also close to their highest or lowest levels.

These extreme levels can be dangerous for the large speculators as the trade is most crowded, there is less trading ammunition still sitting on the sidelines to push the trend further and prices have moved a significant distance. When the trend becomes exhausted, some speculators take profits while others look to also exit positions when prices fail to continue in the same direction. This process usually plays out over many months to years and can ultimately create a reverse effect where prices start to fall and speculators start a process of selling when prices are falling.


Here Are This Week’s Most Bullish Speculator Positions:

Cocoa Futures


The Cocoa Futures speculator position comes in as the most bullish extreme standing this week with the speculator level at a 100.0 percent score of its 3-year range.

The six-week trend change for the percent strength score totaled 37.7 this week. The overall net speculator position was a total of 61,714 net contracts this week with a gain of 2,359 contract in the weekly speculator bets.


Bloomberg Commodity Index


The Bloomberg Commodity Index speculator position comes next in the extreme standings this week. The Bloomberg Commodity Index speculator level is now at a 99.6 percent score of its 3-year range.

The six-week trend for the percent strength score was 4.6 this week. The speculator position registered -2,059 net contracts this week with a weekly change of 1,851 contracts in speculator bets.


Live Cattle


The Live Cattle speculator position comes in third this week in the extreme standings. The Live Cattle speculator level resides at a 92.5 percent score of its 3-year range.

The six-week trend for the speculator strength score came in at 7.4 this week. The overall speculator position was 102,034 net contracts this week with a dip of -38 contracts in the weekly speculator bets.


Sugar


The Sugar speculator position comes up number four in the extreme standings this week. The Sugar speculator level is at a 89.8 percent score of its 3-year range.

The six-week trend for the speculator strength score totaled a change of 17.1 this week. The overall speculator position was 279,528 net contracts this week with a rise of 10,356 contracts in the speculator bets.


Mexican Peso


The Mexican Peso speculator position rounds out the top five in this week’s bullish extreme standings. The Mexican Peso speculator level sits at a 89.6 percent score of its 3-year range. The six-week trend for the speculator strength score was -9.1 this week.

The net speculator position was 54,128 net contracts this week with a decline of -2,043 contracts in the weekly speculator bets.


This Week’s Most Bearish Speculator Positions:

5-Year Bond


The 5-Year Bond speculator position comes in as the most bearish extreme standing this week as the speculator level is at a 0.0 percent score of its 3-year range.

The six-week trend for the speculator strength score was -32.3 this week. The overall speculator position was -869,288 net contracts with a sharp drop of -114,786 contracts in the speculator bets.


10-Year Note


The 10-Year Note speculator position comes in next for the most bearish extreme standing on the week. The 10-Year Note speculator level is at a 0.0 percent score of its 3-year range.

The six-week trend for the speculator strength score was -25.3 this week. The speculator position was -740,261 net contracts this week with a decrease of -60,180 contracts in the weekly speculator bets.


Lean Hogs


The Lean Hogs speculator position comes in as third most bearish extreme standing of the week. The Lean Hogs speculator level resides at a 0.1 percent score of its 3-year range.

The six-week trend for the speculator strength score was -18.9 this week. The overall speculator position was -27,022 net contracts this week with a nudge higher by 135 contracts in the speculator bets.


Ultra 10-Year U.S. T-Note


The Ultra 10-Year U.S. T-Note speculator position comes in as this week’s fourth most bearish extreme standing with a speculator level is at 3.3 percent score of its 3-year range.

The six-week trend for the speculator strength score was 0.3 this week. The speculator position was -190,916 net contracts this week with a gain of 15,667 contracts in the weekly speculator bets.


Cotton


Finally, the Cotton speculator position comes in as the fifth most bearish extreme standing for this week. The Cotton speculator level is at a 4.6 percent score of its 3-year range.

The six-week trend for the speculator strength score was -2.0 this week. The speculator position was -5,413 net contracts this week with a drop of -9,883 contracts in the weekly speculator bets.


Article By InvestMacroReceive our weekly COT Newsletter

*COT Report: The COT data, released weekly to the public each Friday, is updated through the most recent Tuesday (data is 3 days old) and shows a quick view of how large speculators or non-commercials (for-profit traders) were positioned in the futures markets.

The CFTC categorizes trader positions according to commercial hedgers (traders who use futures contracts for hedging as part of the business), non-commercials (large traders who speculate to realize trading profits) and nonreportable traders (usually small traders/speculators) as well as their open interest (contracts open in the market at time of reporting). See CFTC criteria here.

Speculators boost Cocoa bullish bets to highest since March 2020

By InvestMacro

Here are the latest charts and statistics for the Commitment of Traders (COT) reports data published by the Commodities Futures Trading Commission (CFTC).

The latest COT data is updated through Tuesday April 25th and shows a quick view of how large traders (for-profit speculators and commercial entities) were positioned in the futures markets.

Weekly Speculator Changes led by Cocoa & Sugar

The COT soft commodities markets speculator bets were lower this week as three out of the eleven softs markets we cover had higher positioning while the other eight markets had lower speculator contracts.

Leading the gains for the softs markets was Sugar (10,356 contracts) with Cocoa (2,359 contracts) and Lean Hogs (135 contracts) also showing positive weeks.

The markets with the declines in speculator bets this week were Corn (-80,988 contracts), Soybeans (-73,414 contracts), Wheat (-12,652 contracts), Soybean Meal (-19,017 contracts), Cotton (-9,883 contracts), Soybean Oil (-8,806 contracts), Coffee (-409 contracts) and Live Cattle (-38 contracts).

Cocoa bullish bets hit highest since March 2020

Highlighting the COT soft commodities data this week is the multi-year high in bullish bets of the Cocoa speculator’s positioning. The large speculator bets for Cocoa rose this week for the first time in the past four weeks but the boost pushed the overall net position to its highest level since 2020. This week’s gain brought the Cocoa speculator net position to a total of +61,714 contracts which marks the most bullish level of the past 164 weeks, dating back to March 10th of 2020.

Cocoa trader sentiment and futures prices have been pushed higher recently due to increased demand and because of supply issues arising out of Africa. Nigeria’s exports as well as the Ivory Coast’s exports have been on the decline while dryer weather conditions have also hampered production on the continent. Meanwhile, the demand for Cocoa is being forecast to grow approximately 5 percent annually for the next decade.

The Cocoa futures price fell modestly this week but has been on a strong bullish trend since hitting a recent low in September. Last week, the futures price hit its highest level since 2016 right around the 2995 price before retreating this week to 2937.


Data Snapshot of Commodity Market Traders | Columns Legend
Apr-25-2023OIOI-IndexSpec-NetSpec-IndexCom-NetCOM-IndexSmalls-NetSmalls-Index
WTI Crude1,826,19538236,43820-271,1977934,75953
Gold473,20924185,26459-211,9284226,66447
Silver149,6923730,60362-41,5234410,92027
Copper202,42244-17,042138,304808,73874
Palladium12,27088-5,877116,30990-43216
Platinum72,1257929,61784-34,316234,69931
Natural Gas1,274,53663-136,15018105,7748230,37652
Brent140,3216-40,5642636,713733,85161
Heating Oil268,225237,59340-16,018818,42528
Soybeans630,93512104,09630-76,49170-27,60526
Corn1,242,943724,6483334,70077-59,34818
Coffee192,927736,59265-37,705381,11326
Sugar959,70861279,52890-335,640756,11276
Wheat366,39047-83,188075,3691007,819100


Strength Scores led by Cocoa & Live Cattle

COT Strength Scores (a normalized measure of Speculator positions over a 3-Year range, from 0 to 100 where above 80 is Extreme-Bullish and below 20 is Extreme-Bearish) showed that Cocoa (100 percent) and Live Cattle (93 percent) lead the softs markets this week. Sugar (90 percent), Soybean Meal (66 percent) and Coffee (65 percent) come in as the next highest in the weekly strength scores.

On the downside, Lean Hogs (0 percent), Soybean Oil (0 percent), Wheat (0 percent) and the Cotton (5 percent) come in at the lowest strength levels currently and are in Extreme-Bearish territory (below 20 percent).

Strength Statistics:
Corn (33.2 percent) vs Corn previous week (43.5 percent)
Sugar (89.8 percent) vs Sugar previous week (86.1 percent)
Coffee (64.9 percent) vs Coffee previous week (65.4 percent)
Soybeans (30.1 percent) vs Soybeans previous week (58.9 percent)
Soybean Oil (0.0 percent) vs Soybean Oil previous week (5.5 percent)
Soybean Meal (65.7 percent) vs Soybean Meal previous week (75.6 percent)
Live Cattle (92.5 percent) vs Live Cattle previous week (92.5 percent)
Lean Hogs (0.1 percent) vs Lean Hogs previous week (0.0 percent)
Cotton (4.6 percent) vs Cotton previous week (12.1 percent)
Cocoa (100.0 percent) vs Cocoa previous week (97.0 percent)
Wheat (0.0 percent) vs Wheat previous week (9.7 percent)


Cocoa & Coffee top the 6-Week Strength Trends

COT Strength Score Trends (or move index, calculates the 6-week changes in strength scores) showed that Cocoa (38 percent) and Coffee (25 percent) lead the past six weeks trends for soft commodities. Sugar (17 percent) and Live Cattle (7 percent) are the next highest positive movers in the latest trends data.

Soybeans (-25 percent) leads the downside trend scores currently with Soybean Meal (-24 percent), Lean Hogs (-19 percent) and Wheat (-14 percent) following next with lower trend scores.

Strength Trend Statistics:
Corn (-2.4 percent) vs Corn previous week (0.3 percent)
Sugar (17.1 percent) vs Sugar previous week (10.1 percent)
Coffee (24.9 percent) vs Coffee previous week (22.5 percent)
Soybeans (-25.1 percent) vs Soybeans previous week (-1.1 percent)
Soybean Oil (-12.0 percent) vs Soybean Oil previous week (-19.5 percent)
Soybean Meal (-24.2 percent) vs Soybean Meal previous week (-24.4 percent)
Live Cattle (7.4 percent) vs Live Cattle previous week (-7.5 percent)
Lean Hogs (-18.9 percent) vs Lean Hogs previous week (-17.5 percent)
Cotton (-2.0 percent) vs Cotton previous week (-1.1 percent)
Cocoa (37.7 percent) vs Cocoa previous week (5.9 percent)
Wheat (-13.8 percent) vs Wheat previous week (2.1 percent)


Individual Soft Commodities Markets:

CORN Futures:

CORN Futures COT ChartThe CORN large speculator standing this week was a net position of 24,648 contracts in the data reported through Tuesday. This was a weekly lowering of -80,988 contracts from the previous week which had a total of 105,636 net contracts.

This week’s current strength score (the trader positioning range over the past three years, measured from 0 to 100) shows the speculators are currently Bearish with a score of 33.2 percent. The commercials are Bullish with a score of 76.8 percent and the small traders (not shown in chart) are Bearish-Extreme with a score of 17.9 percent.

CORN Futures StatisticsSPECULATORSCOMMERCIALSSMALL TRADERS
– Percent of Open Interest Longs:23.951.88.8
– Percent of Open Interest Shorts:21.949.013.5
– Net Position:24,64834,700-59,348
– Gross Longs:297,251644,207109,017
– Gross Shorts:272,603609,507168,365
– Long to Short Ratio:1.1 to 11.1 to 10.6 to 1
NET POSITION TREND:
– Strength Index Score (3 Year Range Pct):33.276.817.9
– Strength Index Reading (3 Year Range):BearishBullishBearish-Extreme
NET POSITION MOVEMENT INDEX:
– 6-Week Change in Strength Index:-2.42.13.4


SUGAR Futures:

SUGAR Futures COT ChartThe SUGAR large speculator standing this week was a net position of 279,528 contracts in the data reported through Tuesday. This was a weekly gain of 10,356 contracts from the previous week which had a total of 269,172 net contracts.

This week’s current strength score (the trader positioning range over the past three years, measured from 0 to 100) shows the speculators are currently Bullish-Extreme with a score of 89.8 percent. The commercials are Bearish-Extreme with a score of 7.3 percent and the small traders (not shown in chart) are Bullish with a score of 75.8 percent.

SUGAR Futures StatisticsSPECULATORSCOMMERCIALSSMALL TRADERS
– Percent of Open Interest Longs:36.939.510.6
– Percent of Open Interest Shorts:7.874.54.8
– Net Position:279,528-335,64056,112
– Gross Longs:354,581379,027101,894
– Gross Shorts:75,053714,66745,782
– Long to Short Ratio:4.7 to 10.5 to 12.2 to 1
NET POSITION TREND:
– Strength Index Score (3 Year Range Pct):89.87.375.8
– Strength Index Reading (3 Year Range):Bullish-ExtremeBearish-ExtremeBullish
NET POSITION MOVEMENT INDEX:
– 6-Week Change in Strength Index:17.1-17.110.3


COFFEE Futures:

COFFEE Futures COT ChartThe COFFEE large speculator standing this week was a net position of 36,592 contracts in the data reported through Tuesday. This was a weekly lowering of -409 contracts from the previous week which had a total of 37,001 net contracts.

This week’s current strength score (the trader positioning range over the past three years, measured from 0 to 100) shows the speculators are currently Bullish with a score of 64.9 percent. The commercials are Bearish with a score of 38.4 percent and the small traders (not shown in chart) are Bearish with a score of 26.1 percent.

COFFEE Futures StatisticsSPECULATORSCOMMERCIALSSMALL TRADERS
– Percent of Open Interest Longs:30.242.33.8
– Percent of Open Interest Shorts:11.261.93.3
– Net Position:36,592-37,7051,113
– Gross Longs:58,26681,7047,412
– Gross Shorts:21,674119,4096,299
– Long to Short Ratio:2.7 to 10.7 to 11.2 to 1
NET POSITION TREND:
– Strength Index Score (3 Year Range Pct):64.938.426.1
– Strength Index Reading (3 Year Range):BullishBearishBearish
NET POSITION MOVEMENT INDEX:
– 6-Week Change in Strength Index:24.9-24.65.1


SOYBEANS Futures:

SOYBEANS Futures COT ChartThe SOYBEANS large speculator standing this week was a net position of 104,096 contracts in the data reported through Tuesday. This was a weekly reduction of -73,414 contracts from the previous week which had a total of 177,510 net contracts.

This week’s current strength score (the trader positioning range over the past three years, measured from 0 to 100) shows the speculators are currently Bearish with a score of 30.1 percent. The commercials are Bullish with a score of 70.4 percent and the small traders (not shown in chart) are Bearish with a score of 25.8 percent.

SOYBEANS Futures StatisticsSPECULATORSCOMMERCIALSSMALL TRADERS
– Percent of Open Interest Longs:25.449.07.1
– Percent of Open Interest Shorts:8.961.111.5
– Net Position:104,096-76,491-27,605
– Gross Longs:160,083309,25645,031
– Gross Shorts:55,987385,74772,636
– Long to Short Ratio:2.9 to 10.8 to 10.6 to 1
NET POSITION TREND:
– Strength Index Score (3 Year Range Pct):30.170.425.8
– Strength Index Reading (3 Year Range):BearishBullishBearish
NET POSITION MOVEMENT INDEX:
– 6-Week Change in Strength Index:-25.118.716.5


SOYBEAN OIL Futures:

SOYBEAN OIL Futures COT ChartThe SOYBEAN OIL large speculator standing this week was a net position of -18,257 contracts in the data reported through Tuesday. This was a weekly decrease of -8,806 contracts from the previous week which had a total of -9,451 net contracts.

This week’s current strength score (the trader positioning range over the past three years, measured from 0 to 100) shows the speculators are currently Bearish-Extreme with a score of 0.0 percent. The commercials are Bullish-Extreme with a score of 100.0 percent and the small traders (not shown in chart) are Bearish-Extreme with a score of 0.0 percent.

SOYBEAN OIL Futures StatisticsSPECULATORSCOMMERCIALSSMALL TRADERS
– Percent of Open Interest Longs:15.759.86.3
– Percent of Open Interest Shorts:19.655.46.8
– Net Position:-18,25720,425-2,168
– Gross Longs:73,661280,73529,738
– Gross Shorts:91,918260,31031,906
– Long to Short Ratio:0.8 to 11.1 to 10.9 to 1
NET POSITION TREND:
– Strength Index Score (3 Year Range Pct):0.0100.00.0
– Strength Index Reading (3 Year Range):Bearish-ExtremeBullish-ExtremeBearish-Extreme
NET POSITION MOVEMENT INDEX:
– 6-Week Change in Strength Index:-12.011.6-7.0


SOYBEAN MEAL Futures:

SOYBEAN MEAL Futures COT ChartThe SOYBEAN MEAL large speculator standing this week was a net position of 111,252 contracts in the data reported through Tuesday. This was a weekly decline of -19,017 contracts from the previous week which had a total of 130,269 net contracts.

This week’s current strength score (the trader positioning range over the past three years, measured from 0 to 100) shows the speculators are currently Bullish with a score of 65.7 percent. The commercials are Bearish with a score of 36.4 percent and the small traders (not shown in chart) are Bearish-Extreme with a score of 16.5 percent.

SOYBEAN MEAL Futures StatisticsSPECULATORSCOMMERCIALSSMALL TRADERS
– Percent of Open Interest Longs:31.639.010.1
– Percent of Open Interest Shorts:6.367.86.6
– Net Position:111,252-126,82215,570
– Gross Longs:139,164171,92944,665
– Gross Shorts:27,912298,75129,095
– Long to Short Ratio:5.0 to 10.6 to 11.5 to 1
NET POSITION TREND:
– Strength Index Score (3 Year Range Pct):65.736.416.5
– Strength Index Reading (3 Year Range):BullishBearishBearish-Extreme
NET POSITION MOVEMENT INDEX:
– 6-Week Change in Strength Index:-24.225.9-13.9


LIVE CATTLE Futures:

LIVE CATTLE Futures COT ChartThe LIVE CATTLE large speculator standing this week was a net position of 102,034 contracts in the data reported through Tuesday. This was a weekly decline of -38 contracts from the previous week which had a total of 102,072 net contracts.

This week’s current strength score (the trader positioning range over the past three years, measured from 0 to 100) shows the speculators are currently Bullish-Extreme with a score of 92.5 percent. The commercials are Bearish-Extreme with a score of 9.1 percent and the small traders (not shown in chart) are Bearish with a score of 36.1 percent.

LIVE CATTLE Futures StatisticsSPECULATORSCOMMERCIALSSMALL TRADERS
– Percent of Open Interest Longs:44.925.39.7
– Percent of Open Interest Shorts:15.751.712.4
– Net Position:102,034-92,450-9,584
– Gross Longs:156,83888,28133,814
– Gross Shorts:54,804180,73143,398
– Long to Short Ratio:2.9 to 10.5 to 10.8 to 1
NET POSITION TREND:
– Strength Index Score (3 Year Range Pct):92.59.136.1
– Strength Index Reading (3 Year Range):Bullish-ExtremeBearish-ExtremeBearish
NET POSITION MOVEMENT INDEX:
– 6-Week Change in Strength Index:7.4-5.3-12.4


LEAN HOGS Futures:

LEAN HOGS Futures COT ChartThe LEAN HOGS large speculator standing this week was a net position of -27,022 contracts in the data reported through Tuesday. This was a weekly rise of 135 contracts from the previous week which had a total of -27,157 net contracts.

This week’s current strength score (the trader positioning range over the past three years, measured from 0 to 100) shows the speculators are currently Bearish-Extreme with a score of 0.1 percent. The commercials are Bullish-Extreme with a score of 100.0 percent and the small traders (not shown in chart) are Bullish-Extreme with a score of 98.3 percent.

LEAN HOGS Futures StatisticsSPECULATORSCOMMERCIALSSMALL TRADERS
– Percent of Open Interest Longs:26.637.312.4
– Percent of Open Interest Shorts:38.526.910.9
– Net Position:-27,02223,6863,336
– Gross Longs:60,38384,74228,143
– Gross Shorts:87,40561,05624,807
– Long to Short Ratio:0.7 to 11.4 to 11.1 to 1
NET POSITION TREND:
– Strength Index Score (3 Year Range Pct):0.1100.098.3
– Strength Index Reading (3 Year Range):Bearish-ExtremeBullish-ExtremeBullish-Extreme
NET POSITION MOVEMENT INDEX:
– 6-Week Change in Strength Index:-18.916.519.3


COTTON Futures:

COTTON Futures COT ChartThe COTTON large speculator standing this week was a net position of -5,413 contracts in the data reported through Tuesday. This was a weekly reduction of -9,883 contracts from the previous week which had a total of 4,470 net contracts.

This week’s current strength score (the trader positioning range over the past three years, measured from 0 to 100) shows the speculators are currently Bearish-Extreme with a score of 4.6 percent. The commercials are Bullish-Extreme with a score of 94.6 percent and the small traders (not shown in chart) are Bearish-Extreme with a score of 10.5 percent.

COTTON Futures StatisticsSPECULATORSCOMMERCIALSSMALL TRADERS
– Percent of Open Interest Longs:31.349.26.3
– Percent of Open Interest Shorts:34.545.46.9
– Net Position:-5,4136,321-908
– Gross Longs:52,62482,68010,665
– Gross Shorts:58,03776,35911,573
– Long to Short Ratio:0.9 to 11.1 to 10.9 to 1
NET POSITION TREND:
– Strength Index Score (3 Year Range Pct):4.694.610.5
– Strength Index Reading (3 Year Range):Bearish-ExtremeBullish-ExtremeBearish-Extreme
NET POSITION MOVEMENT INDEX:
– 6-Week Change in Strength Index:-2.01.43.2


COCOA Futures:

COCOA Futures COT ChartThe COCOA large speculator standing this week was a net position of 61,714 contracts in the data reported through Tuesday. This was a weekly lift of 2,359 contracts from the previous week which had a total of 59,355 net contracts.

This week’s current strength score (the trader positioning range over the past three years, measured from 0 to 100) shows the speculators are currently Bullish-Extreme with a score of 100.0 percent. The commercials are Bearish-Extreme with a score of 0.0 percent and the small traders (not shown in chart) are Bearish with a score of 41.9 percent.

COCOA Futures StatisticsSPECULATORSCOMMERCIALSSMALL TRADERS
– Percent of Open Interest Longs:42.231.14.7
– Percent of Open Interest Shorts:22.951.83.3
– Net Position:61,714-66,2514,537
– Gross Longs:135,29299,73015,048
– Gross Shorts:73,578165,98110,511
– Long to Short Ratio:1.8 to 10.6 to 11.4 to 1
NET POSITION TREND:
– Strength Index Score (3 Year Range Pct):100.00.041.9
– Strength Index Reading (3 Year Range):Bullish-ExtremeBearish-ExtremeBearish
NET POSITION MOVEMENT INDEX:
– 6-Week Change in Strength Index:37.7-38.24.4


WHEAT Futures:

WHEAT Futures COT ChartThe WHEAT large speculator standing this week was a net position of -83,188 contracts in the data reported through Tuesday. This was a weekly reduction of -12,652 contracts from the previous week which had a total of -70,536 net contracts.

This week’s current strength score (the trader positioning range over the past three years, measured from 0 to 100) shows the speculators are currently Bearish-Extreme with a score of 0.0 percent. The commercials are Bullish-Extreme with a score of 100.0 percent and the small traders (not shown in chart) are Bullish-Extreme with a score of 100.0 percent.

WHEAT Futures StatisticsSPECULATORSCOMMERCIALSSMALL TRADERS
– Percent of Open Interest Longs:27.837.711.8
– Percent of Open Interest Shorts:50.517.19.6
– Net Position:-83,18875,3697,819
– Gross Longs:101,941137,97743,119
– Gross Shorts:185,12962,60835,300
– Long to Short Ratio:0.6 to 12.2 to 11.2 to 1
NET POSITION TREND:
– Strength Index Score (3 Year Range Pct):0.0100.0100.0
– Strength Index Reading (3 Year Range):Bearish-ExtremeBullish-ExtremeBullish-Extreme
NET POSITION MOVEMENT INDEX:
– 6-Week Change in Strength Index:-13.89.326.0


Article By InvestMacroReceive our weekly COT Newsletter

*COT Report: The COT data, released weekly to the public each Friday, is updated through the most recent Tuesday (data is 3 days old) and shows a quick view of how large speculators or non-commercials (for-profit traders) were positioned in the futures markets.

The CFTC categorizes trader positions according to commercial hedgers (traders who use futures contracts for hedging as part of the business), non-commercials (large traders who speculate to realize trading profits) and nonreportable traders (usually small traders/speculators) as well as their open interest (contracts open in the market at time of reporting). See CFTC criteria here.

The Federal Reserve and the art of navigating a soft landing … when economic data sends mixed signals

By Christopher Decker, University of Nebraska Omaha 

With inflation easing and the U.S. economy cooling, is the Federal Reserve done raising interest rates? After all, gently bringing down the trajectory of prices without crashing the economy was the central bank’s objective when it began jacking up rates over a year ago.

Gross domestic product, the broadest measure of an economy’s output, expanded at an annual pace of a mere 1.1% in the first quarter, according to data released April 27, 2023 – down from 2.6% recorded in the final three months of 2022. And the latest consumer price data, from March, shows inflation slowing to 5% on an annualized basis, the least in about a year.

Unfortunately for consumers and businesses weary of soaring borrowing costs, the Fed’s not likely done hiking rates quite yet. Financial markets are predicting another quarter-point hike when the Fed meets for a two-day meeting that ends May 3, 2023. And there could be several more increases to come.

But this does raise another important question: With all the recent, often conflicting, data and narratives regarding inflation, bank failures and layoffs in the tech sector, is the Fed close to engineering the “soft landing” it’s been hoping for?

The economy zigs then zags

The GDP data is a mixed bag and provides some clues to the answer.

Overall, the recent GDP figures suggest a likely economic slowdown going forward, due largely to a drawdown in inventories – that is, rather than ordering new goods, companies are relying more on stuff currently in storage. Businesses seems more inclined to sell what is on hand rather than order up new products, likely in anticipation of a slowdown in consumption. And business investment declined 12.5% in the quarter.

At the same time, consumer spending, which represents about two-thirds of GDP, grew at a healthy 3.7% pace, and investment in equipment such as computers and robotics increased by 11.2% – though this category is quite volatile and could easily turn in subsequent quarters.

Other data also points to a slowdown, such as a decline in new orders for manufactured goods. This, combined with the drawdown in inventories in the GDP report, might suggest that businesses are anticipating a slowdown in demand for goods and services.

When we look at the labor market, while job increases have been strong – 334,000 over the past six months – job openings have been declining. After peaking at about 12 million in March 2022, openings dropped to about 9.9 million as of February, according to the Bureau of Labor Statistics.

Inflation: Is it high or low?

In terms of inflation, we can also see conflicting numbers.

The headline consumer price index has indeed slowed steadily since peaking in June 2022 at 9.1%. But the core preferred consumption index, the Fed’s favored measure of inflation, has remained stubbornly elevated. The latest data, released on April 28, 2023, showed the index, which excludes volatile food and energy prices, was up 4.6% in March from a year earlier and has barely budged in months.

Meanwhile, wages, which when rising can have a strong upward push on prices, climbed at an annualized 5.1% in the first quarter, also according to data released on April 28. That’s down from the peak of 5.7% in the second quarter of 2022 but is still about the fastest pace of wage gains in at least two decades.

More hikes to come

So what might all this suggest about Fed actions on interest rates?

The next meeting is scheduled to end on May 3, with the market odds greatly favoring another 0.25 percentage point increase – which would be the 10th straight hike since March 2022.

With the inflation rate still well above the Fed’s target of about 2%, combined with continued job growth and a low unemployment rate, the central bank is likely not done ratcheting up rates. I agree with the market odds pricing in a quarter-point hike for the May meeting. Future data will guide any future rate increases beyond that.

The good news is that, I believe, the larger rate increases are well in the past.

Landing softly – or at least mildly

That brings us back to the big question: How close is the Fed to sticking a soft landing, in which the U.S. economy manages to tame inflation without a recession?

Sadly, it’s too early to tell. Labor markets can be very volatile and political and international events – such as potential gridlock on debt ceiling talks or further escalations in the Ukraine War – can turn things upside down. That said, we are either looking at a mild recession or a growth recession.

What’s the difference? A growth recession signals a weak economy but not enough to significantly drive up unemployment – and that’s preferable to even a mild recession of multiple quarterly drops in GDP and much higher unemployment.

We just don’t know which is more likely. What I think is true now, though, is that, barring any catastrophic and unpredictable events, a severe recession has been avoided.The Conversation

About the Author:

Christopher Decker, Professor of Economics, University of Nebraska Omaha

This article is republished from The Conversation under a Creative Commons license. Read the original article.


Banking crises rooted in a system that rewards excessive risk-taking – as First Republic’s precarious situation shows

By Alexandra Digby, University of Rochester; Dollie Davis, Minerva Schools at KGI, and Robson Hiroshi Hatsukami Morgan, Minerva Schools at KGI 

First Republic Bank is on the brink of collapse, a victim of the panic that has roiled small and midsize banks since the failure of Silicon Valley Bank in March 2023.

Should First Republic fail, it would underscore how the impact of risky decisions at one bank can quickly spread into the broader financial system. It should also provide the impetus for policymakers and regulators to address a systemic problem that has plagued the banking industry from the savings and loan crisis of the 1980s to the financial crisis of 2008 to the recent turmoil following SVB’s demise: incentive structures that encourage excessive risk-taking.

The Federal Reserve’s top regulator seems to agree. On April 28, 2023, the central bank’s vice chair for supervision delivered a stinging report on the collapse of Silicon Valley Bank, blaming its failures on its weak risk management, as well as supervisory missteps.

We are professors of economics who study and teach the history of financial crises. In each of the financial upheavals since the 1980s, the common denominator was risk. Banks provided incentives that encouraged executives to take big risks to boost profits, with few consequences if their bets turned bad. In other words, all carrot and no stick.

One question we are grappling with now is what can be done to keep history from repeating itself and threatening the banking system, economy and jobs of everyday people.

S&L crisis sets the stage

The precursor to the banking crises of the 21st century was the savings and loan crisis of the 1980s.

The so-called S&L crisis, like the collapse of SVB, began in a rapidly changing interest rate environment. Savings and loan banks, also known as thrifts, provided home loans at attractive interest rates. When the Federal Reserve under Chairman Paul Volcker aggressively raised rates in the late 1970s to fight raging inflation, S&Ls were suddenly earning less on fixed-rate mortgages while having to pay higher interest to attract depositors. At one point, their losses topped US$100 billion.

To help the teetering banks, the federal government deregulated the thrift industry, allowing S&Ls to expand beyond home loans to commercial real estate. S&L executives were often paid based on the size of their institutions’ assets, and they aggressively lent to commercial real estate projects, taking on riskier loans to grow their loan portfolios quickly.

In the late 1980s, the commercial real estate boom turned bust. S&Ls, burdened by bad loans, failed in droves, requiring the federal government take over banks and delinquent commercial properties and sell the assets to recover money paid to insured depositors. Ultimately, the bailout cost taxpayers more than $100 billion.

Short-term incentives

The 2008 crisis is another obvious example of incentive structures that encourage risky strategies.

At all levels of mortgage financing – from Main Street lenders to Wall Street investment firms – executives prospered by taking excessive risks and passing them to someone else. Lenders passed mortgages made to people who could not afford them onto Wall Street firms, which in turn bundled those into securities to sell to investors. It all came crashing down when the housing bubble burst, followed by a wave of foreclosures.

Incentives rewarded short-term performance, and executives responded by taking bigger risks for immediate gains. At the Wall Street investment banks Bear Stearns and Lehman Brothers, profits grew as the firms bundled increasingly risky loans into mortgage-backed securities to sell, buy and hold.

As foreclosures spread, the value of these securities plummeted, and Bear Stearns collapsed in early 2008, providing the spark of the financial crisis. Lehman failed in September of that year, paralyzing the global financial system and plunging the U.S. economy into the worst recession since the Great Depression.

Executives at the banks, however, had already cashed in, and none were held accountable. Researchers at Harvard University estimated that top executive teams at Bear Stearns and Lehman pocketed a combined $2.4 billion in cash bonuses and stock sales from 2000 to 2008.

A familiar ring

That brings us back to Silicon Valley Bank.

Executives tied up the bank’s assets in long-term Treasury and mortgage-backed securities, failing to protect against rising interest rates that would undermine the value of these assets. The interest rate risk was particularly acute for SVB, since a large share of depositors were startups, whose finances depend on investors’ access to cheap money.

When the Fed began raising interest rates last year, SVB was doubly exposed. As startups’ fundraising slowed, they withdrew money, which required SVB to sell long-term holdings at a loss to cover the withdrawals. When the extent of SVB’s losses became known, depositors lost trust, spurring a run that ended with SVB’s collapse.

For executives, however, there was little downside in discounting or even ignoring the risk of rising rates. The cash bonus of SVB CEO Greg Becker more than doubled to $3 million in 2021 from $1.4 million in 2017, lifting his total earnings to $10 million, up 60% from four years earlier. Becker also sold nearly $30 million in stock over the past two years, including some $3.6 million in the days leading up to his bank’s failure.

The impact of the failure was not contained to SVB. Share prices of many midsize banks tumbled. Another American bank, Signature, collapsed days after SVB did.

First Republic survived after it was rescued by a consortium of major banks led by JPMorgan Chase, but the damage was already done. First Republic recently reported that depositors withdrew more than $100 billion in the six weeks following SVB’s collapse, and now it appears that it could soon fail too.

The crisis isn’t over yet. Banks had over $620 billion in unrealized losses at the end of 2022, largely due to rapidly rising interest rates.

The big picture

So, what’s to be done?

We believe the bipartisan bill recently filed in Congress, the Failed Bank Executives Clawback, would be a good start. In the event of a bank failure, the legislation would empower regulators to claw back compensation received by bank executives in the five-year period preceding the failure.

Clawbacks, however, kick in only after the fact. To prevent risky behavior, regulators could require executive compensation to prioritize long-term performance over short-term gains. And new rules could restrict the ability of bank executives to take the money and run, including requiring executives to hold substantial portions of their stock and options until they retire.

The Fed’s new report on what led to SVB’s failure points in this direction. The 102-page report recommends new limits on executive compensation, saying leaders “were not compensated to manage the bank’s risk,” as well as stronger stress-testing and higher liquidity requirements.

We believe these are also good steps, but probably not enough.

It comes down to this: Financial crises are less likely to happen if banks and bank executives consider the interest of the entire banking system, not just themselves, their institutions and shareholders.The Conversation

About the Authors:

Alexandra Digby, Adjunct Assistant professor of Economics, University of Rochester; Dollie Davis, Associate Dean of Faculty, Minerva Schools at KGI, and Robson Hiroshi Hatsukami Morgan, Assistant Professor of Social Sciences, Minerva Schools at KGI

This article is republished from The Conversation under a Creative Commons license. Read the original article.

Banks’ demand for emergency loans could signal more rate hikes

By George Prior 

US banks continuing to increase emergency loans from the Federal Reserve will hinder attempts to cool inflation, giving the central bank more reason to continue interest rate hikes.

This is the stark warning from Nigel Green, the CEO of deVere Group, one of the world’s largest independent financial advisory, asset management and fintech organizations, as new data shows that banks’ demand for loans from the Fed increased for the second consecutive week.

The US central bank now has provided more than $155.2 billion in loans to financial institutions through two backstop lending programs since the string of bank collapses in March.

The deVere chief executive says: “The $25 billion Bank Term Funding Program, which offers banks loans of up to one year, is surely going to turn out to be inflationary.

“It’s increasing the balance sheet of the Federal Reserve at a time when it’s supposedly intent on trying to reduce it.

“The emergency borrowing program is, essentially, another form of quantitative easing, which, as we know, adds to inflationary pressures.”

He continues: “The increase in demand for loans from financial institutions demonstrates ongoing stress in the US financial system, and this together with the inflationary consequences of the emergency program, are likely to give the Fed more reason to continue with its tightening campaign, despite weaker-than-expected GDP data, which has some investors betting that the central bank could soon wrap up its current agenda.”

Earlier this week, Nigel Green said in a statement that he expects the Federal Reserve will raise interest rates once again at its upcoming May meeting and that this is likely to cause jitters in the market as some investors, concerned about short-term profits, will move into panic-selling mode.

“Furthermore, they will have legitimate concerns that further rate hikes now – when monetary policy time lags are notoriously long – could steer economies into a recession.”

The time lag in monetary policies is very high. Economists estimate interest rate changes take up to 18 months to have the full effect. This means monetary policymakers need to try and predict the state of the economy for up to 18 months ahead.

Nigel Green concludes: “The latest data showing banks increasing their emergency borrowings will give the Fed more excuse to continue with their tightening next week.”

About:

deVere Group is one of the world’s largest independent advisors of specialist global financial solutions to international, local mass affluent, and high-net-worth clients.  It has a network of more than 70 offices across the world, over 80,000 clients and $12bn under advisement.

The cryptocurrency market digest (BTC). Overview for 28.04.2023

By RoboForex.com

Investors remained unperturbed by the disappointing publication of the US GDP statistics for Q1 2023. The economy increased by 1.1%, two times less than expected. Today will also be tense: personal income and spending reports for March are scheduled for publication alongside the Core PCE inflation component.

Technically, the market still craves for securing above 29,800 USD. If so, the target for purchases at 30,000 USD will become easy to reach. The next targets lie in the range between 34,000-35,000 USD.

The capitalisation of the crypto market has increased to 1.210 trillion USD. The BTC part skyrocketed to 47.2%, while the ETH share remained at 19.0%.

California introduces a digital wallet for state services

Santa Cruz County (North California) reported the implementation of a blockchain-based digital wallet to be used in the frame of state services. Primarily, the system is used for digitalising paper documents, appointments, and services.

Google Cloud cooperates with Polygon

The Google Cloud platform signed an agreement with Polygon. This alliance can speed up the implementation of the key Polygon protocols into the corporate infrastructure and instruments.

CryptoSpotty was bought for 18 thousand USD

Primary sales of the CryptoSpotty token as a part of VKontakte NFT collection took just an hour to start and amounted to 18 thousand USD. 8 thousand NFTs were issued, featuring Spotty, the dog symbol of the social medium.

Article By RoboForex.com

Attention!
Forecasts presented in this section only reflect the author’s private opinion and should not be considered as guidance for trading. RoboForex LP bears no responsibility for trading results based on trading recommendations described in these analytical reviews.
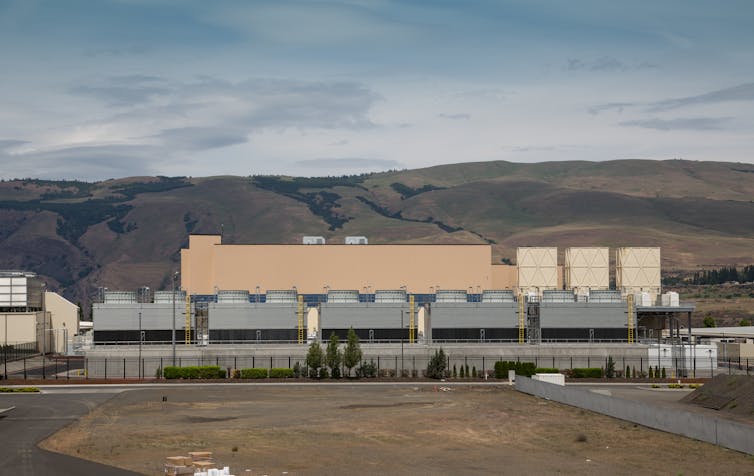
The Bank of Japan maintained all monetary policy settings. META boosted the tech sector

By JustMarkets

The Nasdaq Technology Index led a rally on Wall Street Thursday as a strong report from parent company Facebook (META) outweighed concerns about slowing US economic growth. As the stock market closed yesterday, the Dow Jones Index (US30) increased by 1.57%, and the S&P 500 Index (US500) added 1.96%. The NASDAQ Technology Index (US100) jumped by 2.43%.

Meta stock soared more than 13% yesterday, hitting its highest in more than a year after the company reported quarterly earnings above estimates and CEO Mark Zuckerberg said artificial intelligence is driving traffic to Facebook and Instagram and boosting ad sales. First-quarter earnings expectations have improved sharply, with analysts forecasting a 2.4% year-over-year drop in S&P 500 companies’ earnings, compared with a 5.1% decline forecast at the start of the reporting season.

The US economic growth slowed more than expected in the first quarter of 2023. GDP data for the quarter showed growth of 1.1% compared to the forecast of 2.0%. The slowdown in GDP growth largely reflected weak inventory investment. Housing investment recorded its eighth consecutive quarterly decline, although the rate of decline slowed considerably from October through December. But the labor market remains resilient. Jobless claims came in at 230,000, less than the projected 247,000.

Equity markets in Europe were mostly up on Thursday. German DAX (DE30) gained 0.03%, French CAC 40 (FR40) added 0.23%, Spanish IBEX 35 (ES35) increased by 0.16%, and British FTSE 100 (UK100) closed yesterday down by 0.27%.

The ECB meeting will be held next week, and the main question is which rate hike the Central Bank of Europe will choose. At the moment, analysts are leaning towards 0.25%. However, it is worth realizing that the probability may change due to the new incoming data. A number of GDP and inflation statistics will be released in Europe today, and the Eurozone core inflation report will be released two days before the meeting next week. Any signs of solid inflation, especially the core indicator, will raise the odds of a 0.5% rate hike at the May meeting.

European commercial real estate investment has fallen to its lowest level in 11 years. Higher interest rates and the economic outlook spook investors. A recent JP Morgan investor survey cited commercial real estate as the most likely cause of the next financial crisis.

Oil prices stabilized Thursday, offsetting some losses from the previous session after OPEC+ indicated it saw no need to cut production further.

Asian markets were also mostly on the rise yesterday. Japan’s Nikkei 225 (JP225) gained 0.15%, China’s FTSE China A50 (CHA50) increased by 1.09%, Hong Kong’s Hang Seng (HK50) gained 0.42%, India’s NIFTY 50 (IND50) added 0.57%, and Australia’s S&P/ASX 200 (AU200) closed negative 0.32%.

Argentina is planning a sharp rate hike to 91% to stop the peso’s decline. Since Argentina’s inflation rate is above 100%, its Central Bank raised its rate last week by 300 basis points to 81%. Argentina, a major global supplier of grain and beef, is struggling with inflation, which topped 104% in March, with analysts predicting that prices will rise about 110-130% this year.

The Chinese yuan is slowly but surely being accepted for more international payments, which analysts say could set the stage for a trading system that runs parallel to the dominant US dollar. In March, there were more cross-border transactions with China in yuan than in dollars, and Argentina said it aims to pay for Chinese goods in yuan rather than dollars regularly.

The Bank of Japan left the interest rate unchanged and also did not change its yield curve control policy and is considering a comprehensive review of past monetary policy easing decisions. The policy report indicates that the abrupt move to roll back quantitative easing could create huge problems for Japan’s regional banks and exacerbate global market conditions. Tokyo’s consumer price index inflation rose more than expected in April, returning to 40-year highs. On an annualized basis, the core CPI rose to 3.5% from 3.2%. Japan’s unemployment rate rose from 2.6% to 2.8%.

S&P 500 (F) (US500) 4,135.35 +79.36 (+1.96%)

Dow Jones (US30)33,826.16 +524.29 (+1.57%)

DAX (DE40) 15,800.45 +4.72 (+0.03%)

FTSE 100 (UK100) 7,831.58 −21.06 (−0.27%)

USD Index 101.52 +0.05 +0.05%

Important events for today:
  • – Japan Tokyo Core CPI (m/m) at 02:30 (GMT+3);
  • – Japan Unemployment Rate (m/m) at 02:30 (GMT+3);
  • – Japan Industrial Production (m/m) at 02:50 (GMT+3);
  • – Japan Retail Sales (m/m) at 02:50 (GMT+3);
  • – Australia Producer Price Index (q/q) at 04:30 (GMT+3);
  • – Japan BoJ Monetary Policy Statement at 06:00 (GMT+3);
  • – Japan BoJ Interest Rate Decision at 06:00 (GMT+3);
  • – Japan BoJ Outlook Report at 06:00 (GMT+3);
  • – Japan BoJ Press Conference at 08:00 (GMT+3);
  • – French GDP (q/q) at 08:30 (GMT+3);
  • – French Consumer Price Index (m/m) at 09:45 (GMT+3);
  • – Spanish GDP (q/q) at 10:00 (GMT+3);
  • – Spanish Consumer Price Index (m/m) at 10:00 (GMT+3);
  • – German Unemployment Rate (m/m) at 10:55 (GMT+3);
  • – German GDP (q/q) at 11:00 (GMT+3);
  • – Switzerland SNB Chairman Thomas Jordan speaks at 11:00 (GMT+3);
  • – Eurozone GDP (q/q) at 11:00 (GMT+3);
  • – German Consumer Price Index (m/m) at 15:00 (GMT+3);
  • – US PCE Price Index (m/m) at 15:30 (GMT+3);
  • – Canada GDP (q/q) at 15:30 (GMT+3);
  • – US Michigan Consumer Sentiment (m/m) at 17:00 (GMT+3).

By JustMarkets


This article reflects a personal opinion and should not be interpreted as an investment advice, and/or offer, and/or a persistent request for carrying out financial transactions, and/or a guarantee, and/or a forecast of future events.