By InvestMacro

Here are the latest charts and statistics for the Commitment of Traders (COT) data published by the Commodities Futures Trading Commission (CFTC).
The latest COT data is updated through Tuesday August 8th and shows a quick view of how large market participants (for-profit speculators and commercial traders) were positioned in the futures markets. All currency positions are in direct relation to the US dollar where, for example, a bet for the euro is a bet that the euro will rise versus the dollar while a bet against the euro will be a bet that the euro will decline versus the dollar.
Weekly Speculator Changes led by Australian Dollar & Swiss Franc
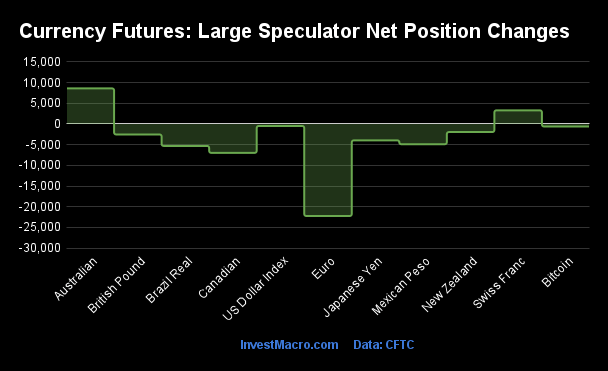
The COT currency market speculator bets were lower this week as just two out of the eleven currency markets we cover had higher positioning while the other nine markets had lower speculator contracts.
Leading the gains for the currency markets was the Australian Dollar (8,600 contracts) with the Swiss Franc (3,295 contracts) also showing a positive week.
The currencies seeing declines in speculator bets on the week were the EuroFX (-22,251 contracts) with the Canadian Dollar (-6,988 contracts), the Brazilian Real (-5,312 contracts), the Mexican Peso (-4,897 contracts), the Japanese Yen (-3,964 contracts), the British Pound (-2,542 contracts), the New Zealand Dollar (-1,954 contracts), Bitcoin (-610 contracts) and the US Dollar Index (-491 contracts) also registering lower bets on the week.
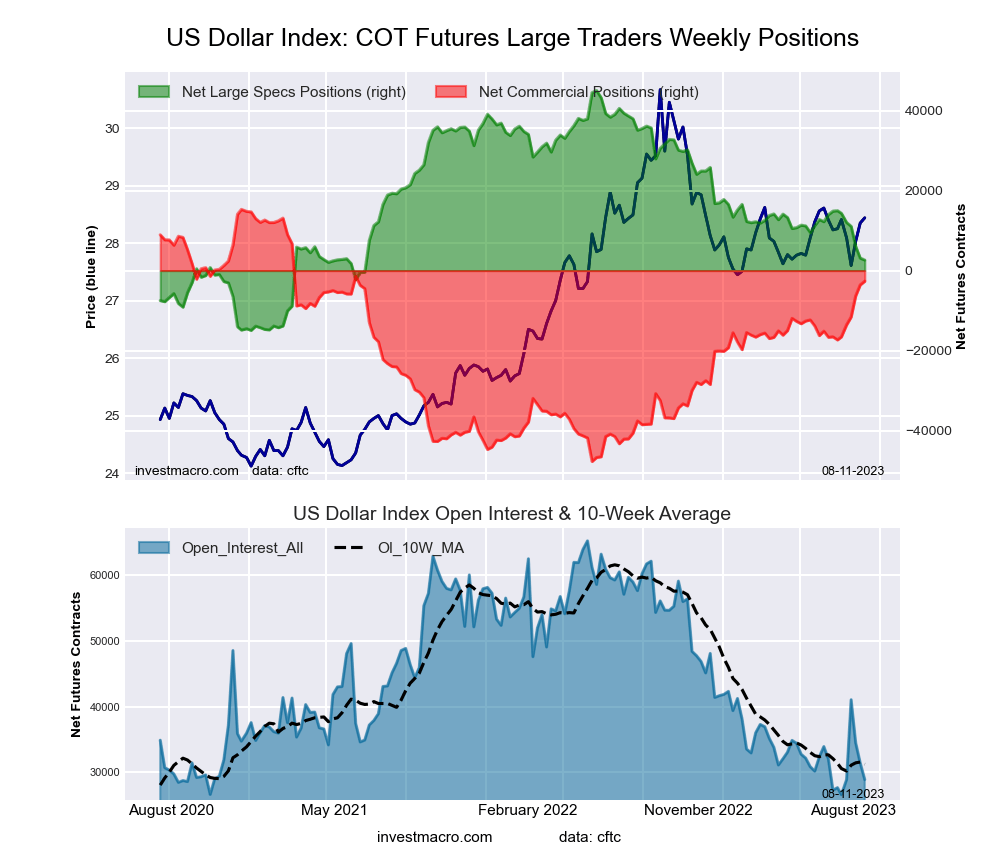
US Dollar Index Bullish Bets drop for 6th straight week to new 2-year low
Highlighting the COT currency’s data this week is the continued decreasing nature of the speculator’s positioning in the US Dollar Index.
The large speculative US Dollar Index positions fell for a sixth straight week this week with the speculator position now declining by a total of -12,344 contracts over this last six-week span.
This bearishness has brought the US Dollar Index speculator net position (currently at just a total of +2,624 contracts) to a new 110-week low, dating back to June 29th of 2021 when the speculator’s net position was last in negative territory at a total of -448 contracts.
Despite the speculator’s pessimism in the US Dollar Index contracts, the futures price has been on the rise for a fourth consecutive week. The USD futures price advanced by approximately 1 percent this week with a Friday close right around the 102.70 level, it’s highest close level since June. The USD Index futures had fallen to a price of 99.22 on July 18th before rebounding and starting back on it’s current trend higher.
| Aug-08-2023 | OI | OI-Index | Spec-Net | Spec-Index | Com-Net | COM-Index | Smalls-Net | Smalls-Index |
|---|
| USD Index | 28,930 | 6 | 2,624 | 29 | -2,678 | 71 | 54 | 16 |
| EUR | 760,968 | 69 | 149,811 | 76 | -195,450 | 24 | 45,639 | 52 |
| GBP | 206,954 | 41 | 47,020 | 88 | -57,879 | 13 | 10,859 | 79 |
| JPY | 229,849 | 62 | -83,180 | 21 | 89,121 | 79 | -5,941 | 41 |
| CHF | 43,122 | 46 | -5,452 | 42 | 4,092 | 51 | 1,360 | 62 |
| CAD | 140,960 | 20 | -623 | 54 | -4,617 | 53 | 5,240 | 34 |
| AUD | 182,842 | 67 | -43,192 | 45 | 55,845 | 61 | -12,653 | 22 |
| NZD | 40,986 | 37 | -368 | 53 | 1,454 | 50 | -1,086 | 37 |
| MXN | 227,745 | 47 | 83,651 | 90 | -86,640 | 10 | 2,989 | 30 |
| RUB | 20,930 | 4 | 7,543 | 31 | -7,150 | 69 | -393 | 24 |
| BRL | 45,709 | 33 | 28,039 | 71 | -27,269 | 31 | -770 | 38 |
| Bitcoin | 16,743 | 83 | -1,149 | 57 | 456 | 0 | 693 | 29 |
Strength Scores led by Mexican Peso & British Pound
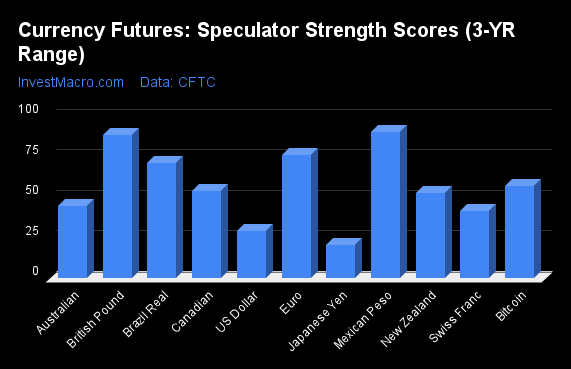
COT Strength Scores (a normalized measure of Speculator positions over a 3-Year range, from 0 to 100 where above 80 is Extreme-Bullish and below 20 is Extreme-Bearish) showed that the Mexican Peso (90 percent) and the British Pound (88 percent) lead the currency markets this week and are in Extreme-Bullish levels. The EuroFX (76 percent), Brazilian Real (71 percent) and the Bitcoin (57 percent) come in as the next highest in the weekly strength scores.
On the downside, the Japanese Yen (21 percent) and the US Dollar Index (29 percent) come in at the lowest strength levels currently. The next lowest strength scores are the Swiss Franc (42 percent) and the Australian Dollar (45 percent).
Strength Statistics:
US Dollar Index (29.3 percent) vs US Dollar Index previous week (30.1 percent)
EuroFX (76.1 percent) vs EuroFX previous week (84.7 percent)
British Pound Sterling (88.4 percent) vs British Pound Sterling previous week (90.2 percent)
Japanese Yen (20.6 percent) vs Japanese Yen previous week (23.0 percent)
Swiss Franc (41.6 percent) vs Swiss Franc previous week (32.5 percent)
Canadian Dollar (54.0 percent) vs Canadian Dollar previous week (60.5 percent)
Australian Dollar (44.8 percent) vs Australian Dollar previous week (36.8 percent)
New Zealand Dollar (52.6 percent) vs New Zealand Dollar previous week (57.9 percent)
Mexican Peso (90.2 percent) vs Mexican Peso previous week (93.2 percent)
Brazilian Real (71.4 percent) vs Brazilian Real previous week (78.2 percent)
Bitcoin (56.9 percent) vs Bitcoin previous week (67.5 percent)
Japanese Yen & Bitcoin top the 6-Week Strength Trends
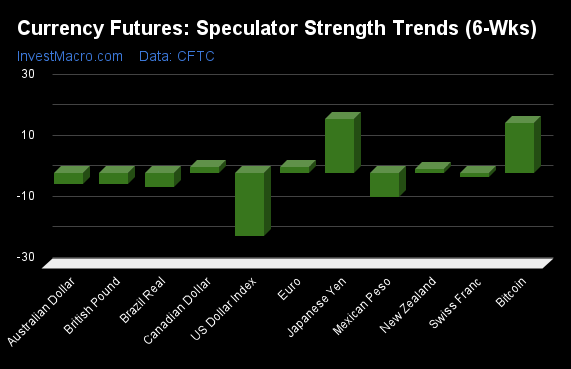
COT Strength Score Trends (or move index, calculates the 6-week changes in strength scores) showed that the Japanese Yen (18 percent) and the Bitcoin (16 percent) lead the past six weeks trends for the currencies. The EuroFX (2 percent) and the Canadian Dollar (2 percent) are the next highest positive movers in the latest trends data.
The US Dollar Index (-21 percent) leads the downside trend scores currently with the Mexican Peso (-8 percent), Brazilian Real (-5 percent) and the Australian Dollar (-3 percent) following next with lower trend scores.
Strength Trend Statistics:
US Dollar Index (-20.6 percent) vs US Dollar Index previous week (-19.6 percent)
EuroFX (1.8 percent) vs EuroFX previous week (10.6 percent)
British Pound Sterling (-3.5 percent) vs British Pound Sterling previous week (2.0 percent)
Japanese Yen (17.6 percent) vs Japanese Yen previous week (16.9 percent)
Swiss Franc (-1.4 percent) vs Swiss Franc previous week (-10.7 percent)
Canadian Dollar (2.1 percent) vs Canadian Dollar previous week (37.2 percent)
Australian Dollar (-3.5 percent) vs Australian Dollar previous week (-2.0 percent)
New Zealand Dollar (1.3 percent) vs New Zealand Dollar previous week (11.5 percent)
Mexican Peso (-7.8 percent) vs Mexican Peso previous week (-6.8 percent)
Brazilian Real (-4.5 percent) vs Brazilian Real previous week (9.5 percent)
Bitcoin (16.5 percent) vs Bitcoin previous week (-16.3 percent)
Individual COT Forex Markets:
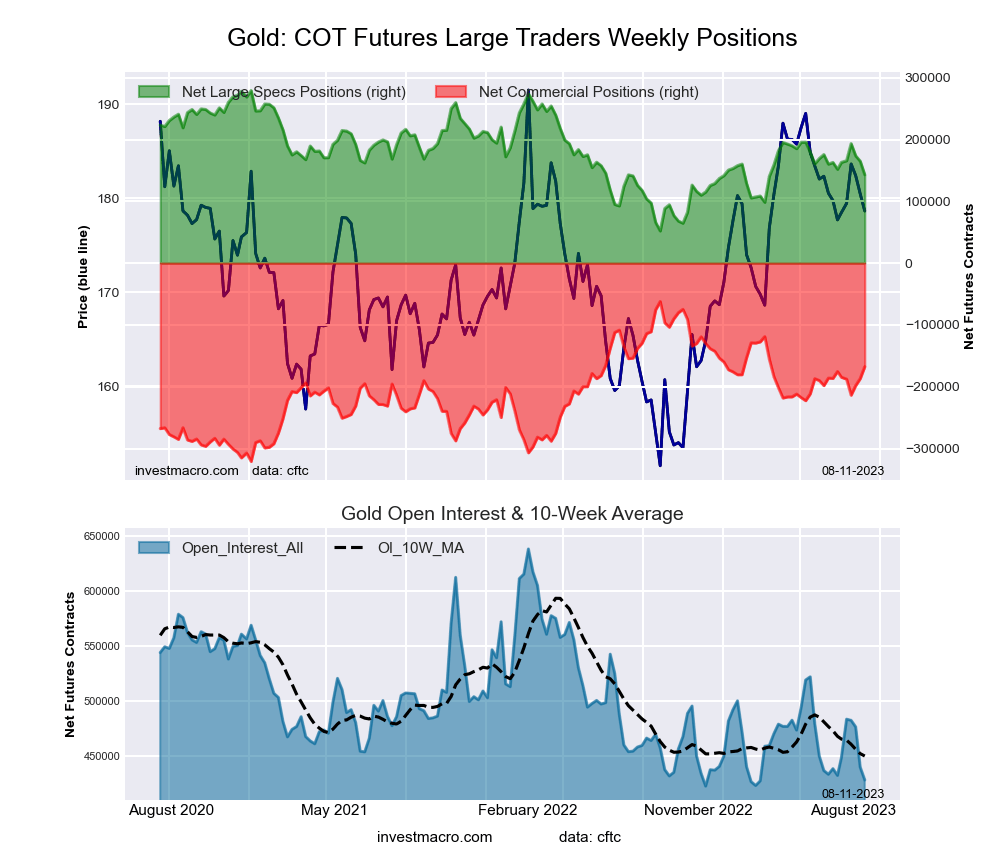
US Dollar Index Futures:
 The US Dollar Index large speculator standing this week recorded a net position of 2,624 contracts in the data reported through Tuesday. This was a weekly decrease of -491 contracts from the previous week which had a total of 3,115 net contracts.
This week’s current strength score (the trader positioning range over the past three years, measured from 0 to 100) shows the speculators are currently Bearish with a score of 29.3 percent. The commercials are Bullish with a score of 71.5 percent and the small traders (not shown in chart) are Bearish-Extreme with a score of 16.4 percent.
Price Trend-Following Model: New Uptrend
Our weekly trend-following model classifies the current market price position as: New Uptrend. The current action for the model is considered to be: Hold – Maintain Long Position.
| US DOLLAR INDEX Statistics | SPECULATORS | COMMERCIALS | SMALL TRADERS |
| – Percent of Open Interest Longs: | 59.6 | 22.1 | 11.3 |
| – Percent of Open Interest Shorts: | 50.5 | 31.4 | 11.2 |
| – Net Position: | 2,624 | -2,678 | 54 |
| – Gross Longs: | 17,247 | 6,395 | 3,283 |
| – Gross Shorts: | 14,623 | 9,073 | 3,229 |
| – Long to Short Ratio: | 1.2 to 1 | 0.7 to 1 | 1.0 to 1 |
| NET POSITION TREND: | | | |
| – Strength Index Score (3 Year Range Pct): | 29.3 | 71.5 | 16.4 |
| – Strength Index Reading (3 Year Range): | Bearish | Bullish | Bearish-Extreme |
| NET POSITION MOVEMENT INDEX: | | | |
| – 6-Week Change in Strength Index: | -20.6 | 23.3 | -25.7 |
Euro Currency Futures:
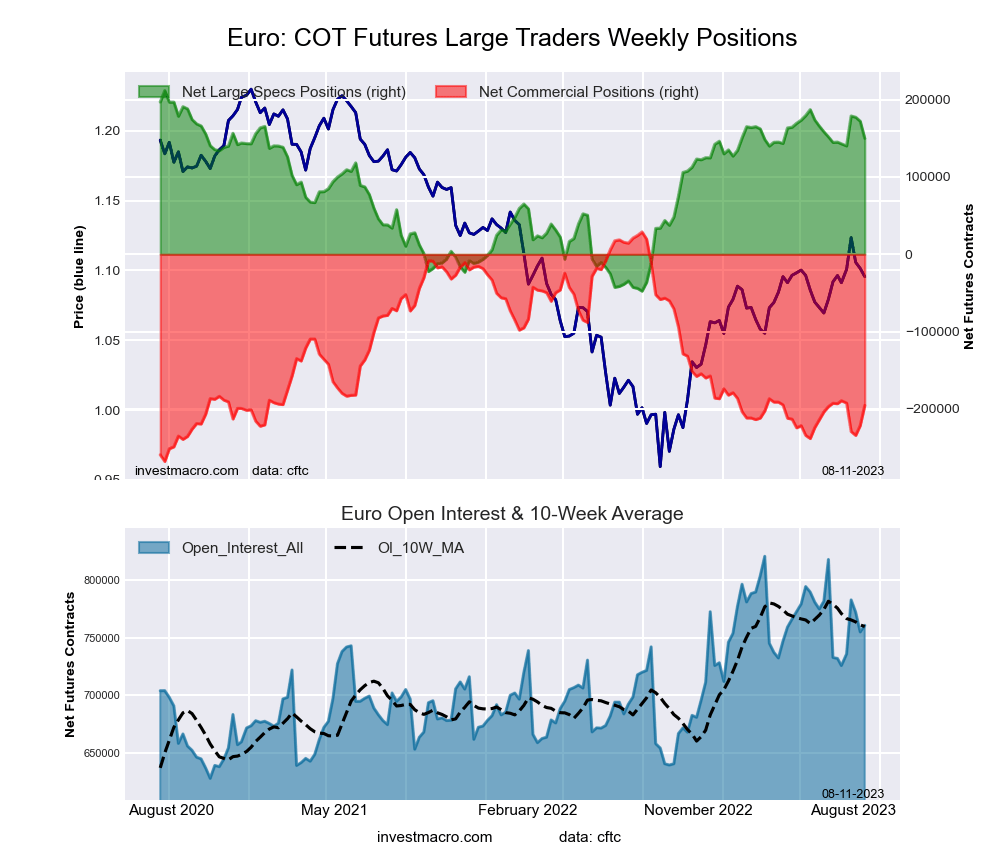 The Euro Currency large speculator standing this week recorded a net position of 149,811 contracts in the data reported through Tuesday. This was a weekly drop of -22,251 contracts from the previous week which had a total of 172,062 net contracts.
This week’s current strength score (the trader positioning range over the past three years, measured from 0 to 100) shows the speculators are currently Bullish with a score of 76.1 percent. The commercials are Bearish with a score of 24.4 percent and the small traders (not shown in chart) are Bullish with a score of 51.8 percent.
Price Trend-Following Model: Uptrend
Our weekly trend-following model classifies the current market price position as: Uptrend. The current action for the model is considered to be: Hold – Maintain Long Position.
| EURO Currency Statistics | SPECULATORS | COMMERCIALS | SMALL TRADERS |
| – Percent of Open Interest Longs: | 30.0 | 56.0 | 12.1 |
| – Percent of Open Interest Shorts: | 10.3 | 81.6 | 6.1 |
| – Net Position: | 149,811 | -195,450 | 45,639 |
| – Gross Longs: | 228,048 | 425,875 | 92,240 |
| – Gross Shorts: | 78,237 | 621,325 | 46,601 |
| – Long to Short Ratio: | 2.9 to 1 | 0.7 to 1 | 2.0 to 1 |
| NET POSITION TREND: | | | |
| – Strength Index Score (3 Year Range Pct): | 76.1 | 24.4 | 51.8 |
| – Strength Index Reading (3 Year Range): | Bullish | Bearish | Bullish |
| NET POSITION MOVEMENT INDEX: | | | |
| – 6-Week Change in Strength Index: | 1.8 | -0.7 | -4.1 |
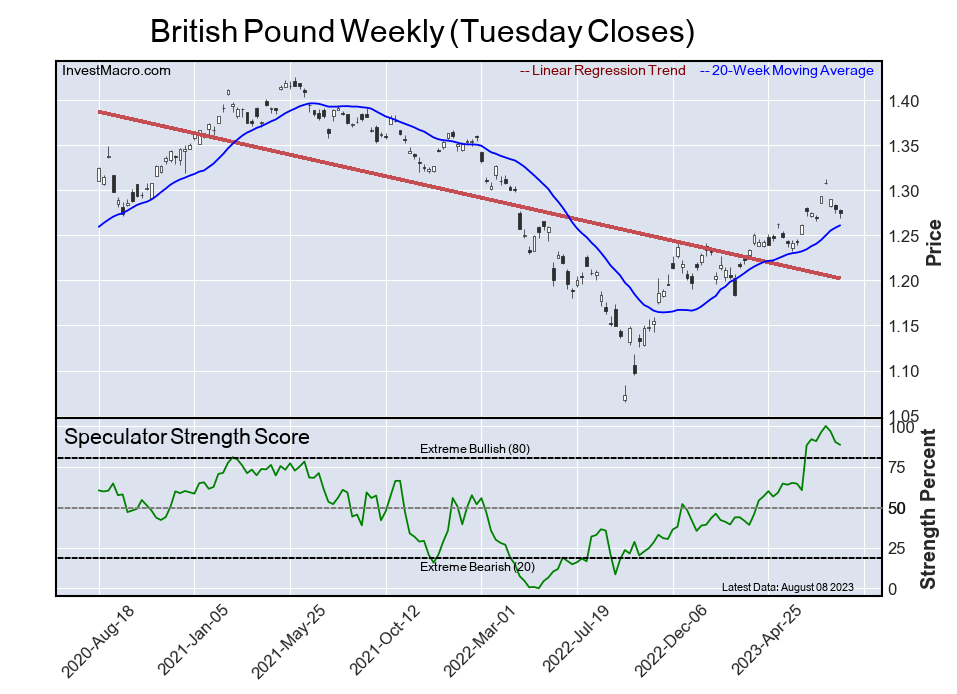
British Pound Sterling Futures:
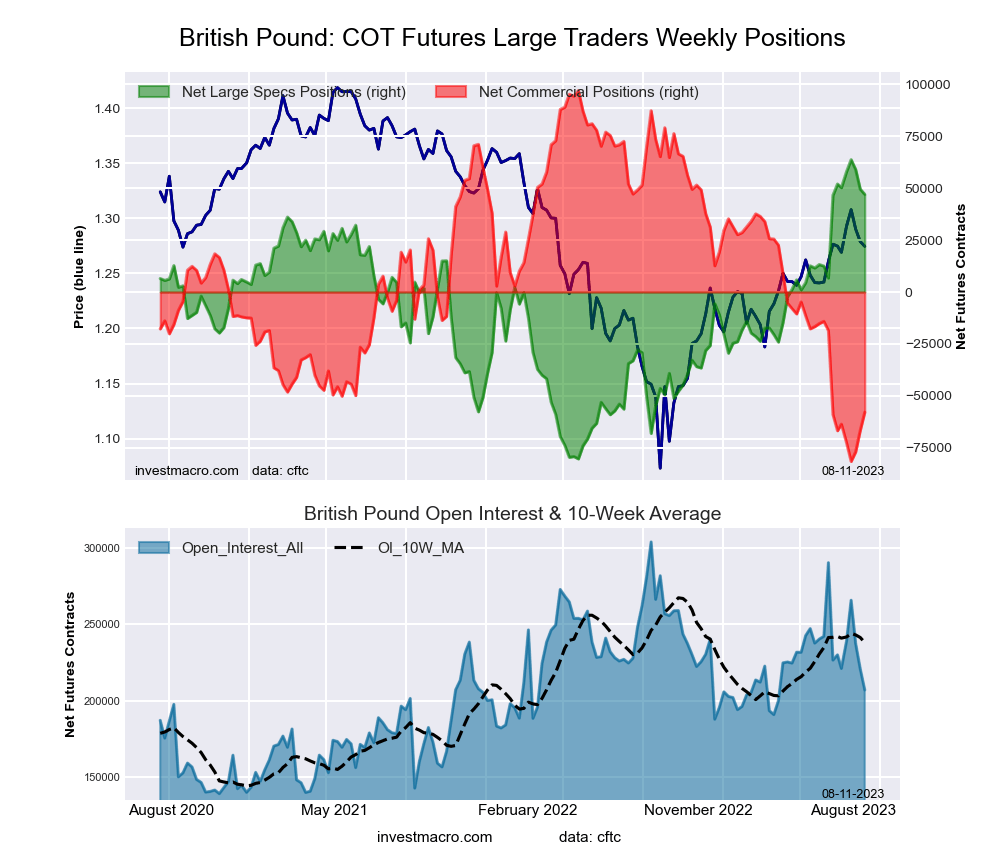 The British Pound Sterling large speculator standing this week recorded a net position of 47,020 contracts in the data reported through Tuesday. This was a weekly lowering of -2,542 contracts from the previous week which had a total of 49,562 net contracts.
This week’s current strength score (the trader positioning range over the past three years, measured from 0 to 100) shows the speculators are currently Bullish-Extreme with a score of 88.4 percent. The commercials are Bearish-Extreme with a score of 13.3 percent and the small traders (not shown in chart) are Bullish with a score of 79.3 percent.
Price Trend-Following Model: Uptrend
Our weekly trend-following model classifies the current market price position as: Uptrend. The current action for the model is considered to be: Hold – Maintain Long Position.
| BRITISH POUND Statistics | SPECULATORS | COMMERCIALS | SMALL TRADERS |
| – Percent of Open Interest Longs: | 40.2 | 36.7 | 16.7 |
| – Percent of Open Interest Shorts: | 17.5 | 64.7 | 11.4 |
| – Net Position: | 47,020 | -57,879 | 10,859 |
| – Gross Longs: | 83,239 | 75,990 | 34,505 |
| – Gross Shorts: | 36,219 | 133,869 | 23,646 |
| – Long to Short Ratio: | 2.3 to 1 | 0.6 to 1 | 1.5 to 1 |
| NET POSITION TREND: | | | |
| – Strength Index Score (3 Year Range Pct): | 88.4 | 13.3 | 79.3 |
| – Strength Index Reading (3 Year Range): | Bullish-Extreme | Bearish-Extreme | Bullish |
| NET POSITION MOVEMENT INDEX: | | | |
| – 6-Week Change in Strength Index: | -3.5 | 5.0 | -7.7 |
Japanese Yen Futures:
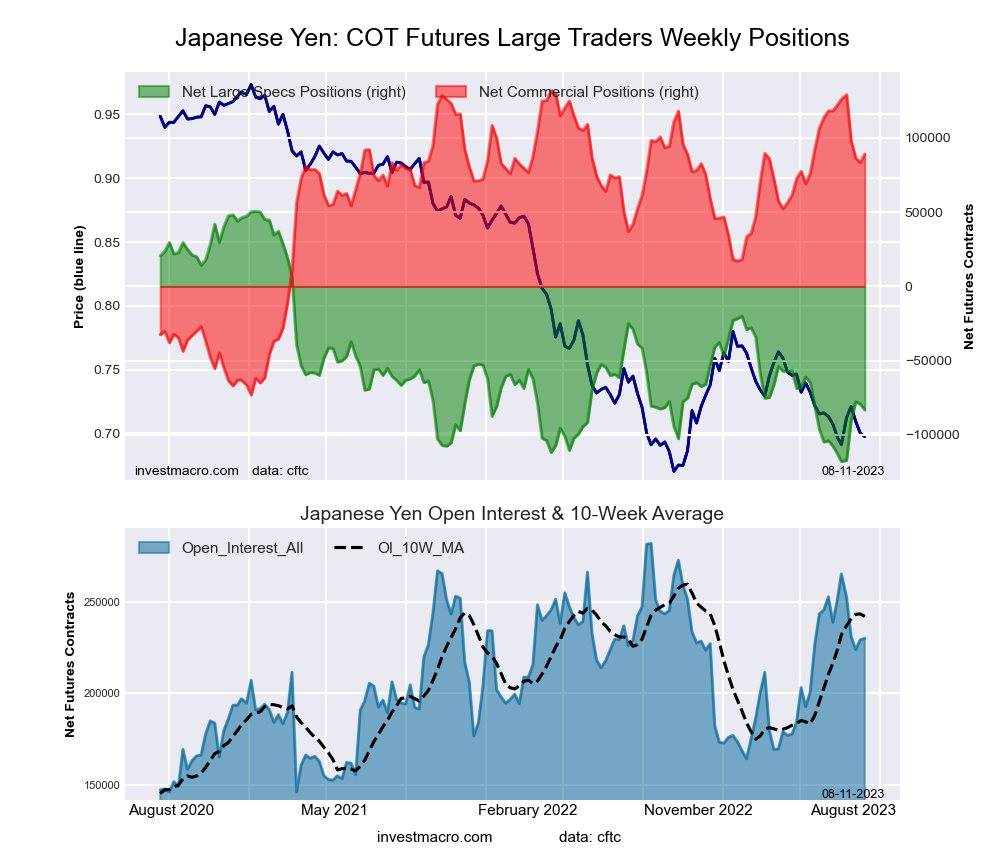 The Japanese Yen large speculator standing this week recorded a net position of -83,180 contracts in the data reported through Tuesday. This was a weekly decrease of -3,964 contracts from the previous week which had a total of -79,216 net contracts.
This week’s current strength score (the trader positioning range over the past three years, measured from 0 to 100) shows the speculators are currently Bearish with a score of 20.6 percent. The commercials are Bullish with a score of 79.1 percent and the small traders (not shown in chart) are Bearish with a score of 41.4 percent.
Price Trend-Following Model: Strong Downtrend
Our weekly trend-following model classifies the current market price position as: Strong Downtrend. The current action for the model is considered to be: Hold – Maintain Short Position.
| JAPANESE YEN Statistics | SPECULATORS | COMMERCIALS | SMALL TRADERS |
| – Percent of Open Interest Longs: | 10.1 | 73.8 | 14.5 |
| – Percent of Open Interest Shorts: | 46.3 | 35.0 | 17.1 |
| – Net Position: | -83,180 | 89,121 | -5,941 |
| – Gross Longs: | 23,135 | 169,528 | 33,411 |
| – Gross Shorts: | 106,315 | 80,407 | 39,352 |
| – Long to Short Ratio: | 0.2 to 1 | 2.1 to 1 | 0.8 to 1 |
| NET POSITION TREND: | | | |
| – Strength Index Score (3 Year Range Pct): | 20.6 | 79.1 | 41.4 |
| – Strength Index Reading (3 Year Range): | Bearish | Bullish | Bearish |
| NET POSITION MOVEMENT INDEX: | | | |
| – 6-Week Change in Strength Index: | 17.6 | -16.2 | 7.2 |
Swiss Franc Futures:
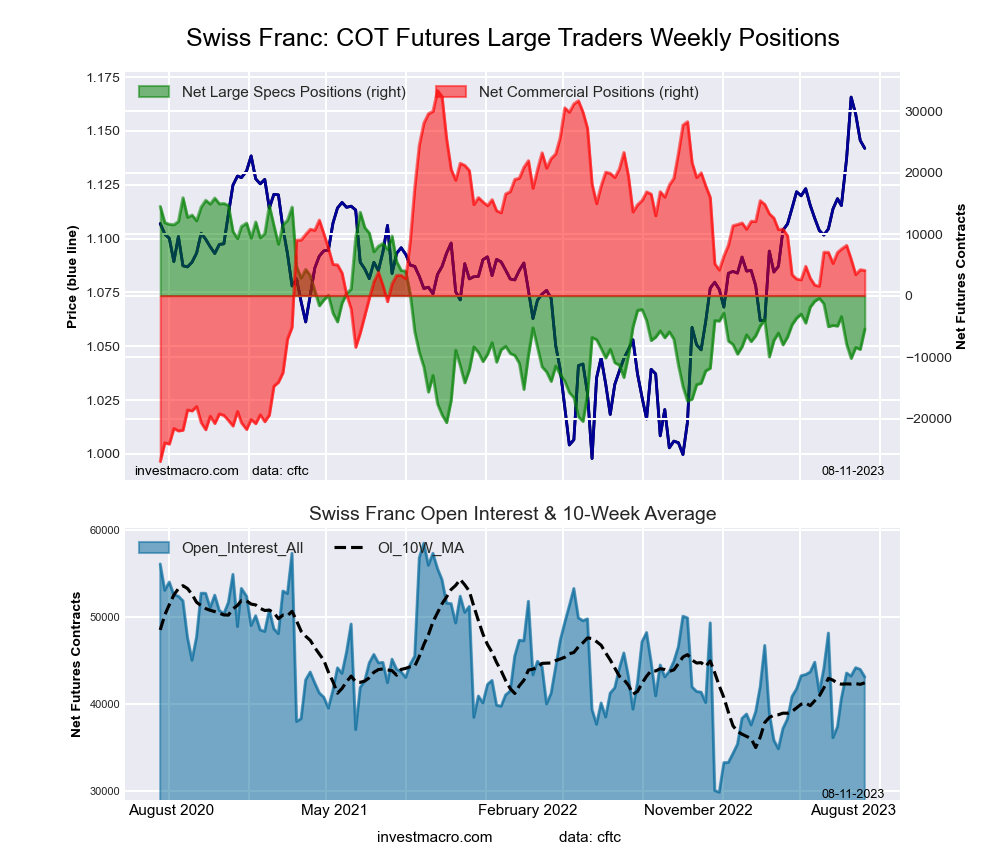 The Swiss Franc large speculator standing this week recorded a net position of -5,452 contracts in the data reported through Tuesday. This was a weekly increase of 3,295 contracts from the previous week which had a total of -8,747 net contracts.
This week’s current strength score (the trader positioning range over the past three years, measured from 0 to 100) shows the speculators are currently Bearish with a score of 41.6 percent. The commercials are Bullish with a score of 51.5 percent and the small traders (not shown in chart) are Bullish with a score of 62.1 percent.
Price Trend-Following Model: Uptrend
Our weekly trend-following model classifies the current market price position as: Uptrend. The current action for the model is considered to be: Hold – Maintain Long Position.
| SWISS FRANC Statistics | SPECULATORS | COMMERCIALS | SMALL TRADERS |
| – Percent of Open Interest Longs: | 19.7 | 44.0 | 35.4 |
| – Percent of Open Interest Shorts: | 32.4 | 34.6 | 32.2 |
| – Net Position: | -5,452 | 4,092 | 1,360 |
| – Gross Longs: | 8,509 | 18,991 | 15,265 |
| – Gross Shorts: | 13,961 | 14,899 | 13,905 |
| – Long to Short Ratio: | 0.6 to 1 | 1.3 to 1 | 1.1 to 1 |
| NET POSITION TREND: | | | |
| – Strength Index Score (3 Year Range Pct): | 41.6 | 51.5 | 62.1 |
| – Strength Index Reading (3 Year Range): | Bearish | Bullish | Bullish |
| NET POSITION MOVEMENT INDEX: | | | |
| – 6-Week Change in Strength Index: | -1.4 | -4.8 | 11.6 |
Canadian Dollar Futures:
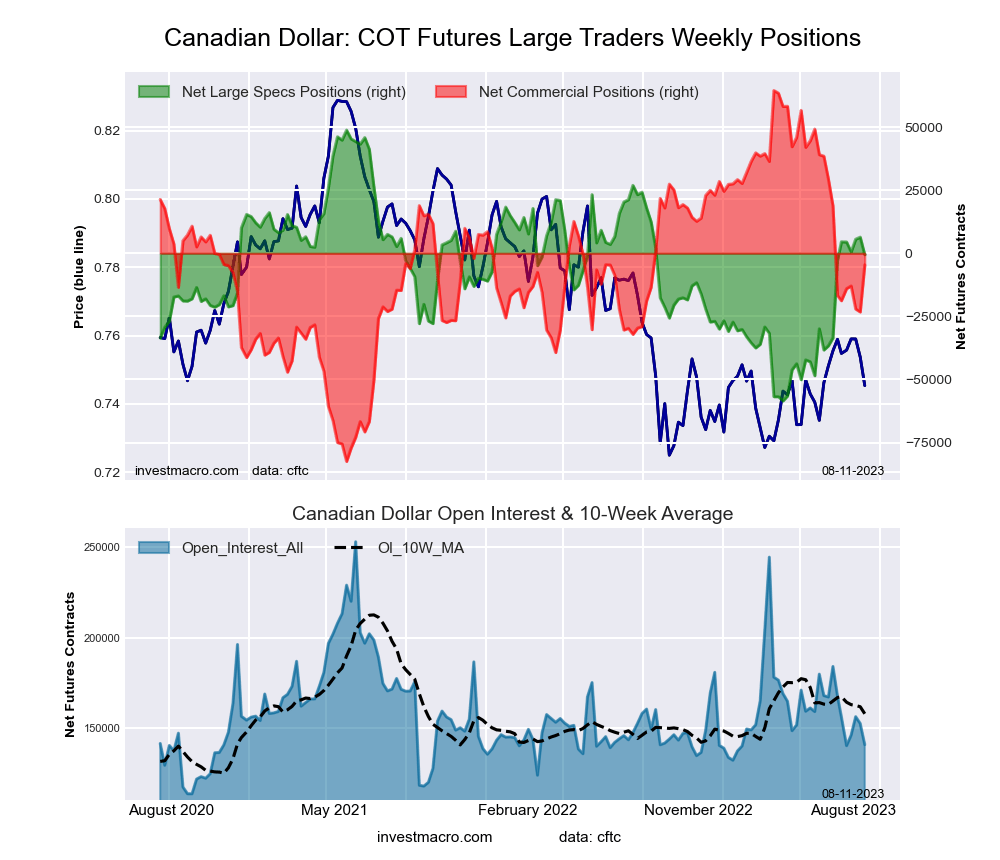 The Canadian Dollar large speculator standing this week recorded a net position of -623 contracts in the data reported through Tuesday. This was a weekly decline of -6,988 contracts from the previous week which had a total of 6,365 net contracts.
This week’s current strength score (the trader positioning range over the past three years, measured from 0 to 100) shows the speculators are currently Bullish with a score of 54.0 percent. The commercials are Bullish with a score of 53.0 percent and the small traders (not shown in chart) are Bearish with a score of 34.4 percent.
Price Trend-Following Model: Weak Uptrend
Our weekly trend-following model classifies the current market price position as: Weak Uptrend. The current action for the model is considered to be: Hold – Maintain Long Position.
| CANADIAN DOLLAR Statistics | SPECULATORS | COMMERCIALS | SMALL TRADERS |
| – Percent of Open Interest Longs: | 20.9 | 52.0 | 24.0 |
| – Percent of Open Interest Shorts: | 21.4 | 55.3 | 20.2 |
| – Net Position: | -623 | -4,617 | 5,240 |
| – Gross Longs: | 29,481 | 73,301 | 33,774 |
| – Gross Shorts: | 30,104 | 77,918 | 28,534 |
| – Long to Short Ratio: | 1.0 to 1 | 0.9 to 1 | 1.2 to 1 |
| NET POSITION TREND: | | | |
| – Strength Index Score (3 Year Range Pct): | 54.0 | 53.0 | 34.4 |
| – Strength Index Reading (3 Year Range): | Bullish | Bullish | Bearish |
| NET POSITION MOVEMENT INDEX: | | | |
| – 6-Week Change in Strength Index: | 2.1 | 8.2 | -31.9 |
Australian Dollar Futures:
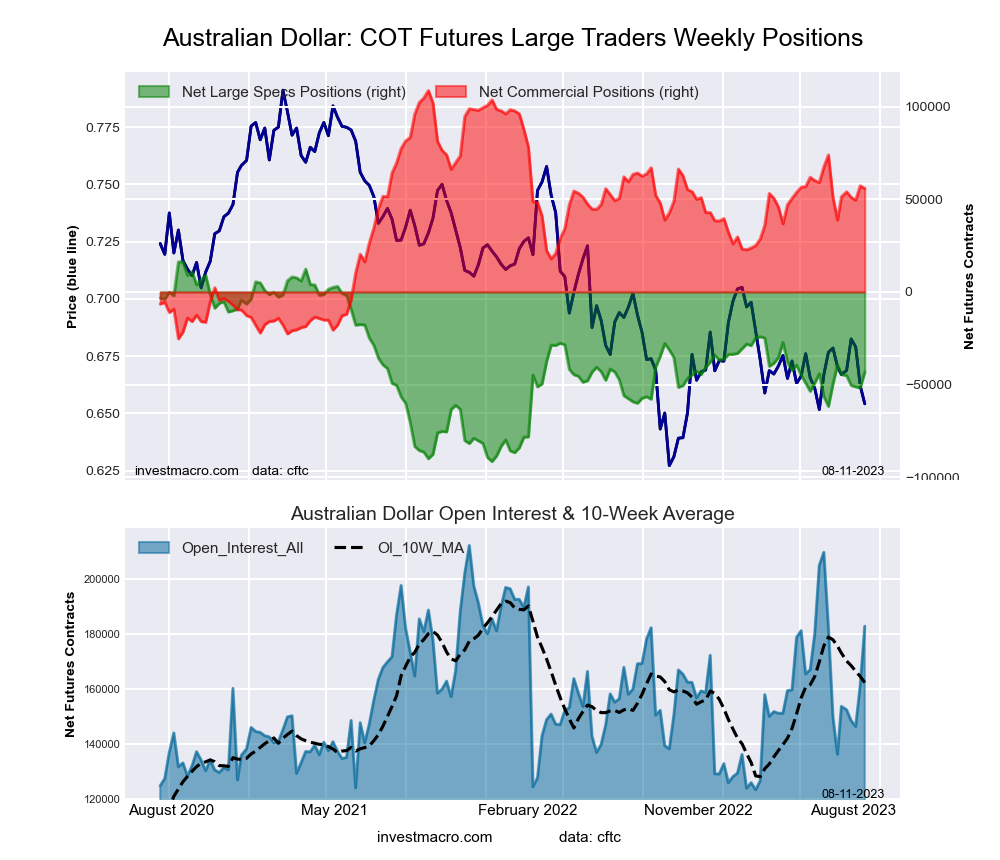 The Australian Dollar large speculator standing this week recorded a net position of -43,192 contracts in the data reported through Tuesday. This was a weekly increase of 8,600 contracts from the previous week which had a total of -51,792 net contracts.
This week’s current strength score (the trader positioning range over the past three years, measured from 0 to 100) shows the speculators are currently Bearish with a score of 44.8 percent. The commercials are Bullish with a score of 60.5 percent and the small traders (not shown in chart) are Bearish with a score of 21.6 percent.
Price Trend-Following Model: Strong Downtrend
Our weekly trend-following model classifies the current market price position as: Strong Downtrend. The current action for the model is considered to be: New Sell – Short Position.
| AUSTRALIAN DOLLAR Statistics | SPECULATORS | COMMERCIALS | SMALL TRADERS |
| – Percent of Open Interest Longs: | 33.4 | 53.1 | 10.3 |
| – Percent of Open Interest Shorts: | 57.0 | 22.5 | 17.3 |
| – Net Position: | -43,192 | 55,845 | -12,653 |
| – Gross Longs: | 61,091 | 96,999 | 18,900 |
| – Gross Shorts: | 104,283 | 41,154 | 31,553 |
| – Long to Short Ratio: | 0.6 to 1 | 2.4 to 1 | 0.6 to 1 |
| NET POSITION TREND: | | | |
| – Strength Index Score (3 Year Range Pct): | 44.8 | 60.5 | 21.6 |
| – Strength Index Reading (3 Year Range): | Bearish | Bullish | Bearish |
| NET POSITION MOVEMENT INDEX: | | | |
| – 6-Week Change in Strength Index: | -3.5 | 12.7 | -32.3 |
New Zealand Dollar Futures:
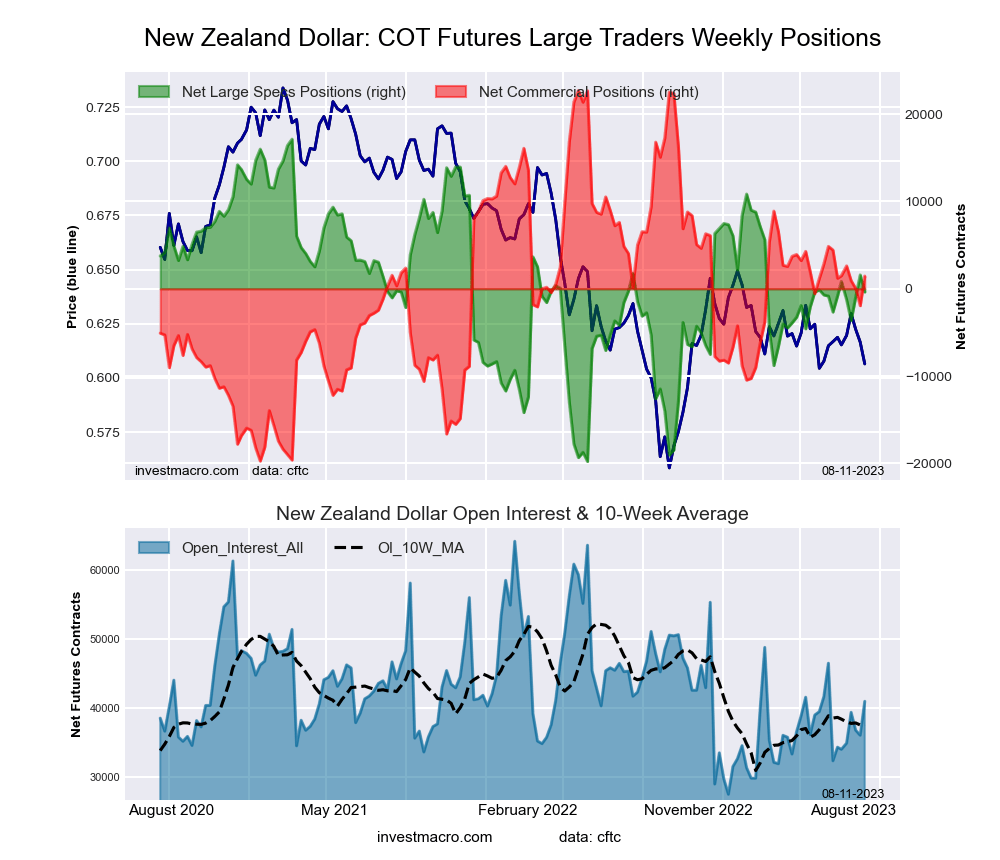 The New Zealand Dollar large speculator standing this week recorded a net position of -368 contracts in the data reported through Tuesday. This was a weekly reduction of -1,954 contracts from the previous week which had a total of 1,586 net contracts.
This week’s current strength score (the trader positioning range over the past three years, measured from 0 to 100) shows the speculators are currently Bullish with a score of 52.6 percent. The commercials are Bearish with a score of 49.9 percent and the small traders (not shown in chart) are Bearish with a score of 37.1 percent.
Price Trend-Following Model: Strong Downtrend
Our weekly trend-following model classifies the current market price position as: Strong Downtrend. The current action for the model is considered to be: Hold – Maintain Short Position.
| NEW ZEALAND DOLLAR Statistics | SPECULATORS | COMMERCIALS | SMALL TRADERS |
| – Percent of Open Interest Longs: | 45.8 | 46.0 | 8.1 |
| – Percent of Open Interest Shorts: | 46.7 | 42.5 | 10.7 |
| – Net Position: | -368 | 1,454 | -1,086 |
| – Gross Longs: | 18,758 | 18,874 | 3,306 |
| – Gross Shorts: | 19,126 | 17,420 | 4,392 |
| – Long to Short Ratio: | 1.0 to 1 | 1.1 to 1 | 0.8 to 1 |
| NET POSITION TREND: | | | |
| – Strength Index Score (3 Year Range Pct): | 52.6 | 49.9 | 37.1 |
| – Strength Index Reading (3 Year Range): | Bullish | Bearish | Bearish |
| NET POSITION MOVEMENT INDEX: | | | |
| – 6-Week Change in Strength Index: | 1.3 | 0.6 | -8.3 |
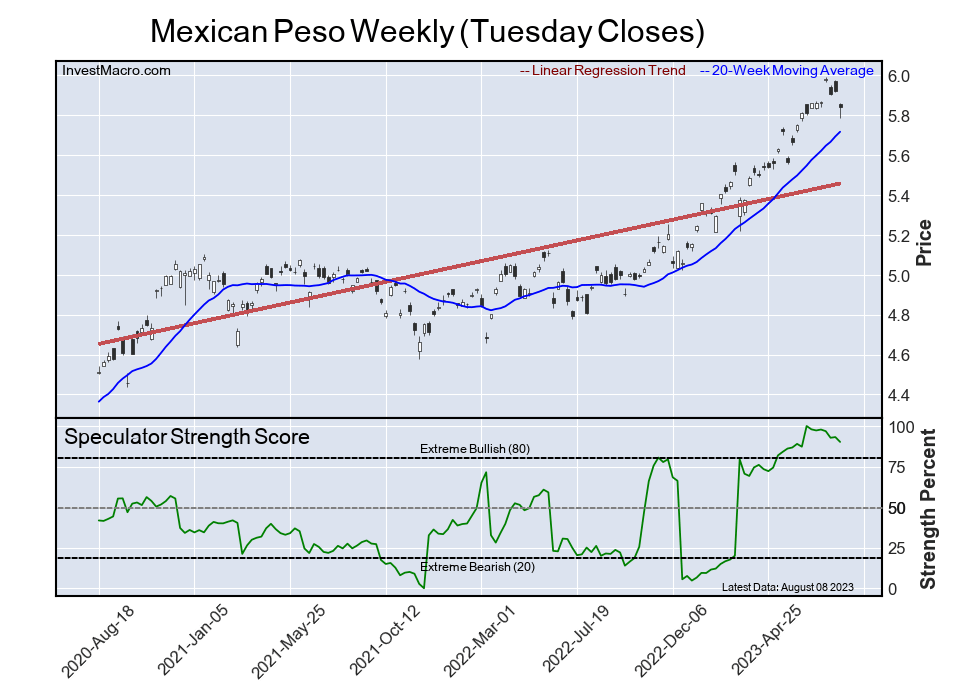
Mexican Peso Futures:
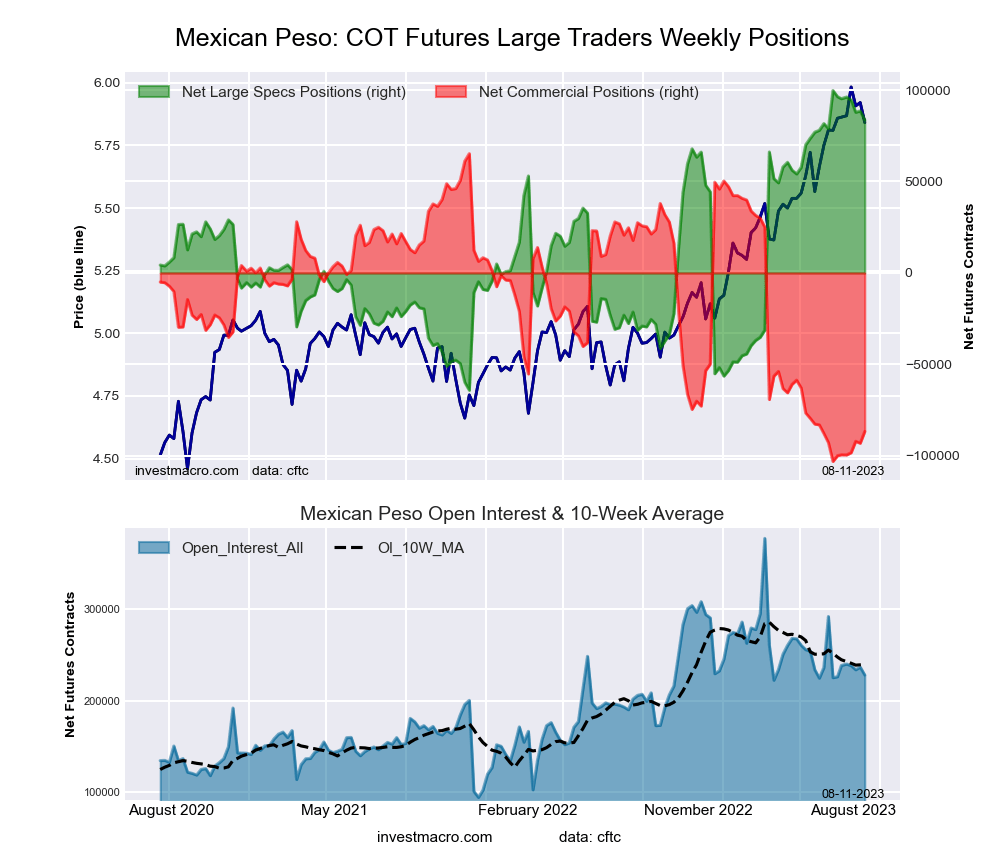 The Mexican Peso large speculator standing this week recorded a net position of 83,651 contracts in the data reported through Tuesday. This was a weekly drop of -4,897 contracts from the previous week which had a total of 88,548 net contracts.
This week’s current strength score (the trader positioning range over the past three years, measured from 0 to 100) shows the speculators are currently Bullish-Extreme with a score of 90.2 percent. The commercials are Bearish-Extreme with a score of 9.7 percent and the small traders (not shown in chart) are Bearish with a score of 30.2 percent.
Price Trend-Following Model: Uptrend
Our weekly trend-following model classifies the current market price position as: Uptrend. The current action for the model is considered to be: Hold – Maintain Long Position.
| MEXICAN PESO Statistics | SPECULATORS | COMMERCIALS | SMALL TRADERS |
| – Percent of Open Interest Longs: | 48.3 | 47.9 | 3.2 |
| – Percent of Open Interest Shorts: | 11.6 | 85.9 | 1.9 |
| – Net Position: | 83,651 | -86,640 | 2,989 |
| – Gross Longs: | 110,008 | 109,028 | 7,344 |
| – Gross Shorts: | 26,357 | 195,668 | 4,355 |
| – Long to Short Ratio: | 4.2 to 1 | 0.6 to 1 | 1.7 to 1 |
| NET POSITION TREND: | | | |
| – Strength Index Score (3 Year Range Pct): | 90.2 | 9.7 | 30.2 |
| – Strength Index Reading (3 Year Range): | Bullish-Extreme | Bearish-Extreme | Bearish |
| NET POSITION MOVEMENT INDEX: | | | |
| – 6-Week Change in Strength Index: | -7.8 | 7.9 | -3.6 |
Brazilian Real Futures:
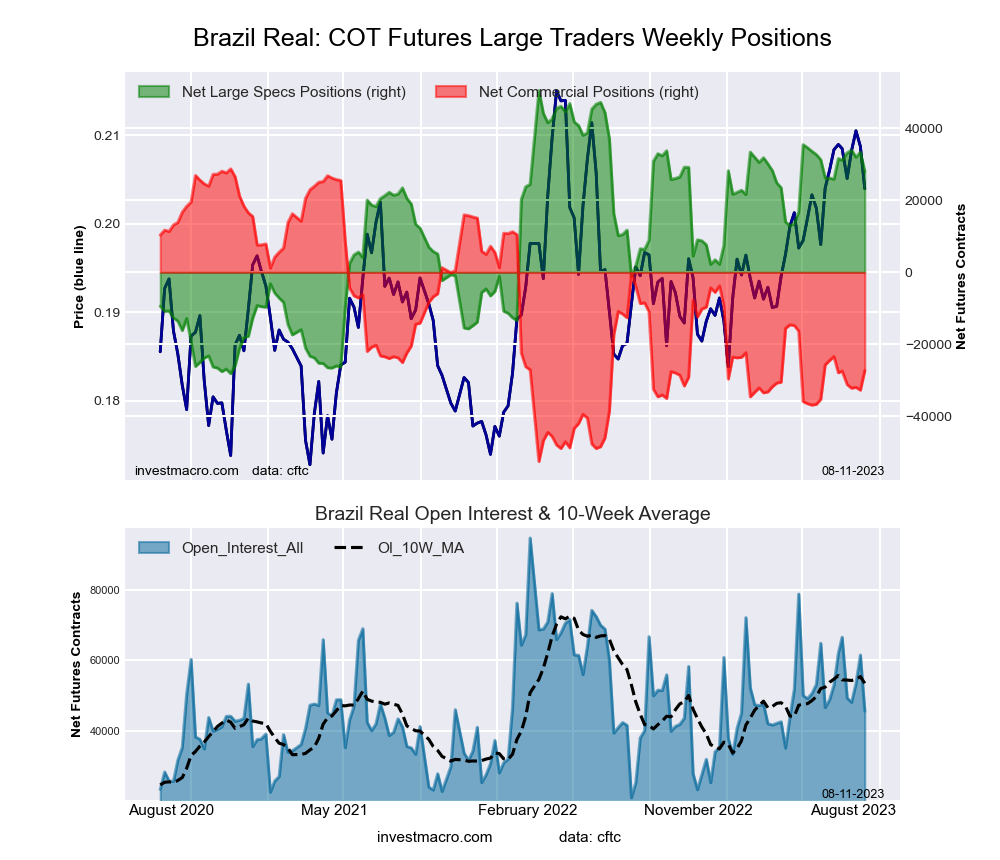 The Brazilian Real large speculator standing this week recorded a net position of 28,039 contracts in the data reported through Tuesday. This was a weekly decrease of -5,312 contracts from the previous week which had a total of 33,351 net contracts.
This week’s current strength score (the trader positioning range over the past three years, measured from 0 to 100) shows the speculators are currently Bullish with a score of 71.4 percent. The commercials are Bearish with a score of 31.1 percent and the small traders (not shown in chart) are Bearish with a score of 37.9 percent.
Price Trend-Following Model: Uptrend
Our weekly trend-following model classifies the current market price position as: Uptrend. The current action for the model is considered to be: Hold – Maintain Long Position.
| BRAZIL REAL Statistics | SPECULATORS | COMMERCIALS | SMALL TRADERS |
| – Percent of Open Interest Longs: | 71.8 | 19.0 | 8.0 |
| – Percent of Open Interest Shorts: | 10.4 | 78.7 | 9.7 |
| – Net Position: | 28,039 | -27,269 | -770 |
| – Gross Longs: | 32,815 | 8,706 | 3,663 |
| – Gross Shorts: | 4,776 | 35,975 | 4,433 |
| – Long to Short Ratio: | 6.9 to 1 | 0.2 to 1 | 0.8 to 1 |
| NET POSITION TREND: | | | |
| – Strength Index Score (3 Year Range Pct): | 71.4 | 31.1 | 37.9 |
| – Strength Index Reading (3 Year Range): | Bullish | Bearish | Bearish |
| NET POSITION MOVEMENT INDEX: | | | |
| – 6-Week Change in Strength Index: | -4.5 | 0.8 | 23.3 |
Bitcoin Futures:
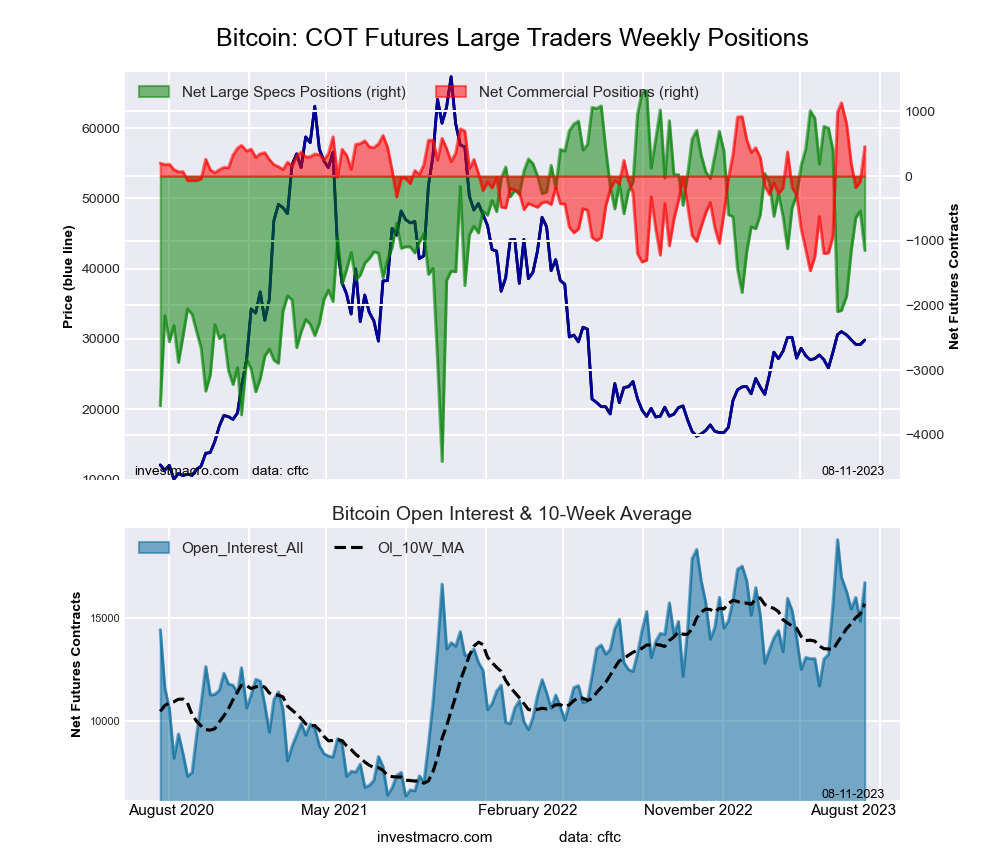 The Bitcoin large speculator standing this week recorded a net position of -1,149 contracts in the data reported through Tuesday. This was a weekly decline by -610 contracts from the previous week which had a total of -539 net contracts.
This week’s current strength score (the trader positioning range over the past three years, measured from 0 to 100) shows the speculators are currently Bullish with a score of 56.9 percent. The commercials are Bullish with a score of 73.9 percent and the small traders (not shown in chart) are Bearish with a score of 28.7 percent.
Price Trend-Following Model: Strong Uptrend
Our weekly trend-following model classifies the current market price position as: Strong Uptrend. The current action for the model is considered to be: Hold – Maintain Long Position.
| BITCOIN Statistics | SPECULATORS | COMMERCIALS | SMALL TRADERS |
| – Percent of Open Interest Longs: | 77.6 | 6.5 | 7.5 |
| – Percent of Open Interest Shorts: | 84.4 | 3.7 | 3.3 |
| – Net Position: | -1,149 | 456 | 693 |
| – Gross Longs: | 12,985 | 1,082 | 1,250 |
| – Gross Shorts: | 14,134 | 626 | 557 |
| – Long to Short Ratio: | 0.9 to 1 | 1.7 to 1 | 2.2 to 1 |
| NET POSITION TREND: | | | |
| – Strength Index Score (3 Year Range Pct): | 56.9 | 73.9 | 28.7 |
| – Strength Index Reading (3 Year Range): | Bullish | Bullish | Bearish |
| NET POSITION MOVEMENT INDEX: | | | |
| – 6-Week Change in Strength Index: | 16.5 | -20.6 | -9.3 |
Article By InvestMacro – Receive our weekly COT Newsletter
*COT Report: The COT data, released weekly to the public each Friday, is updated through the most recent Tuesday (data is 3 days old) and shows a quick view of how large speculators or non-commercials (for-profit traders) were positioned in the futures markets.
The CFTC categorizes trader positions according to commercial hedgers (traders who use futures contracts for hedging as part of the business), non-commercials (large traders who speculate to realize trading profits) and nonreportable traders (usually small traders/speculators) as well as their open interest (contracts open in the market at time of reporting). See CFTC criteria here.


