
By InvestMacro
Here are the latest charts and statistics for the Commitment of Traders (COT) data published by the Commodities Futures Trading Commission (CFTC).
The latest COT data is updated through Tuesday August 8th and shows a quick view of how large traders (for-profit speculators and commercial entities) were positioned in the futures markets.
Weekly Speculator Bets drop this week led by Gold & Copper
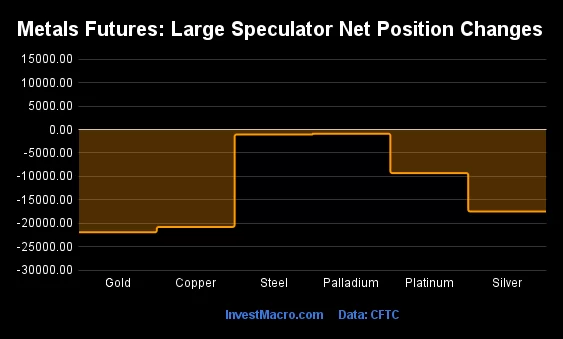
The COT metals markets speculator bets were lower this week as all of the six markets we follow had lower speculator contracts.
Free Reports:
 Download Our Metatrader 4 Indicators – Put Our Free MetaTrader 4 Custom Indicators on your charts when you join our Weekly Newsletter
 Get our Weekly Commitment of Traders Reports - See where the biggest traders (Hedge Funds and Commercial Hedgers) are positioned in the futures markets on a weekly basis.
The markets leading the declines in speculator bets for the week were Gold (-21,939 contracts) with Copper (-20,801 contracts), Silver (-17,507 contracts), Platinum (-9,298 contracts), Steel (-1,065 contracts) with Palladium (-895 contracts) also registering lower bets on the week.
| Aug-08-2023 | OI | OI-Index | Spec-Net | Spec-Index | Com-Net | COM-Index | Smalls-Net | Smalls-Index |
|---|---|---|---|---|---|---|---|---|
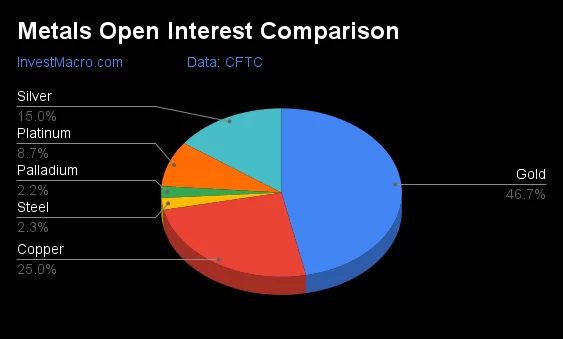
| Gold | 427,759 | 3 | 142,985 | 40 | -167,554 | 59 | 24,569 | 42 |
| Silver | 137,631 | 29 | 13,324 | 37 | -30,349 | 57 | 17,025 | 61 |
| Copper | 228,537 | 65 | -10,057 | 22 | 4,908 | 76 | 5,149 | 51 |
| Palladium | 20,470 | 100 | -10,192 | 0 | 10,299 | 100 | -107 | 35 |
| Platinum | 79,989 | 100 | 2,992 | 22 | -8,591 | 76 | 5,599 | 43 |
Strength Scores led by Steel & Gold
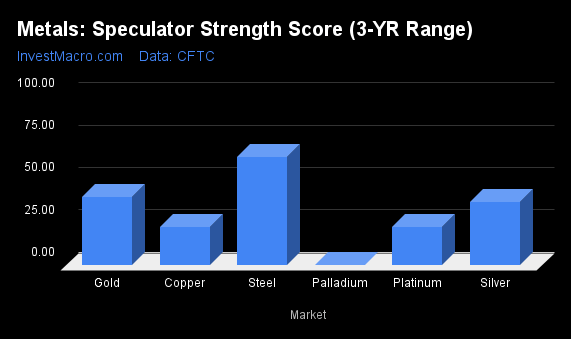
COT Strength Scores (a normalized measure of Speculator positions over a 3-Year range, from 0 to 100 where above 80 is Extreme-Bullish and below 20 is Extreme-Bearish) showed that Steel (64 percent) and Gold (40 percent) lead the metals markets this week. Silver (37 percent) comes in as the next highest in the weekly strength scores.
On the downside, Palladium (0.0 percent) comes in at the lowest strength level currently and is in Extreme-Bearish territory (below 20 percent).
Strength Statistics:
Gold (40.0 percent) vs Gold previous week (49.7 percent)
Silver (37.3 percent) vs Silver previous week (62.2 percent)
Copper (22.2 percent) vs Copper previous week (40.1 percent)
Platinum (22.5 percent) vs Platinum previous week (43.9 percent)
Palladium (0.0 percent) vs Palladium previous week (6.4 percent)
Steel (64.1 percent) vs Palladium previous week (67.2 percent)
Gold & Steel are the least negative in the 6-Week Strength Trends
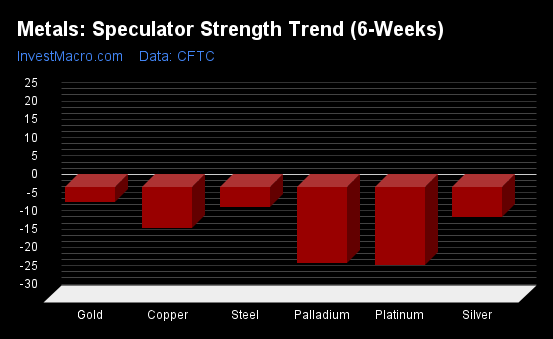
COT Strength Score Trends (or move index, calculates the 6-week changes in strength scores) showed that Gold (-4 percent) and Steel (-5 percent) topped the past six weeks trends for metals but were in negative trends.
Platinum (-21 percent) and Palladium (-21 percent) lead and show the most negative trends currently.
Move Statistics:
Gold (-3.9 percent) vs Gold previous week (0.9 percent)
Silver (-8.2 percent) vs Silver previous week (15.4 percent)
Copper (-11.2 percent) vs Copper previous week (7.7 percent)
Platinum (-21.2 percent) vs Platinum previous week (-16.6 percent)
Palladium (-20.6 percent) vs Palladium previous week (-19.1 percent)
Steel (-5.3 percent) vs Steel previous week (-0.6 percent)
Individual Markets:
Gold Comex Futures:
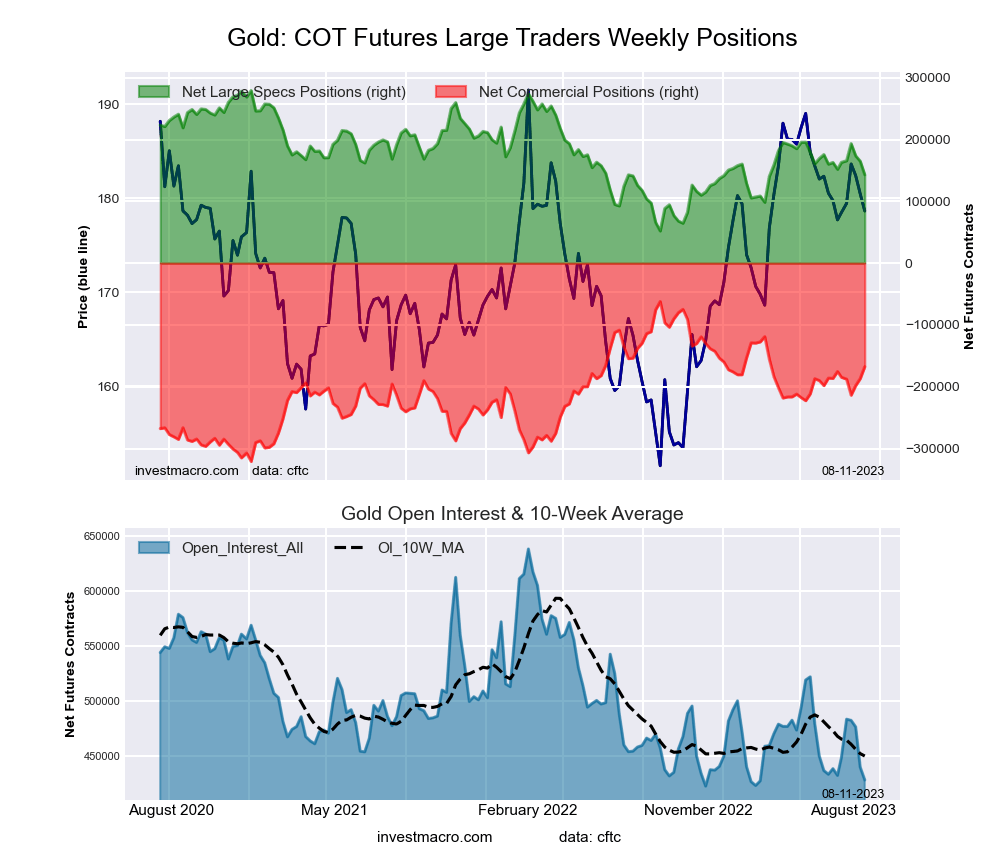 The Gold Comex Futures large speculator standing this week resulted in a net position of 142,985 contracts in the data reported through Tuesday. This was a weekly decline of -21,939 contracts from the previous week which had a total of 164,924 net contracts.
This week’s current strength score (the trader positioning range over the past three years, measured from 0 to 100) shows the speculators are currently Bearish with a score of 40.0 percent. The commercials are Bullish with a score of 59.3 percent and the small traders (not shown in chart) are Bearish with a score of 41.5 percent.
Price Trend-Following Model: Strong Downtrend
Our weekly trend-following model classifies the current market price position as: Strong Downtrend. The current action for the model is considered to be: Hold – Maintain Short Position.
| Gold Futures Statistics | SPECULATORS | COMMERCIALS | SMALL TRADERS |
| – Percent of Open Interest Longs: | 53.5 | 26.6 | 10.5 |
| – Percent of Open Interest Shorts: | 20.1 | 65.8 | 4.8 |
| – Net Position: | 142,985 | -167,554 | 24,569 |
| – Gross Longs: | 228,846 | 113,890 | 44,996 |
| – Gross Shorts: | 85,861 | 281,444 | 20,427 |
| – Long to Short Ratio: | 2.7 to 1 | 0.4 to 1 | 2.2 to 1 |
| NET POSITION TREND: | |||
| – Strength Index Score (3 Year Range Pct): | 40.0 | 59.3 | 41.5 |
| – Strength Index Reading (3 Year Range): | Bearish | Bullish | Bearish |
| NET POSITION MOVEMENT INDEX: | |||
| – 6-Week Change in Strength Index: | -3.9 | 3.0 | 2.9 |
Silver Comex Futures:
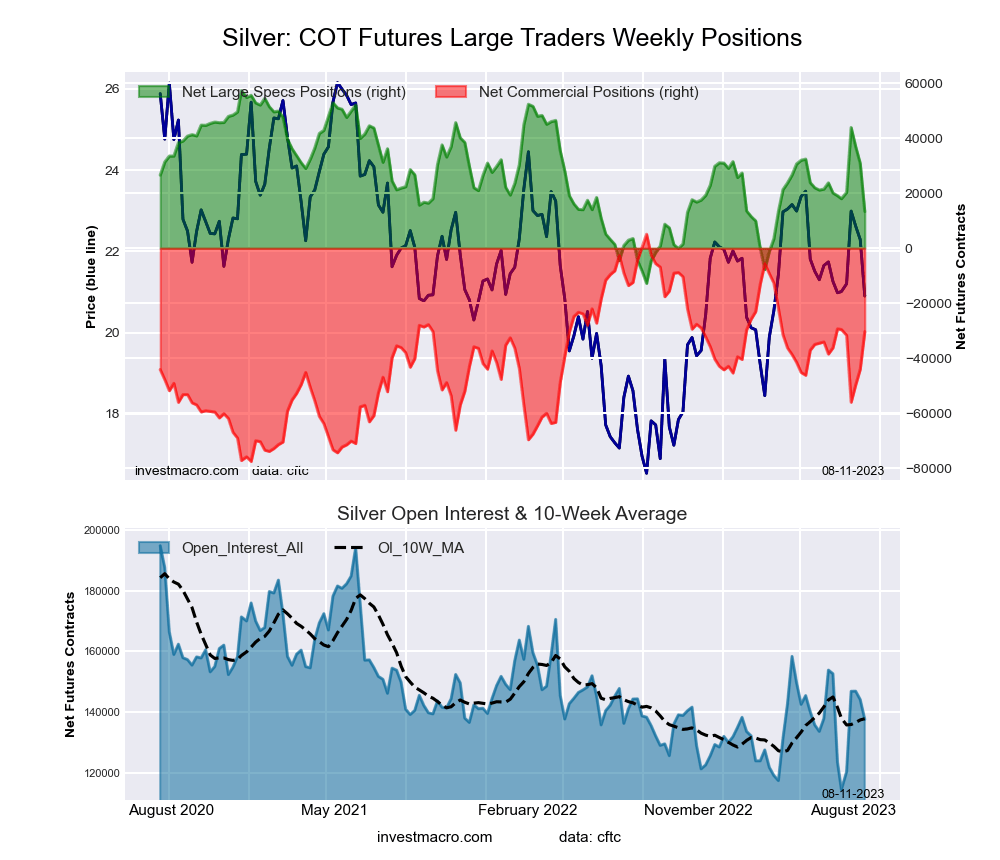 The Silver Comex Futures large speculator standing this week resulted in a net position of 13,324 contracts in the data reported through Tuesday. This was a weekly decline of -17,507 contracts from the previous week which had a total of 30,831 net contracts.
This week’s current strength score (the trader positioning range over the past three years, measured from 0 to 100) shows the speculators are currently Bearish with a score of 37.3 percent. The commercials are Bullish with a score of 57.1 percent and the small traders (not shown in chart) are Bullish with a score of 61.1 percent.
Price Trend-Following Model: Strong Downtrend
Our weekly trend-following model classifies the current market price position as: Strong Downtrend. The current action for the model is considered to be: Hold – Maintain Short Position.
| Silver Futures Statistics | SPECULATORS | COMMERCIALS | SMALL TRADERS |
| – Percent of Open Interest Longs: | 39.1 | 30.3 | 19.9 |
| – Percent of Open Interest Shorts: | 29.4 | 52.3 | 7.5 |
| – Net Position: | 13,324 | -30,349 | 17,025 |
| – Gross Longs: | 53,781 | 41,636 | 27,349 |
| – Gross Shorts: | 40,457 | 71,985 | 10,324 |
| – Long to Short Ratio: | 1.3 to 1 | 0.6 to 1 | 2.6 to 1 |
| NET POSITION TREND: | |||
| – Strength Index Score (3 Year Range Pct): | 37.3 | 57.1 | 61.1 |
| – Strength Index Reading (3 Year Range): | Bearish | Bullish | Bullish |
| NET POSITION MOVEMENT INDEX: | |||
| – 6-Week Change in Strength Index: | -8.2 | -1.2 | 37.8 |
Copper Grade #1 Futures:
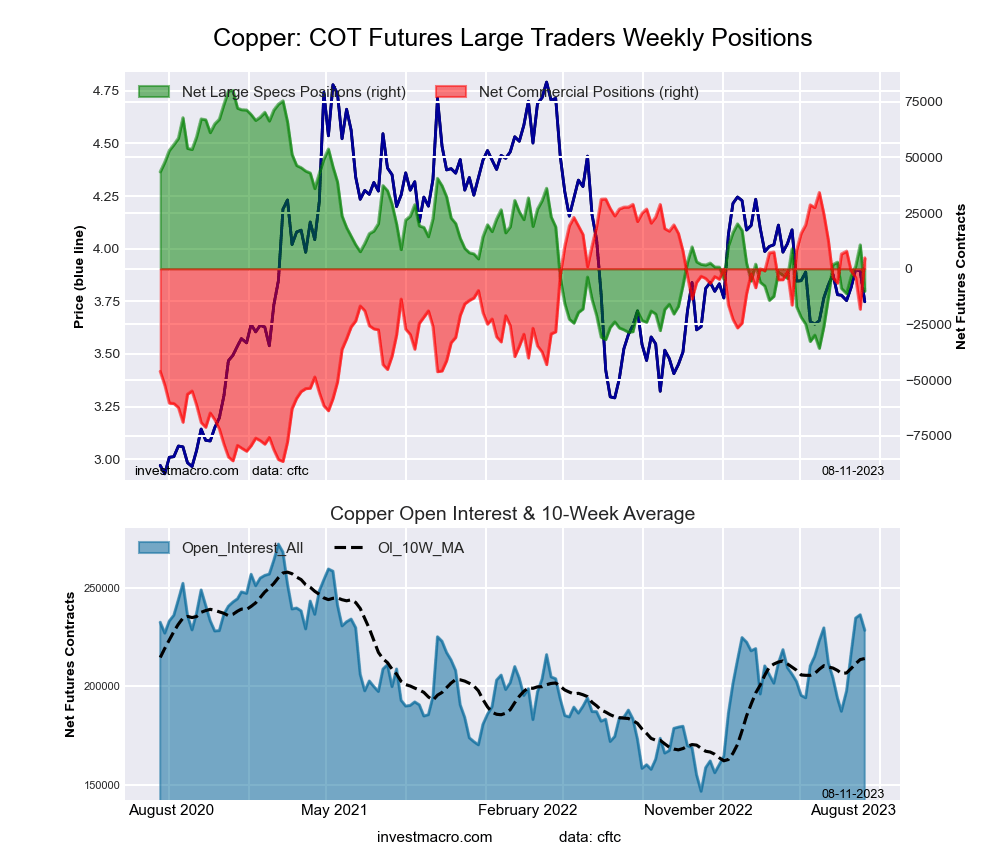 The Copper Grade #1 Futures large speculator standing this week resulted in a net position of -10,057 contracts in the data reported through Tuesday. This was a weekly reduction of -20,801 contracts from the previous week which had a total of 10,744 net contracts.
This week’s current strength score (the trader positioning range over the past three years, measured from 0 to 100) shows the speculators are currently Bearish with a score of 22.2 percent. The commercials are Bullish with a score of 75.7 percent and the small traders (not shown in chart) are Bullish with a score of 51.0 percent.
Price Trend-Following Model: Downtrend
Our weekly trend-following model classifies the current market price position as: Downtrend. The current action for the model is considered to be: Hold – Maintain Short Position.
| Copper Futures Statistics | SPECULATORS | COMMERCIALS | SMALL TRADERS |
| – Percent of Open Interest Longs: | 31.2 | 42.3 | 7.9 |
| – Percent of Open Interest Shorts: | 35.6 | 40.2 | 5.6 |
| – Net Position: | -10,057 | 4,908 | 5,149 |
| – Gross Longs: | 71,247 | 96,728 | 17,983 |
| – Gross Shorts: | 81,304 | 91,820 | 12,834 |
| – Long to Short Ratio: | 0.9 to 1 | 1.1 to 1 | 1.4 to 1 |
| NET POSITION TREND: | |||
| – Strength Index Score (3 Year Range Pct): | 22.2 | 75.7 | 51.0 |
| – Strength Index Reading (3 Year Range): | Bearish | Bullish | Bullish |
| NET POSITION MOVEMENT INDEX: | |||
| – 6-Week Change in Strength Index: | -11.2 | 9.4 | 10.4 |
Platinum Futures:
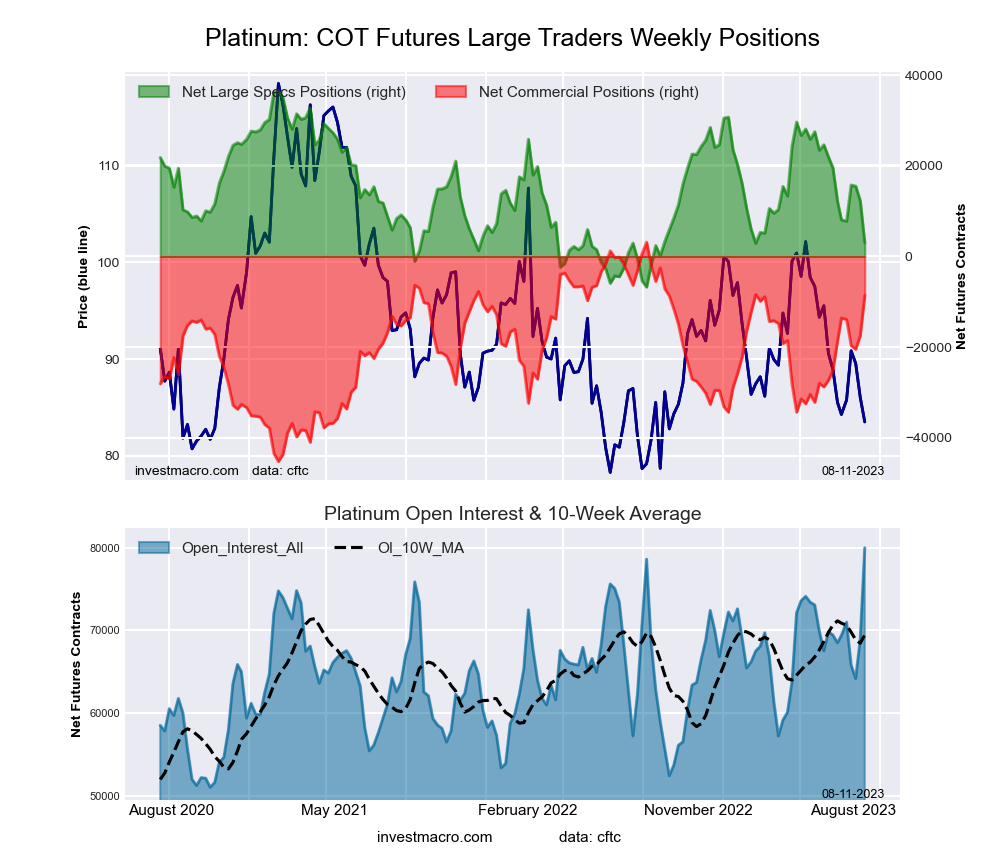 The Platinum Futures large speculator standing this week resulted in a net position of 2,992 contracts in the data reported through Tuesday. This was a weekly decrease of -9,298 contracts from the previous week which had a total of 12,290 net contracts.
This week’s current strength score (the trader positioning range over the past three years, measured from 0 to 100) shows the speculators are currently Bearish with a score of 22.5 percent. The commercials are Bullish with a score of 75.7 percent and the small traders (not shown in chart) are Bearish with a score of 43.0 percent.
Price Trend-Following Model: Strong Downtrend
Our weekly trend-following model classifies the current market price position as: Strong Downtrend. The current action for the model is considered to be: Hold – Maintain Short Position.
| Platinum Futures Statistics | SPECULATORS | COMMERCIALS | SMALL TRADERS |
| – Percent of Open Interest Longs: | 52.5 | 27.4 | 12.0 |
| – Percent of Open Interest Shorts: | 48.8 | 38.1 | 5.0 |
| – Net Position: | 2,992 | -8,591 | 5,599 |
| – Gross Longs: | 42,007 | 21,899 | 9,574 |
| – Gross Shorts: | 39,015 | 30,490 | 3,975 |
| – Long to Short Ratio: | 1.1 to 1 | 0.7 to 1 | 2.4 to 1 |
| NET POSITION TREND: | |||
| – Strength Index Score (3 Year Range Pct): | 22.5 | 75.7 | 43.0 |
| – Strength Index Reading (3 Year Range): | Bearish | Bullish | Bearish |
| NET POSITION MOVEMENT INDEX: | |||
| – 6-Week Change in Strength Index: | -21.2 | 20.8 | -11.5 |
Palladium Futures:
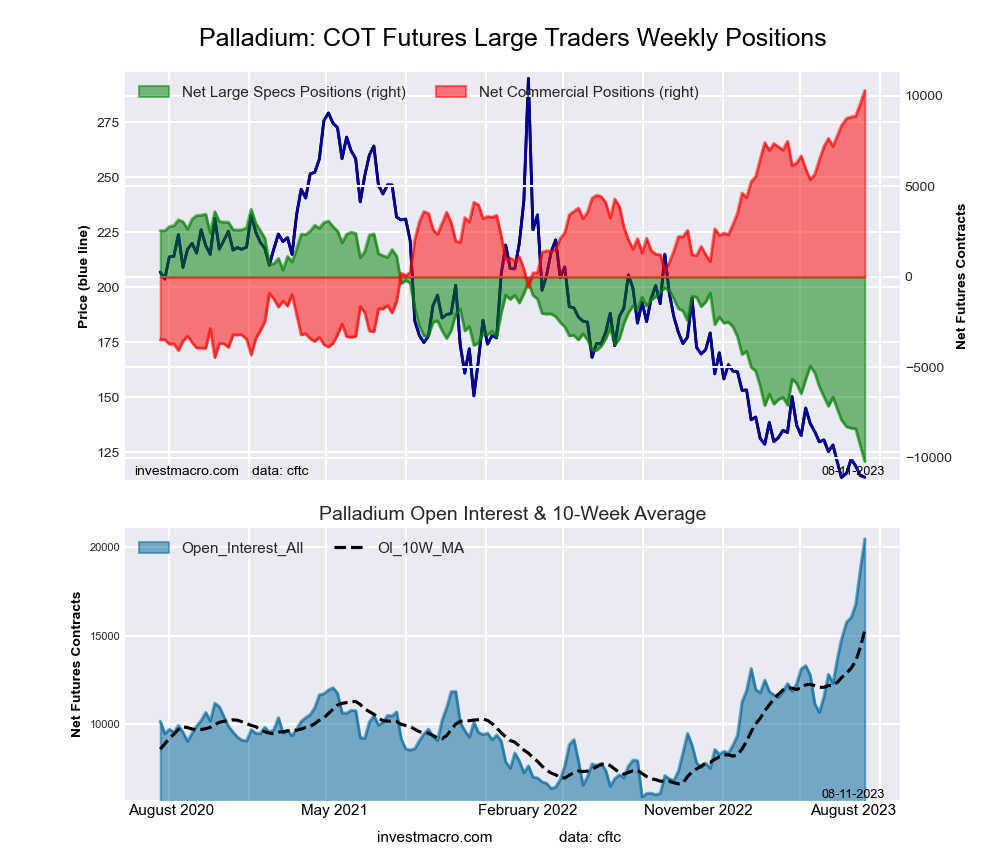 The Palladium Futures large speculator standing this week resulted in a net position of -10,192 contracts in the data reported through Tuesday. This was a weekly fall of -895 contracts from the previous week which had a total of -9,297 net contracts.
This week’s current strength score (the trader positioning range over the past three years, measured from 0 to 100) shows the speculators are currently Bearish-Extreme with a score of 0.0 percent. The commercials are Bullish-Extreme with a score of 100.0 percent and the small traders (not shown in chart) are Bearish with a score of 35.3 percent.
Price Trend-Following Model: Downtrend
Our weekly trend-following model classifies the current market price position as: Downtrend. The current action for the model is considered to be: Hold – Maintain Short Position.
| Palladium Futures Statistics | SPECULATORS | COMMERCIALS | SMALL TRADERS |
| – Percent of Open Interest Longs: | 20.5 | 60.2 | 8.1 |
| – Percent of Open Interest Shorts: | 70.3 | 9.8 | 8.6 |
| – Net Position: | -10,192 | 10,299 | -107 |
| – Gross Longs: | 4,198 | 12,313 | 1,659 |
| – Gross Shorts: | 14,390 | 2,014 | 1,766 |
| – Long to Short Ratio: | 0.3 to 1 | 6.1 to 1 | 0.9 to 1 |
| NET POSITION TREND: | |||
| – Strength Index Score (3 Year Range Pct): | 0.0 | 100.0 | 35.3 |
| – Strength Index Reading (3 Year Range): | Bearish-Extreme | Bullish-Extreme | Bearish |
| NET POSITION MOVEMENT INDEX: | |||
| – 6-Week Change in Strength Index: | -20.6 | 16.7 | 24.0 |
Steel Futures Futures:
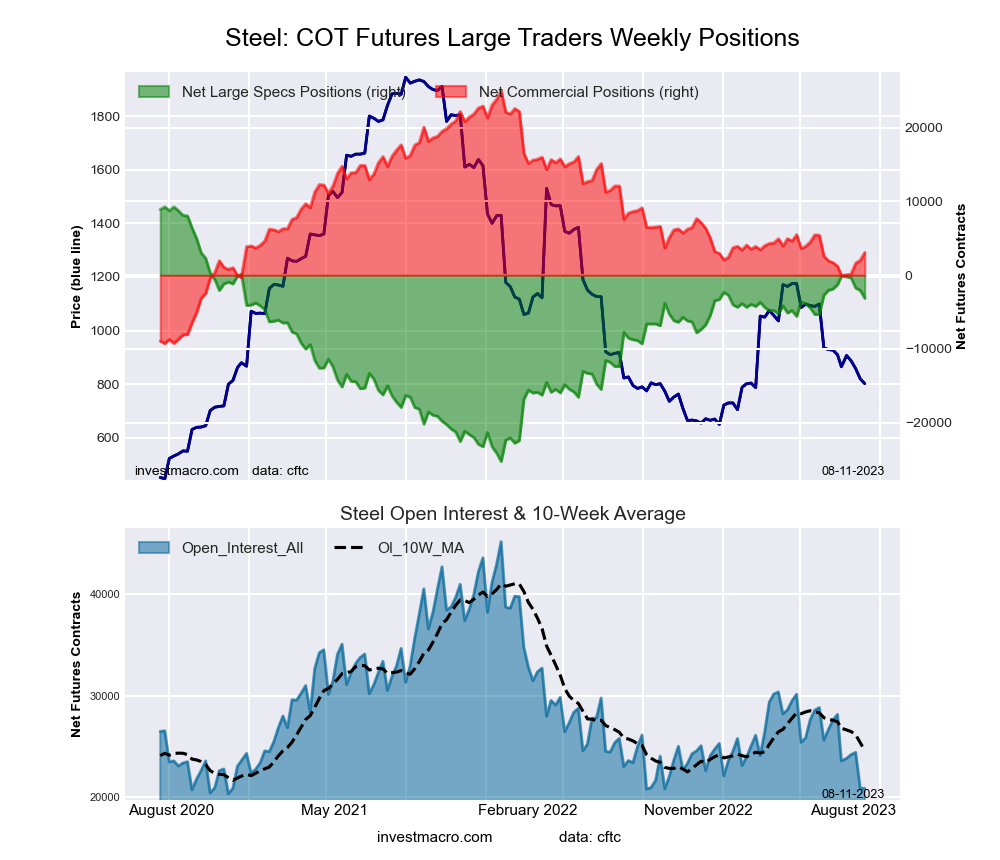 The Steel Futures large speculator standing this week resulted in a net position of -3,121 contracts in the data reported through Tuesday. This was a weekly reduction of -1,065 contracts from the previous week which had a total of -2,056 net contracts.
This week’s current strength score (the trader positioning range over the past three years, measured from 0 to 100) shows the speculators are currently Bullish with a score of 64.1 percent. The commercials are Bearish with a score of 36.0 percent and the small traders (not shown in chart) are Bearish with a score of 26.2 percent.
Price Trend-Following Model: Downtrend
Our weekly trend-following model classifies the current market price position as: Downtrend. The current action for the model is considered to be: Hold – Maintain Short Position.
| Steel Futures Statistics | SPECULATORS | COMMERCIALS | SMALL TRADERS |
| – Percent of Open Interest Longs: | 8.5 | 86.2 | 1.1 |
| – Percent of Open Interest Shorts: | 23.5 | 71.4 | 0.9 |
| – Net Position: | -3,121 | 3,074 | 47 |
| – Gross Longs: | 1,780 | 17,968 | 227 |
| – Gross Shorts: | 4,901 | 14,894 | 180 |
| – Long to Short Ratio: | 0.4 to 1 | 1.2 to 1 | 1.3 to 1 |
| NET POSITION TREND: | |||
| – Strength Index Score (3 Year Range Pct): | 64.1 | 36.0 | 26.2 |
| – Strength Index Reading (3 Year Range): | Bullish | Bearish | Bearish |
| NET POSITION MOVEMENT INDEX: | |||
| – 6-Week Change in Strength Index: | -5.3 | 5.4 | -1.6 |
Article By InvestMacro – Receive our weekly COT Newsletter
*COT Report: The COT data, released weekly to the public each Friday, is updated through the most recent Tuesday (data is 3 days old) and shows a quick view of how large speculators or non-commercials (for-profit traders) were positioned in the futures markets.
The CFTC categorizes trader positions according to commercial hedgers (traders who use futures contracts for hedging as part of the business), non-commercials (large traders who speculate to realize trading profits) and nonreportable traders (usually small traders/speculators) as well as their open interest (contracts open in the market at time of reporting). See CFTC criteria here.

- COT Metals Charts: Weekly Speculator Bets see small gains for Silver & Gold Jul 12, 2026
- COT Bonds Charts: Speculator Bets led by SOFR 3-Months & 2-Year Bonds Jul 12, 2026
- COT Energy Charts: Weekly Speculator Changes led by Brent Oil Jul 12, 2026
- COT Soft Commodities Charts: Weekly Speculator Changes led by Sugar, Corn & Soybeans Jul 12, 2026
- The US and European stock indices are rising again amid renewed investor interest in the AI industry. Jul 10, 2026
- USD/JPY Falls as Yen Recovers Weekly Losses Jul 10, 2026
- Crude oil prices surged sharply by 7% in reaction to the rapid escalation of the conflict in the Middle East Jul 9, 2026
- Middle East Tensions Weigh on Gold Jul 9, 2026
- Pound Awaits Tighter Policy from Bank of England Jul 8, 2026
- The United States carried out airstrikes on Iran after Iran’s attacked tankers in the Strait of Hormuz. The RBNZ raised the interest rate to 2.5% Jul 8, 2026