By InvestMacro
Here are the latest charts and statistics for the Commitment of Traders (COT) data published by the Commodities Futures Trading Commission (CFTC).
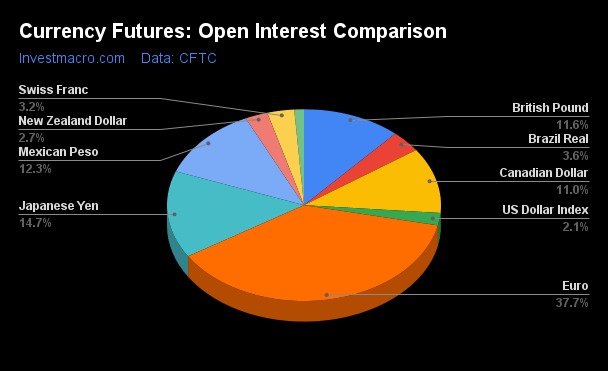
The latest COT data is updated through Tuesday November 14th and shows a quick view of how large market participants (for-profit speculators and commercial traders) were positioned in the futures markets. All currency positions are in direct relation to the US dollar where, for example, a bet for the euro is a bet that the euro will rise versus the dollar while a bet against the euro will be a bet that the euro will decline versus the dollar.
Weekly Speculator Bets led by EuroFX & Mexican Peso
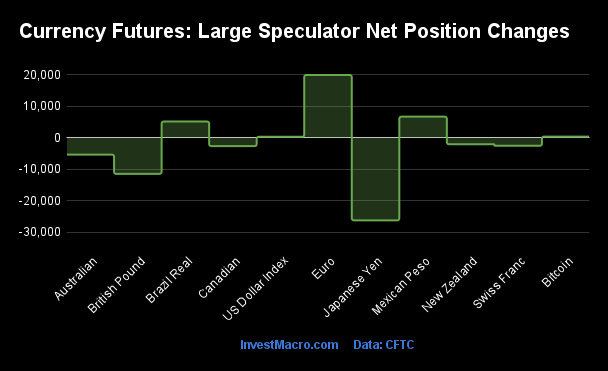
The COT currency market speculator bets were slightly lower this week as five out of the eleven currency markets we cover had higher positioning while the other six markets had lower speculator contracts.
Leading the gains for the currency markets was the EuroFX (19,851 contracts) with the Mexican Peso (6,642 contracts), the Brazilian Real (5,100 contracts), Bitcoin (333 contracts) and the US Dollar Index (263 contracts) also recording positive weeks.
The currencies seeing declines in speculator bets on the week were the Japanese Yen (-26,209 contracts), the British Pound (-11,478 contracts), the Australian Dollar (-5,393 contracts), the New Zealand Dollar (-2,094 contracts), Canadian Dollar (-2,682 contracts) and the Swiss Franc (-2,589 contracts) also seeing lower bets on the week.
Japanese Yen Speculator bets decline to 6-year high
Highlighting the COT currency’s data this week was the renewed boost in the weakness of the Japanese yen speculator positioning. Large speculative yen positions fell sharply this week by -26,209 net contracts and dropped for the third straight week. Over the past sixteen weeks, the yen speculator bets have decreased in twelve of those weeks and a total of -52,497 contracts have been added to the current bearish standing.
This week’s yen net position of -130,249 contracts marks the most bearish level of the past 313 weeks, dating all the way back to November 14th of 2017 (exactly six years to the date) when the net position had fallen to -135,999 contracts.
The Bank of Japan (BOJ) has continued with an ultra-loose monetary policy regime in contrast to most major economies that have been aggressively raising interest rates to combat inflationary pressures over the past year. The BOJ recently kept its interest rate unchanged (currently at -0.1 percent) but changed the upper level for the 10-year interest rate to 1 percent and cited an expectation of higher inflation going forward. Market watchers are speculating that the BOJ could end its negative interest rates as early as January. Depending on the path and the many variables going forward, a normalization of policy could be a benefit for the Japanese yen which has been at weakest levels in three decades.
This week, the yen exchange rate against the US Dollar was stronger and managed to close the week at the 149.50 level. This was a turnaround at the end of the week after the USDJPY currency pair touched the 151.90 exchange level on Monday (a higher USDJPY exchange rate means dollar strength & yen weakness) which was the highest point for the currency pair since October of 2022 when the pair reached a high of 151.94.
| Nov-14-2023 | OI | OI-Index | Spec-Net | Spec-Index | Com-Net | COM-Index | Smalls-Net | Smalls-Index |
|---|
| USD Index | 38,842 | 32 | 19,734 | 58 | -20,378 | 43 | 644 | 13 |
| EUR | 702,463 | 35 | 108,907 | 67 | -140,987 | 36 | 32,080 | 30 |
| GBP | 216,411 | 47 | -27,730 | 37 | 35,439 | 66 | -7,709 | 43 |
| JPY | 273,763 | 91 | -130,249 | 0 | 133,272 | 100 | -3,023 | 47 |
| CHF | 59,464 | 93 | -20,151 | 1 | 27,543 | 89 | -7,392 | 35 |
| CAD | 206,046 | 65 | -70,403 | 0 | 77,698 | 100 | -7,295 | 7 |
| AUD | 197,469 | 56 | -70,956 | 24 | 79,057 | 77 | -8,101 | 33 |
| NZD | 49,906 | 56 | -17,034 | 11 | 19,170 | 88 | -2,136 | 25 |
| MXN | 228,809 | 48 | 43,382 | 66 | -47,568 | 33 | 4,186 | 38 |
| RUB | 20,930 | 4 | 7,543 | 31 | -7,150 | 69 | -393 | 24 |
| BRL | 68,030 | 64 | 31,651 | 76 | -33,408 | 24 | 1,757 | 51 |
| Bitcoin | 21,203 | 96 | -1,344 | 46 | 481 | 0 | 863 | 33 |
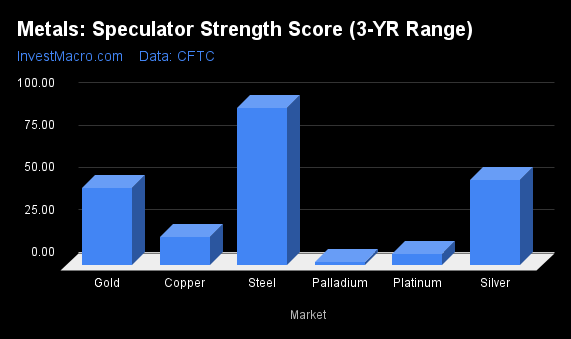
Strength Scores led by Brazilian Real & EuroFX
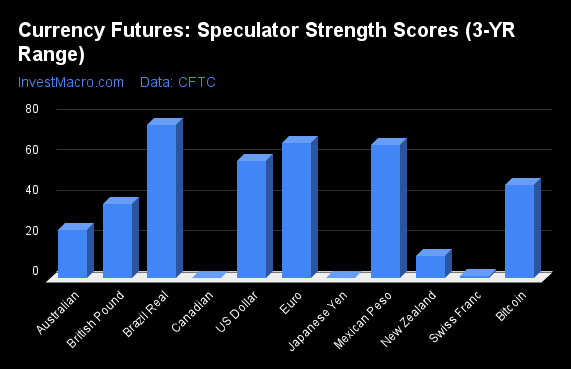
COT Strength Scores (a normalized measure of Speculator positions over a 3-Year range, from 0 to 100 where above 80 is Extreme-Bullish and below 20 is Extreme-Bearish) showed that the Brazilian Real (76 percent) and the EuroFX (67 percent) lead the currency markets this week. The Mexican Peso (66 percent) and the US Dollar Index (58 percent) come in as the next highest in the weekly strength scores.
On the downside, the Canadian Dollar (0 percent), the Japanese Yen (0 percent), the Swiss Franc (1 percent) and the New Zealand Dollar (11 percent) come in at the lowest strength levels currently and are in Extreme-Bearish territory (below 20 percent).
Strength Statistics:
US Dollar Index (57.8 percent) vs US Dollar Index previous week (57.4 percent)
EuroFX (66.7 percent) vs EuroFX previous week (58.2 percent)
British Pound Sterling (36.5 percent) vs British Pound Sterling previous week (44.5 percent)
Japanese Yen (0.0 percent) vs Japanese Yen previous week (14.5 percent)
Swiss Franc (1.4 percent) vs Swiss Franc previous week (8.7 percent)
Canadian Dollar (0.0 percent) vs Canadian Dollar previous week (2.3 percent)
Australian Dollar (23.8 percent) vs Australian Dollar previous week (28.7 percent)
New Zealand Dollar (11.0 percent) vs New Zealand Dollar previous week (16.5 percent)
Mexican Peso (65.6 percent) vs Mexican Peso previous week (61.6 percent)
Brazilian Real (75.6 percent) vs Brazilian Real previous week (68.9 percent)
Bitcoin (46.2 percent) vs Bitcoin previous week (41.2 percent)
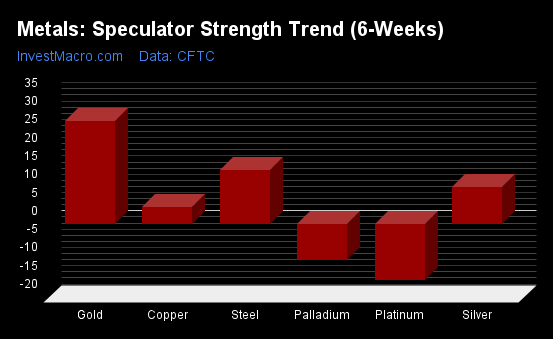
Brazilian Real & EuroFX top the 6-Week Strength Trends

COT Strength Score Trends (or move index, calculates the 6-week changes in strength scores) showed that the Brazilian Real (19 percent) and the EuroFX (13 percent) lead the past six weeks trends for the currencies. The Australian Dollar (10 percent) and the US Dollar Index (2 percent) represent the next highest positive movers in the trends data.
The Bitcoin (-36 percent) leads the downside trend scores currently with the Canadian Dollar (-25 percent), New Zealand Dollar (-24 percent) and the British Pound (-15 percent) following next with lower trend scores.
Strength Trend Statistics:
US Dollar Index (1.5 percent) vs US Dollar Index previous week (4.5 percent)
EuroFX (12.8 percent) vs EuroFX previous week (-4.0 percent)
British Pound Sterling (-14.6 percent) vs British Pound Sterling previous week (-22.2 percent)
Japanese Yen (-9.0 percent) vs Japanese Yen previous week (3.0 percent)
Swiss Franc (-9.6 percent) vs Swiss Franc previous week (-23.7 percent)
Canadian Dollar (-25.4 percent) vs Canadian Dollar previous week (-29.4 percent)
Australian Dollar (10.1 percent) vs Australian Dollar previous week (19.5 percent)
New Zealand Dollar (-24.4 percent) vs New Zealand Dollar previous week (0.6 percent)
Mexican Peso (-12.9 percent) vs Mexican Peso previous week (-14.6 percent)
Brazilian Real (19.5 percent) vs Brazilian Real previous week (14.3 percent)
Bitcoin (-36.1 percent) vs Bitcoin previous week (-52.2 percent)
Individual COT Forex Markets:
US Dollar Index Futures:
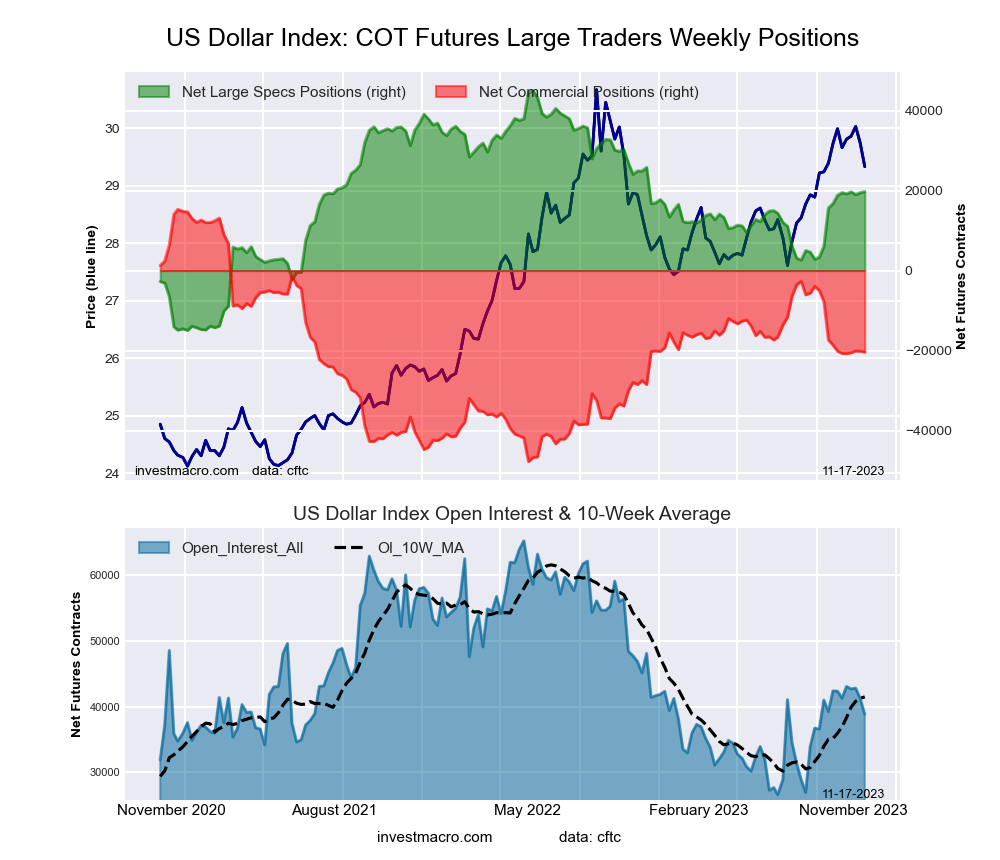 The US Dollar Index large speculator standing this week was a net position of 19,734 contracts in the data reported through Tuesday. This was a weekly advance of 263 contracts from the previous week which had a total of 19,471 net contracts.
This week’s current strength score (the trader positioning range over the past three years, measured from 0 to 100) shows the speculators are currently Bullish with a score of 57.8 percent. The commercials are Bearish with a score of 43.4 percent and the small traders (not shown in chart) are Bearish-Extreme with a score of 13.2 percent.
Price Trend-Following Model: Uptrend
Our weekly trend-following model classifies the current market price position as: Uptrend. The current action for the model is considered to be: Hold – Maintain Long Position.
| US DOLLAR INDEX Statistics | SPECULATORS | COMMERCIALS | SMALL TRADERS |
| – Percent of Open Interest Longs: | 70.2 | 17.8 | 9.3 |
| – Percent of Open Interest Shorts: | 19.4 | 70.3 | 7.6 |
| – Net Position: | 19,734 | -20,378 | 644 |
| – Gross Longs: | 27,271 | 6,917 | 3,615 |
| – Gross Shorts: | 7,537 | 27,295 | 2,971 |
| – Long to Short Ratio: | 3.6 to 1 | 0.3 to 1 | 1.2 to 1 |
| NET POSITION TREND: | | | |
| – Strength Index Score (3 Year Range Pct): | 57.8 | 43.4 | 13.2 |
| – Strength Index Reading (3 Year Range): | Bullish | Bearish | Bearish-Extreme |
| NET POSITION MOVEMENT INDEX: | | | |
| – 6-Week Change in Strength Index: | 1.5 | -0.3 | -8.8 |
Euro Currency Futures:
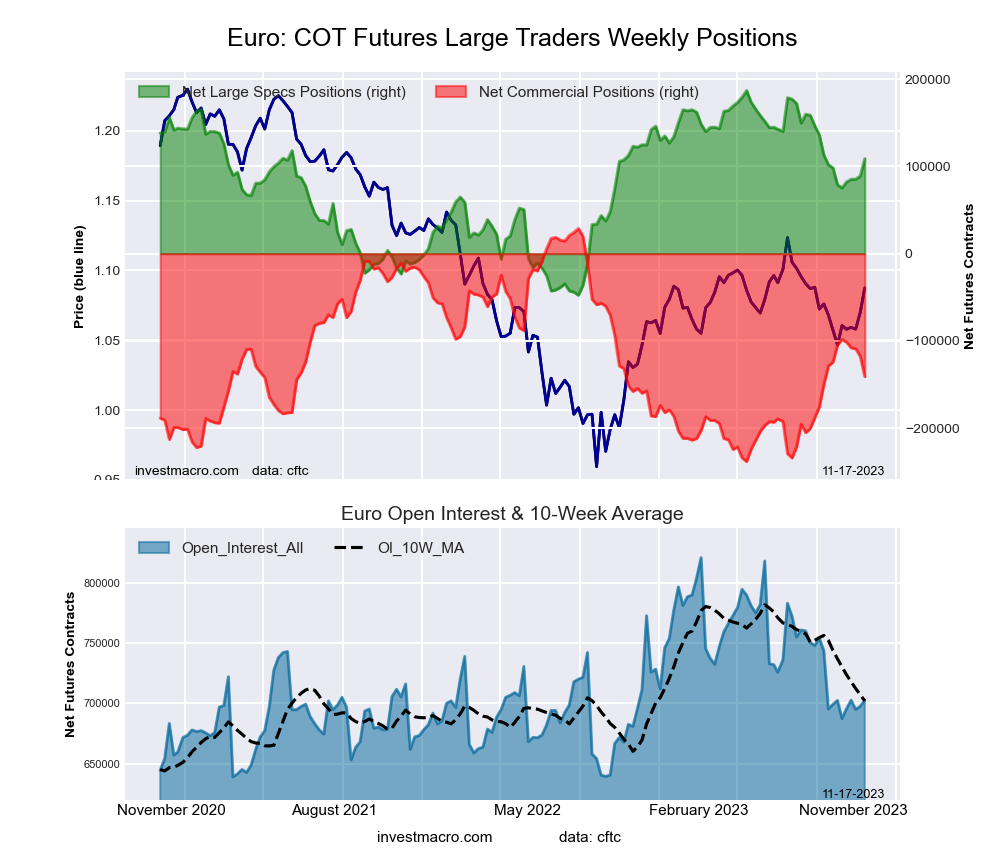 The Euro Currency large speculator standing this week was a net position of 108,907 contracts in the data reported through Tuesday. This was a weekly rise of 19,851 contracts from the previous week which had a total of 89,056 net contracts.
This week’s current strength score (the trader positioning range over the past three years, measured from 0 to 100) shows the speculators are currently Bullish with a score of 66.7 percent. The commercials are Bearish with a score of 36.4 percent and the small traders (not shown in chart) are Bearish with a score of 30.2 percent.
Price Trend-Following Model: Weak Downtrend (Possible Trend Change)
Our weekly trend-following model classifies the current market price position as: Weak Downtrend. The current action for the model is considered to be: Hold – Maintain Short Position.
| EURO Currency Statistics | SPECULATORS | COMMERCIALS | SMALL TRADERS |
| – Percent of Open Interest Longs: | 31.5 | 54.3 | 11.9 |
| – Percent of Open Interest Shorts: | 16.0 | 74.4 | 7.4 |
| – Net Position: | 108,907 | -140,987 | 32,080 |
| – Gross Longs: | 221,190 | 381,765 | 83,714 |
| – Gross Shorts: | 112,283 | 522,752 | 51,634 |
| – Long to Short Ratio: | 2.0 to 1 | 0.7 to 1 | 1.6 to 1 |
| NET POSITION TREND: | | | |
| – Strength Index Score (3 Year Range Pct): | 66.7 | 36.4 | 30.2 |
| – Strength Index Reading (3 Year Range): | Bullish | Bearish | Bearish |
| NET POSITION MOVEMENT INDEX: | | | |
| – 6-Week Change in Strength Index: | 12.8 | -13.6 | 10.0 |
British Pound Sterling Futures:
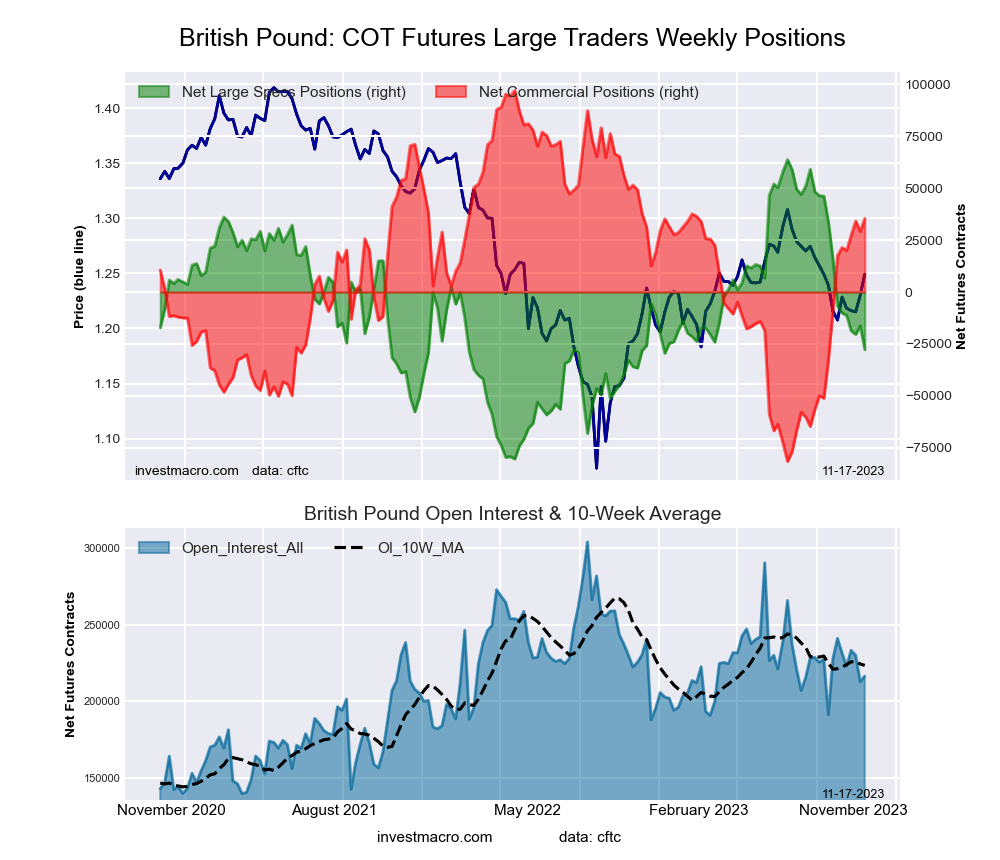 The British Pound Sterling large speculator standing this week was a net position of -27,730 contracts in the data reported through Tuesday. This was a weekly fall of -11,478 contracts from the previous week which had a total of -16,252 net contracts.
This week’s current strength score (the trader positioning range over the past three years, measured from 0 to 100) shows the speculators are currently Bearish with a score of 36.5 percent. The commercials are Bullish with a score of 65.5 percent and the small traders (not shown in chart) are Bearish with a score of 42.9 percent.
Price Trend-Following Model: Downtrend
Our weekly trend-following model classifies the current market price position as: Downtrend. The current action for the model is considered to be: Hold – Maintain Short Position.
| BRITISH POUND Statistics | SPECULATORS | COMMERCIALS | SMALL TRADERS |
| – Percent of Open Interest Longs: | 24.4 | 60.1 | 12.2 |
| – Percent of Open Interest Shorts: | 37.2 | 43.7 | 15.8 |
| – Net Position: | -27,730 | 35,439 | -7,709 |
| – Gross Longs: | 52,797 | 130,004 | 26,403 |
| – Gross Shorts: | 80,527 | 94,565 | 34,112 |
| – Long to Short Ratio: | 0.7 to 1 | 1.4 to 1 | 0.8 to 1 |
| NET POSITION TREND: | | | |
| – Strength Index Score (3 Year Range Pct): | 36.5 | 65.5 | 42.9 |
| – Strength Index Reading (3 Year Range): | Bearish | Bullish | Bearish |
| NET POSITION MOVEMENT INDEX: | | | |
| – 6-Week Change in Strength Index: | -14.6 | 10.0 | 6.2 |
Japanese Yen Futures:
 The Japanese Yen large speculator standing this week was a net position of -130,249 contracts in the data reported through Tuesday. This was a weekly reduction of -26,209 contracts from the previous week which had a total of -104,040 net contracts.
This week’s current strength score (the trader positioning range over the past three years, measured from 0 to 100) shows the speculators are currently Bearish-Extreme with a score of 0.0 percent. The commercials are Bullish-Extreme with a score of 100.0 percent and the small traders (not shown in chart) are Bearish with a score of 47.3 percent.
Price Trend-Following Model: Downtrend
Our weekly trend-following model classifies the current market price position as: Downtrend. The current action for the model is considered to be: Hold – Maintain Short Position.
| JAPANESE YEN Statistics | SPECULATORS | COMMERCIALS | SMALL TRADERS |
| – Percent of Open Interest Longs: | 10.1 | 73.0 | 15.4 |
| – Percent of Open Interest Shorts: | 57.7 | 24.3 | 16.5 |
| – Net Position: | -130,249 | 133,272 | -3,023 |
| – Gross Longs: | 27,772 | 199,890 | 42,074 |
| – Gross Shorts: | 158,021 | 66,618 | 45,097 |
| – Long to Short Ratio: | 0.2 to 1 | 3.0 to 1 | 0.9 to 1 |
| NET POSITION TREND: | | | |
| – Strength Index Score (3 Year Range Pct): | 0.0 | 100.0 | 47.3 |
| – Strength Index Reading (3 Year Range): | Bearish-Extreme | Bullish-Extreme | Bearish |
| NET POSITION MOVEMENT INDEX: | | | |
| – 6-Week Change in Strength Index: | -9.0 | 7.5 | 1.7 |
Swiss Franc Futures:
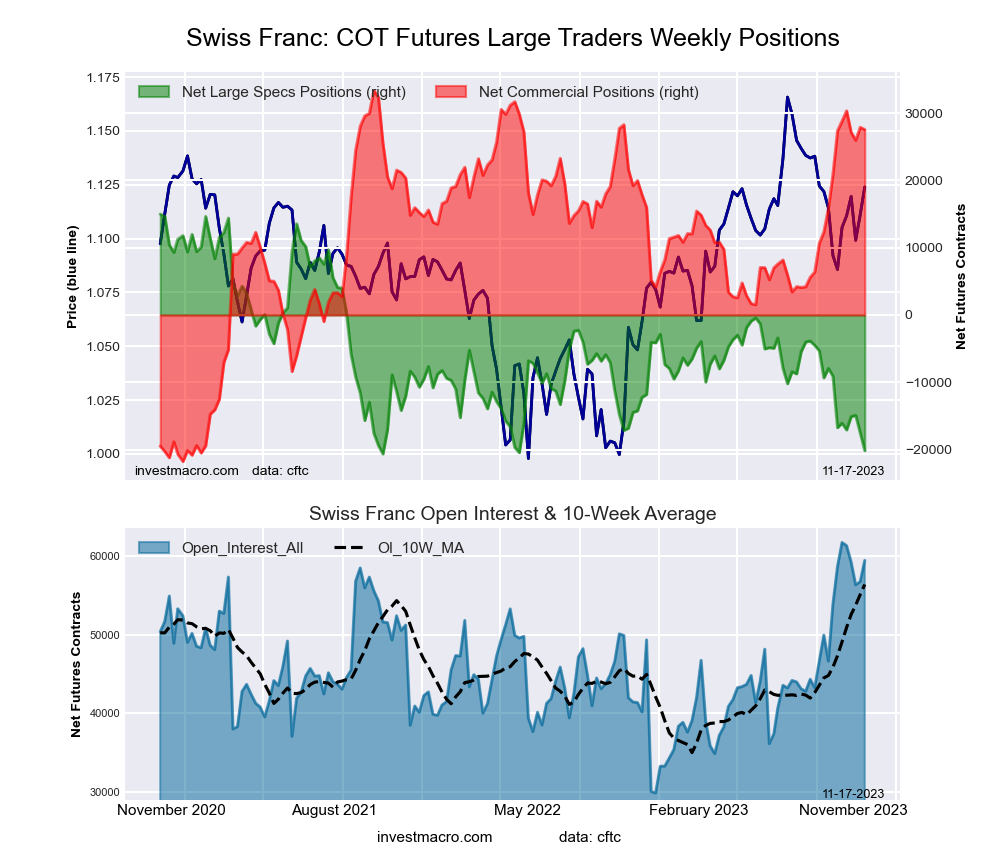 The Swiss Franc large speculator standing this week was a net position of -20,151 contracts in the data reported through Tuesday. This was a weekly decrease of -2,589 contracts from the previous week which had a total of -17,562 net contracts.
This week’s current strength score (the trader positioning range over the past three years, measured from 0 to 100) shows the speculators are currently Bearish-Extreme with a score of 1.4 percent. The commercials are Bullish-Extreme with a score of 89.5 percent and the small traders (not shown in chart) are Bearish with a score of 34.6 percent.
Price Trend-Following Model: Weak Downtrend (Possible Trend Change)
Our weekly trend-following model classifies the current market price position as: Weak Downtrend. The current action for the model is considered to be: Hold – Maintain Short Position.
| SWISS FRANC Statistics | SPECULATORS | COMMERCIALS | SMALL TRADERS |
| – Percent of Open Interest Longs: | 9.3 | 71.0 | 19.5 |
| – Percent of Open Interest Shorts: | 43.2 | 24.7 | 32.0 |
| – Net Position: | -20,151 | 27,543 | -7,392 |
| – Gross Longs: | 5,515 | 42,240 | 11,612 |
| – Gross Shorts: | 25,666 | 14,697 | 19,004 |
| – Long to Short Ratio: | 0.2 to 1 | 2.9 to 1 | 0.6 to 1 |
| NET POSITION TREND: | | | |
| – Strength Index Score (3 Year Range Pct): | 1.4 | 89.5 | 34.6 |
| – Strength Index Reading (3 Year Range): | Bearish-Extreme | Bullish-Extreme | Bearish |
| NET POSITION MOVEMENT INDEX: | | | |
| – 6-Week Change in Strength Index: | -9.6 | 0.3 | 11.6 |
Canadian Dollar Futures:
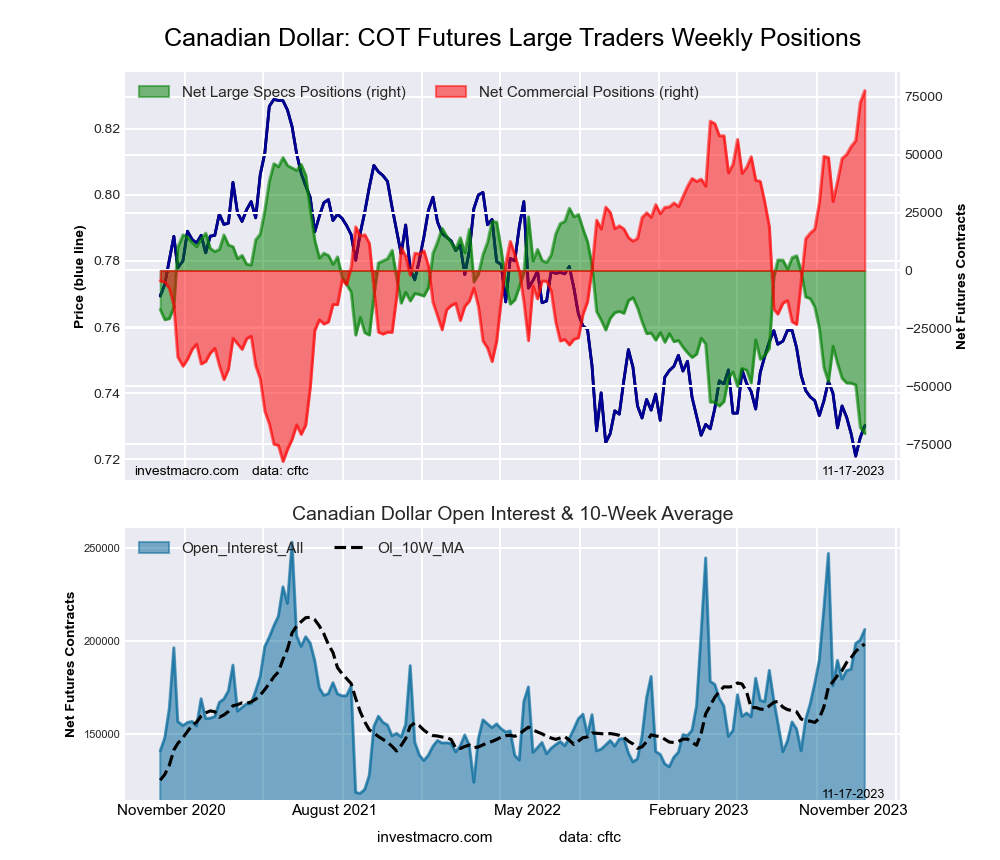 The Canadian Dollar large speculator standing this week was a net position of -70,403 contracts in the data reported through Tuesday. This was a weekly lowering of -2,682 contracts from the previous week which had a total of -67,721 net contracts.
This week’s current strength score (the trader positioning range over the past three years, measured from 0 to 100) shows the speculators are currently Bearish-Extreme with a score of 0.0 percent. The commercials are Bullish-Extreme with a score of 100.0 percent and the small traders (not shown in chart) are Bearish-Extreme with a score of 6.6 percent.
Price Trend-Following Model: Downtrend
Our weekly trend-following model classifies the current market price position as: Downtrend. The current action for the model is considered to be: Hold – Maintain Short Position.
| CANADIAN DOLLAR Statistics | SPECULATORS | COMMERCIALS | SMALL TRADERS |
| – Percent of Open Interest Longs: | 9.1 | 73.8 | 14.2 |
| – Percent of Open Interest Shorts: | 43.2 | 36.1 | 17.7 |
| – Net Position: | -70,403 | 77,698 | -7,295 |
| – Gross Longs: | 18,678 | 152,043 | 29,204 |
| – Gross Shorts: | 89,081 | 74,345 | 36,499 |
| – Long to Short Ratio: | 0.2 to 1 | 2.0 to 1 | 0.8 to 1 |
| NET POSITION TREND: | | | |
| – Strength Index Score (3 Year Range Pct): | 0.0 | 100.0 | 6.6 |
| – Strength Index Reading (3 Year Range): | Bearish-Extreme | Bullish-Extreme | Bearish-Extreme |
| NET POSITION MOVEMENT INDEX: | | | |
| – 6-Week Change in Strength Index: | -25.4 | 24.4 | -19.7 |
Australian Dollar Futures:
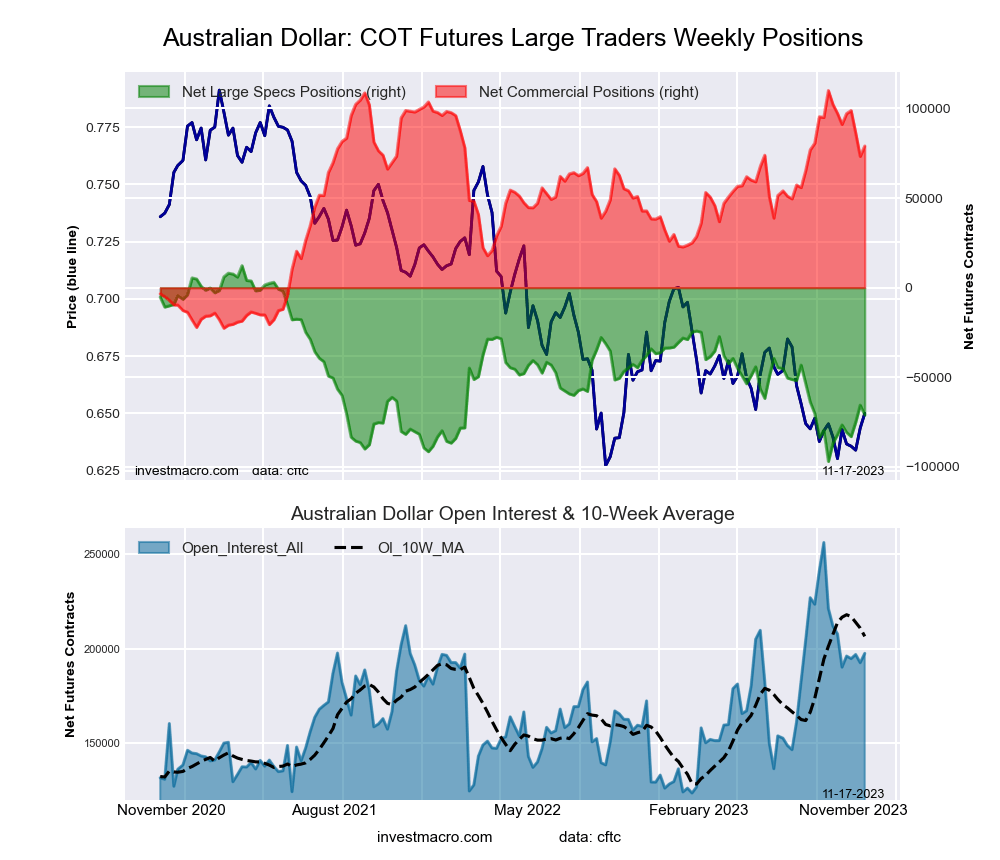 The Australian Dollar large speculator standing this week was a net position of -70,956 contracts in the data reported through Tuesday. This was a weekly decline of -5,393 contracts from the previous week which had a total of -65,563 net contracts.
This week’s current strength score (the trader positioning range over the past three years, measured from 0 to 100) shows the speculators are currently Bearish with a score of 23.8 percent. The commercials are Bullish with a score of 76.7 percent and the small traders (not shown in chart) are Bearish with a score of 32.7 percent.
Price Trend-Following Model: Weak Downtrend (Possible Trend Change)
Our weekly trend-following model classifies the current market price position as: Weak Downtrend. The current action for the model is considered to be: Hold – Maintain Short Position.
| AUSTRALIAN DOLLAR Statistics | SPECULATORS | COMMERCIALS | SMALL TRADERS |
| – Percent of Open Interest Longs: | 16.6 | 67.2 | 11.0 |
| – Percent of Open Interest Shorts: | 52.5 | 27.1 | 15.2 |
| – Net Position: | -70,956 | 79,057 | -8,101 |
| – Gross Longs: | 32,728 | 132,639 | 21,818 |
| – Gross Shorts: | 103,684 | 53,582 | 29,919 |
| – Long to Short Ratio: | 0.3 to 1 | 2.5 to 1 | 0.7 to 1 |
| NET POSITION TREND: | | | |
| – Strength Index Score (3 Year Range Pct): | 23.8 | 76.7 | 32.7 |
| – Strength Index Reading (3 Year Range): | Bearish | Bullish | Bearish |
| NET POSITION MOVEMENT INDEX: | | | |
| – 6-Week Change in Strength Index: | 10.1 | -13.7 | 17.5 |
New Zealand Dollar Futures:
 The New Zealand Dollar large speculator standing this week was a net position of -17,034 contracts in the data reported through Tuesday. This was a weekly decline of -2,094 contracts from the previous week which had a total of -14,940 net contracts.
This week’s current strength score (the trader positioning range over the past three years, measured from 0 to 100) shows the speculators are currently Bearish-Extreme with a score of 11.0 percent. The commercials are Bullish-Extreme with a score of 88.3 percent and the small traders (not shown in chart) are Bearish with a score of 24.6 percent.
Price Trend-Following Model: Downtrend
Our weekly trend-following model classifies the current market price position as: Downtrend. The current action for the model is considered to be: Hold – Maintain Short Position.
| NEW ZEALAND DOLLAR Statistics | SPECULATORS | COMMERCIALS | SMALL TRADERS |
| – Percent of Open Interest Longs: | 17.7 | 73.8 | 6.2 |
| – Percent of Open Interest Shorts: | 51.8 | 35.4 | 10.5 |
| – Net Position: | -17,034 | 19,170 | -2,136 |
| – Gross Longs: | 8,818 | 36,817 | 3,107 |
| – Gross Shorts: | 25,852 | 17,647 | 5,243 |
| – Long to Short Ratio: | 0.3 to 1 | 2.1 to 1 | 0.6 to 1 |
| NET POSITION TREND: | | | |
| – Strength Index Score (3 Year Range Pct): | 11.0 | 88.3 | 24.6 |
| – Strength Index Reading (3 Year Range): | Bearish-Extreme | Bullish-Extreme | Bearish |
| NET POSITION MOVEMENT INDEX: | | | |
| – 6-Week Change in Strength Index: | -24.4 | 19.2 | 11.1 |
Mexican Peso Futures:
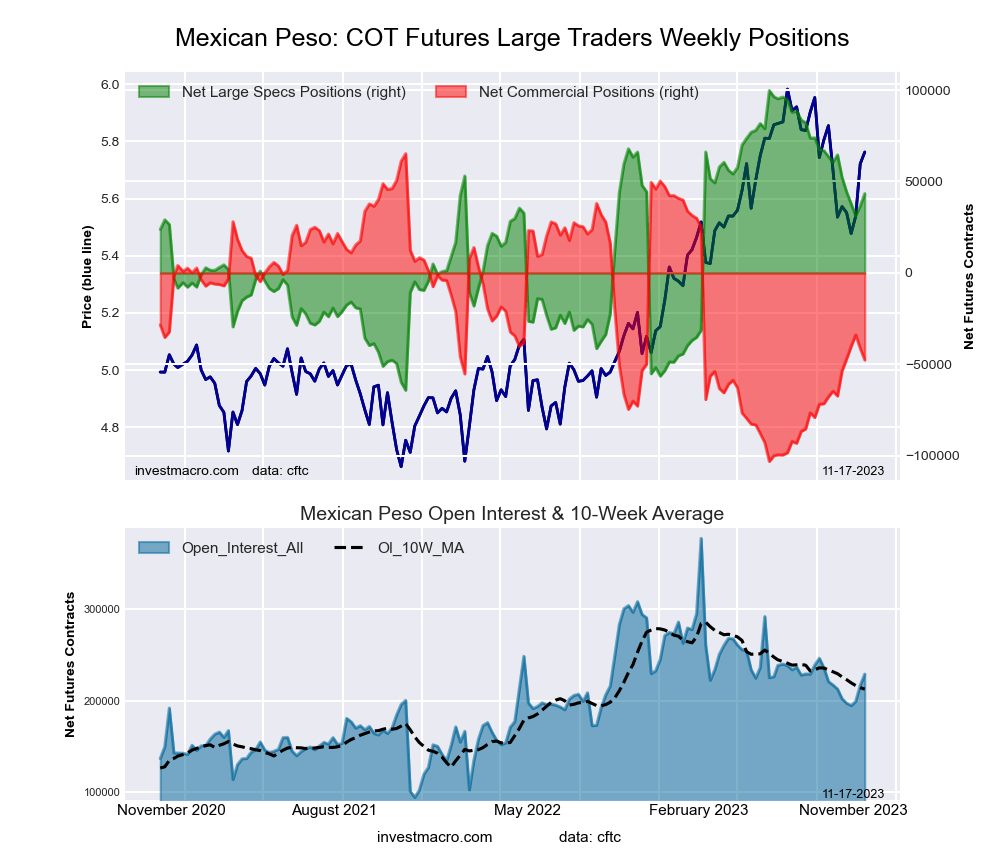 The Mexican Peso large speculator standing this week was a net position of 43,382 contracts in the data reported through Tuesday. This was a weekly rise of 6,642 contracts from the previous week which had a total of 36,740 net contracts.
This week’s current strength score (the trader positioning range over the past three years, measured from 0 to 100) shows the speculators are currently Bullish with a score of 65.6 percent. The commercials are Bearish with a score of 33.0 percent and the small traders (not shown in chart) are Bearish with a score of 37.9 percent.
Price Trend-Following Model: Weak Downtrend (Possible Trend Change)
Our weekly trend-following model classifies the current market price position as: Weak Downtrend. The current action for the model is considered to be: Hold – Maintain Short Position.
| MEXICAN PESO Statistics | SPECULATORS | COMMERCIALS | SMALL TRADERS |
| – Percent of Open Interest Longs: | 34.6 | 60.6 | 3.0 |
| – Percent of Open Interest Shorts: | 15.6 | 81.4 | 1.2 |
| – Net Position: | 43,382 | -47,568 | 4,186 |
| – Gross Longs: | 79,162 | 138,716 | 6,874 |
| – Gross Shorts: | 35,780 | 186,284 | 2,688 |
| – Long to Short Ratio: | 2.2 to 1 | 0.7 to 1 | 2.6 to 1 |
| NET POSITION TREND: | | | |
| – Strength Index Score (3 Year Range Pct): | 65.6 | 33.0 | 37.9 |
| – Strength Index Reading (3 Year Range): | Bullish | Bearish | Bearish |
| NET POSITION MOVEMENT INDEX: | | | |
| – 6-Week Change in Strength Index: | -12.9 | 11.7 | 9.3 |
Brazilian Real Futures:
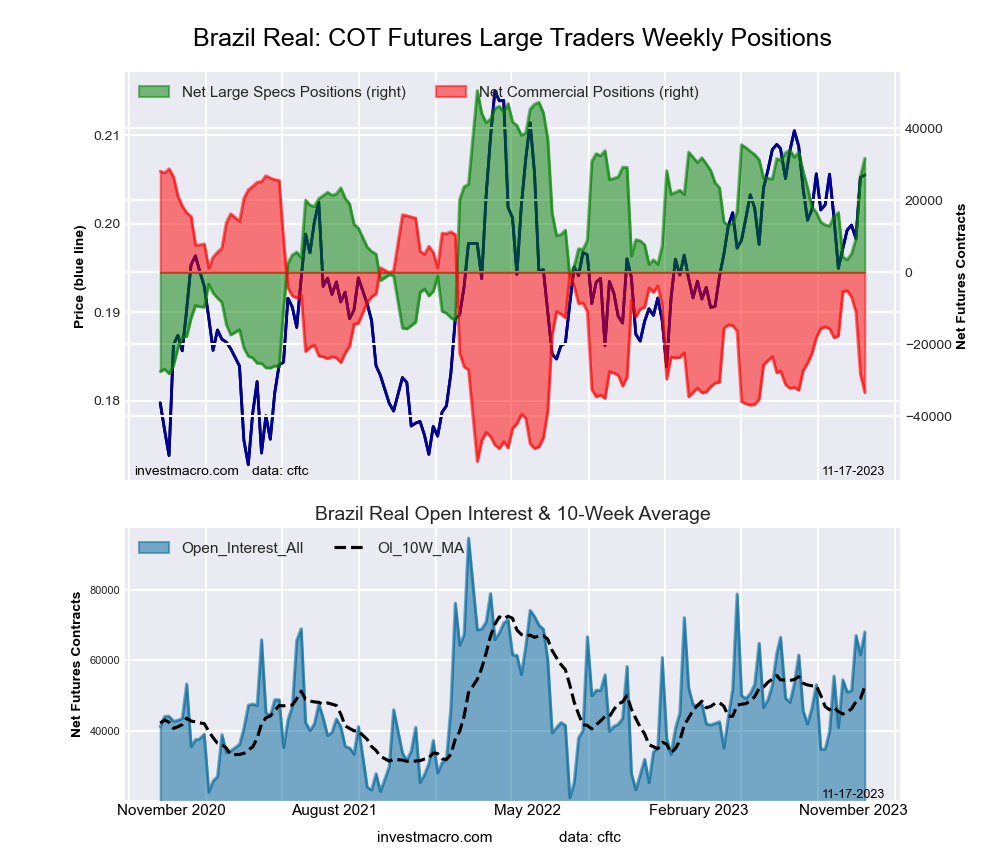 The Brazilian Real large speculator standing this week was a net position of 31,651 contracts in the data reported through Tuesday. This was a weekly lift of 5,100 contracts from the previous week which had a total of 26,551 net contracts.
This week’s current strength score (the trader positioning range over the past three years, measured from 0 to 100) shows the speculators are currently Bullish with a score of 75.6 percent. The commercials are Bearish with a score of 24.1 percent and the small traders (not shown in chart) are Bullish with a score of 50.8 percent.
Price Trend-Following Model: Weak Downtrend (Possible Trend Change)
Our weekly trend-following model classifies the current market price position as: Weak Downtrend. The current action for the model is considered to be: Hold – Maintain Short Position.
| BRAZIL REAL Statistics | SPECULATORS | COMMERCIALS | SMALL TRADERS |
| – Percent of Open Interest Longs: | 72.8 | 21.7 | 5.1 |
| – Percent of Open Interest Shorts: | 26.3 | 70.8 | 2.5 |
| – Net Position: | 31,651 | -33,408 | 1,757 |
| – Gross Longs: | 49,537 | 14,767 | 3,478 |
| – Gross Shorts: | 17,886 | 48,175 | 1,721 |
| – Long to Short Ratio: | 2.8 to 1 | 0.3 to 1 | 2.0 to 1 |
| NET POSITION TREND: | | | |
| – Strength Index Score (3 Year Range Pct): | 75.6 | 24.1 | 50.8 |
| – Strength Index Reading (3 Year Range): | Bullish | Bearish | Bullish |
| NET POSITION MOVEMENT INDEX: | | | |
| – 6-Week Change in Strength Index: | 19.5 | -19.9 | 7.0 |
Bitcoin Futures:
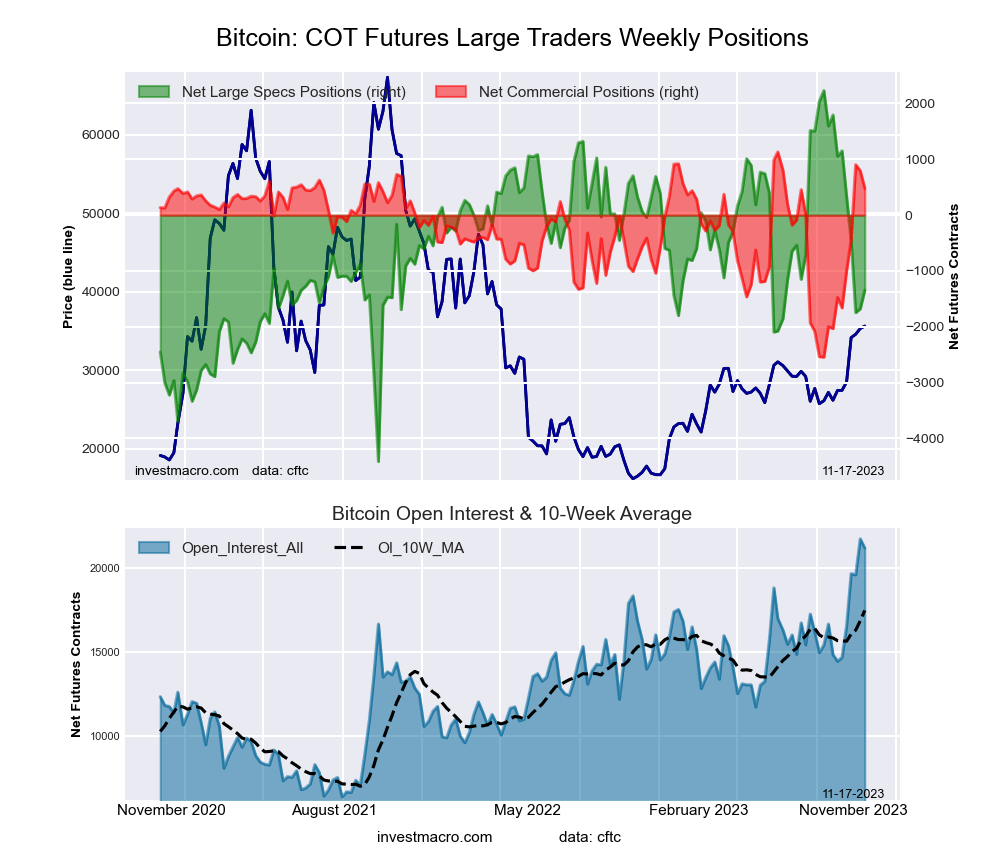 The Bitcoin large speculator standing this week was a net position of -1,344 contracts in the data reported through Tuesday. This was a weekly rise of 333 contracts from the previous week which had a total of -1,677 net contracts.
This week’s current strength score (the trader positioning range over the past three years, measured from 0 to 100) shows the speculators are currently Bearish with a score of 46.2 percent. The commercials are Bullish-Extreme with a score of 82.3 percent and the small traders (not shown in chart) are Bearish with a score of 32.6 percent.
Price Trend-Following Model: Strong Uptrend
Our weekly trend-following model classifies the current market price position as: Strong Uptrend. The current action for the model is considered to be: Hold – Maintain Long Position.
| BITCOIN Statistics | SPECULATORS | COMMERCIALS | SMALL TRADERS |
| – Percent of Open Interest Longs: | 75.2 | 5.2 | 7.6 |
| – Percent of Open Interest Shorts: | 81.5 | 2.9 | 3.5 |
| – Net Position: | -1,344 | 481 | 863 |
| – Gross Longs: | 15,939 | 1,105 | 1,609 |
| – Gross Shorts: | 17,283 | 624 | 746 |
| – Long to Short Ratio: | 0.9 to 1 | 1.8 to 1 | 2.2 to 1 |
| NET POSITION TREND: | | | |
| – Strength Index Score (3 Year Range Pct): | 46.2 | 82.3 | 32.6 |
| – Strength Index Reading (3 Year Range): | Bearish | Bullish-Extreme | Bearish |
| NET POSITION MOVEMENT INDEX: | | | |
| – 6-Week Change in Strength Index: | -36.1 | 53.2 | 10.1 |
Article By InvestMacro – Receive our weekly COT Newsletter
*COT Report: The COT data, released weekly to the public each Friday, is updated through the most recent Tuesday (data is 3 days old) and shows a quick view of how large speculators or non-commercials (for-profit traders) were positioned in the futures markets.
The CFTC categorizes trader positions according to commercial hedgers (traders who use futures contracts for hedging as part of the business), non-commercials (large traders who speculate to realize trading profits) and nonreportable traders (usually small traders/speculators) as well as their open interest (contracts open in the market at time of reporting). See CFTC criteria here.


