By JustMarkets
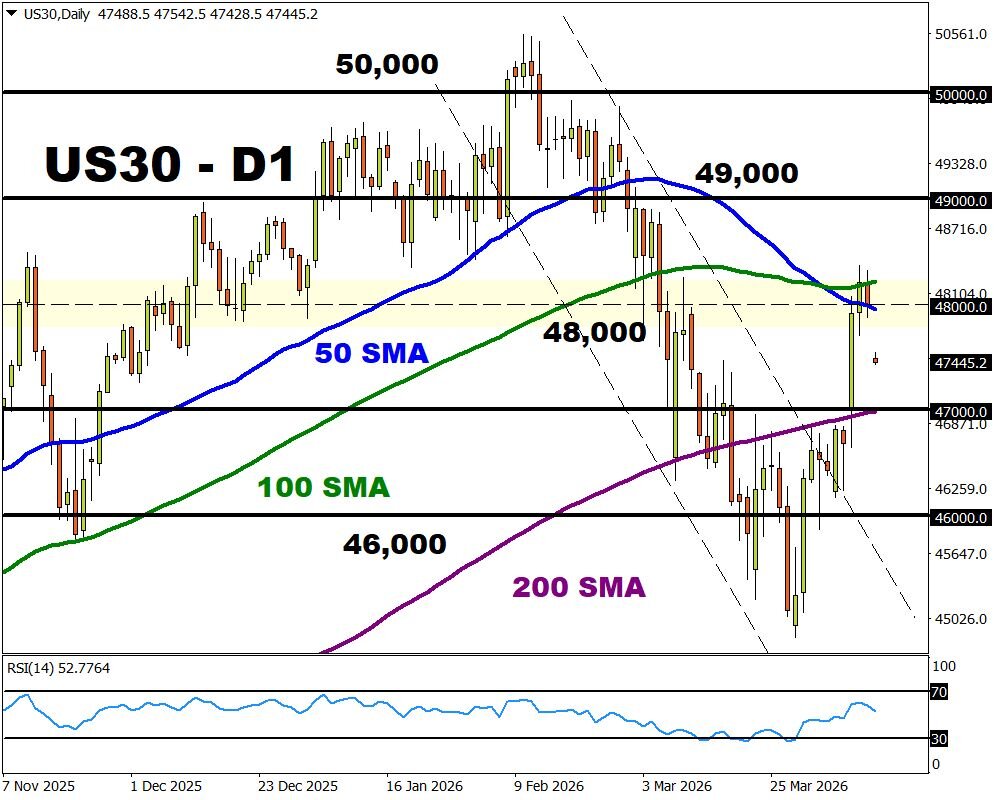
By the end of the day, the Dow Jones (US30) fell by 0.56% (weekly result +3.11%). The S&P 500 (US500) declined by 0.11% (weekly result +3.48%). The tech‑heavy NASDAQ (US100) closed Friday up 0.14% (weekly result +4.03%). The upcoming week will be a moment of truth for the US market, as the geopolitical agenda collides with the hard numbers of corporate reality. Vice President J.D. Vance conducts difficult negotiations in Islamabad, attempting to turn the fragile ceasefire into a stable agreement on the Strait of Hormuz. Wall Street is preparing for the start of earnings season. Reports from major banks, including JPMorgan Chase, Goldman Sachs, and Morgan Stanley, will show how well the financial sector has adapted to high volatility and interest rates that the Federal Reserve continues to hold at restrictive levels.
Investors are particularly concerned about the upcoming Producer Price Index (PPI) data. The Headline Index is expected to jump 1.2% month‑over‑month, confirming that the energy shock from the Middle East conflict is already filtering through production chains. Attention to the tech sector will peak at the end of the week when TSMC and Netflix release their earnings. These reports will serve as a litmus test for global semiconductor demand and consumer confidence amid inflationary pressure.
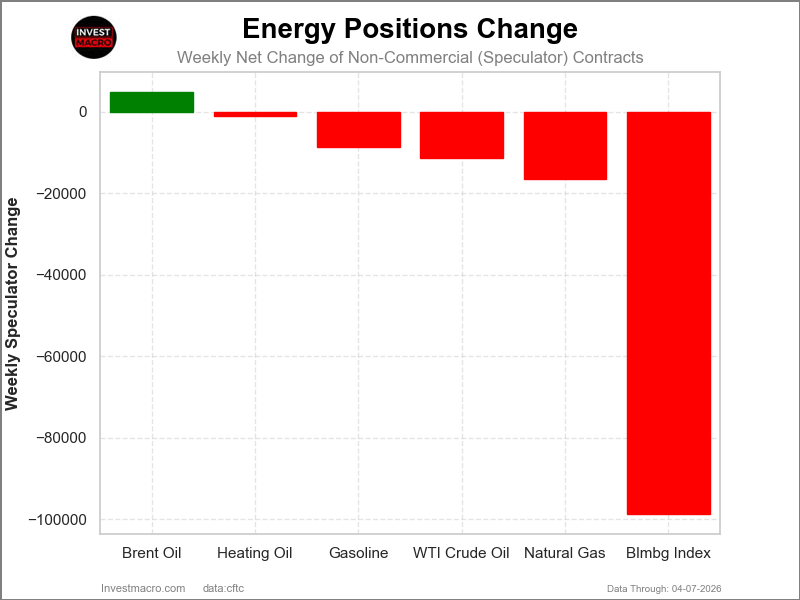
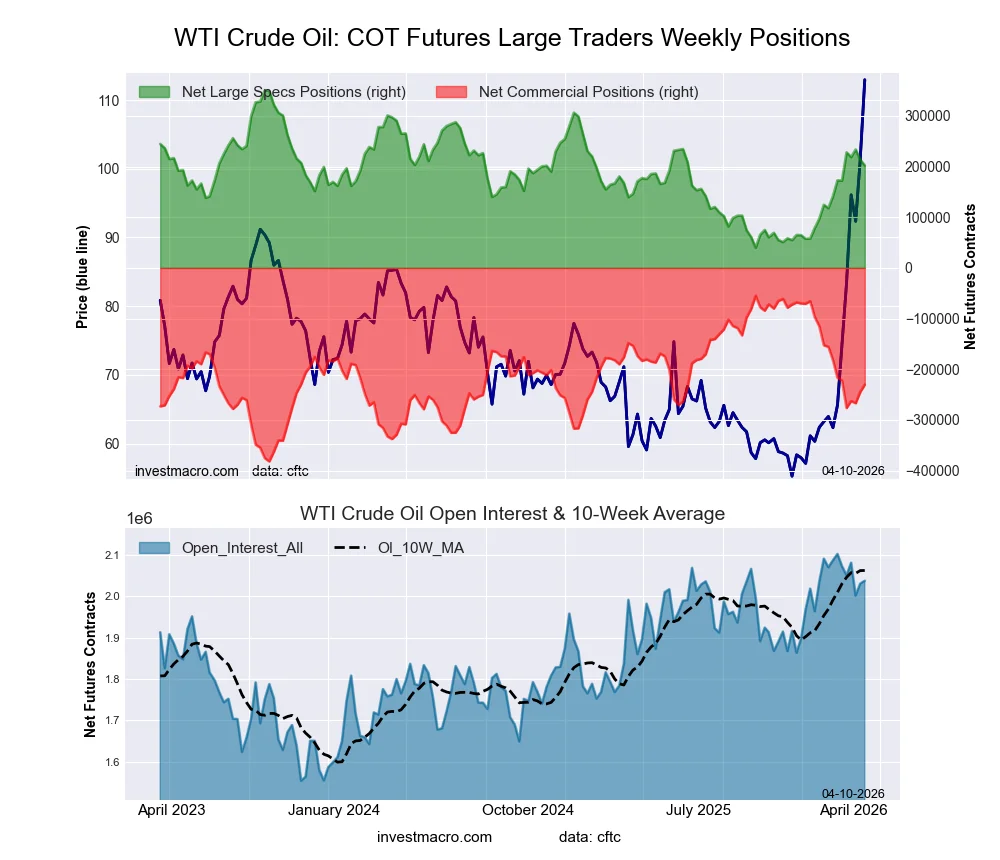
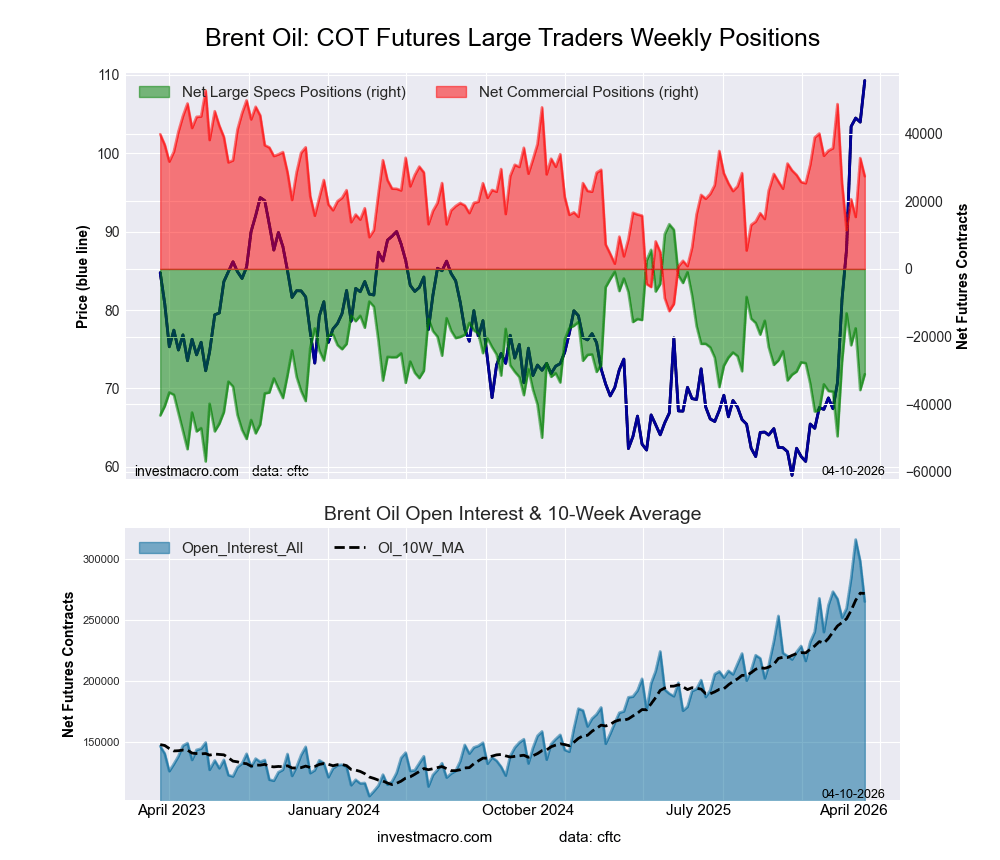
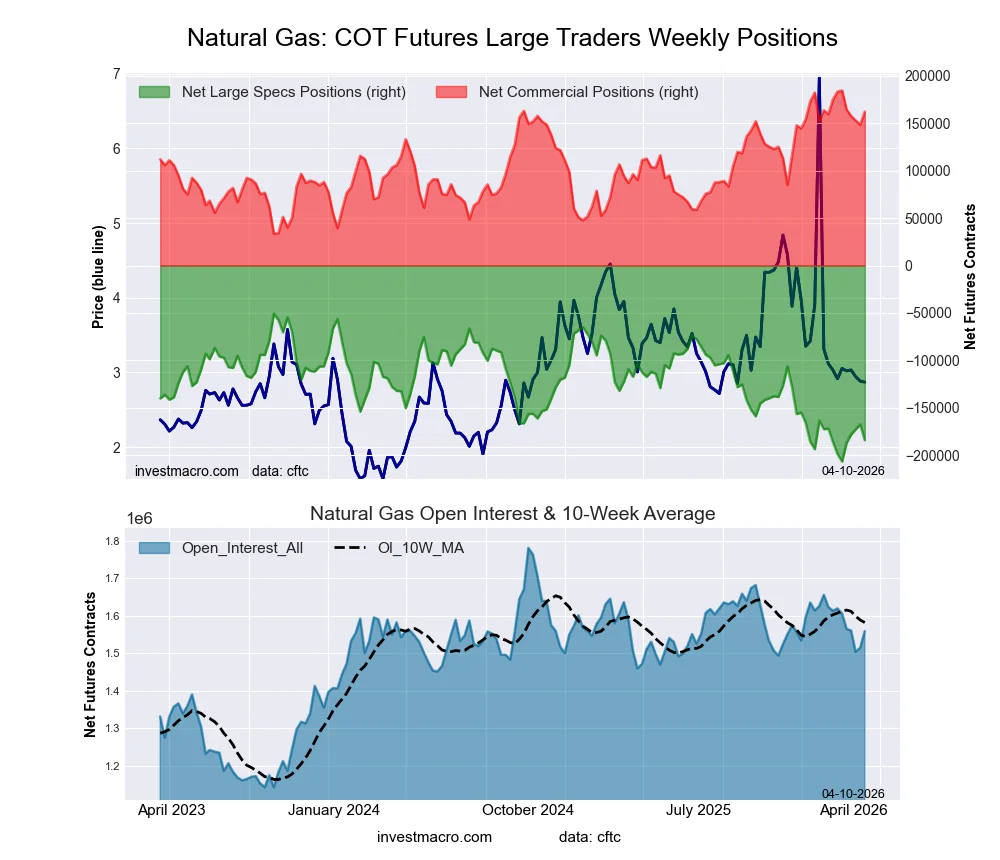
However, the situation remains extremely tense following the diplomatic marathon in Islamabad. Direct negotiations between the US delegation led by Vice President J.D. Vance and Iranian officials ended without a breakthrough. Tehran continues to maintain the blockade of the Strait of Hormuz, which has already caused unprecedented disruptions in global oil and gas supplies. Adding fuel to the fire is Donald Trump’s tough rhetoric, warning of new fees for ships in the region – effectively turning the strait into a “toll corridor” under Iran’s control.
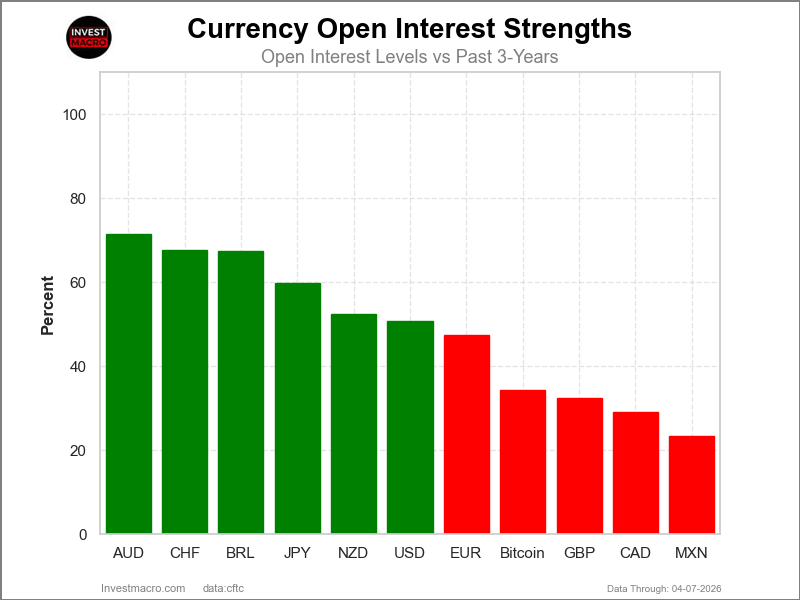
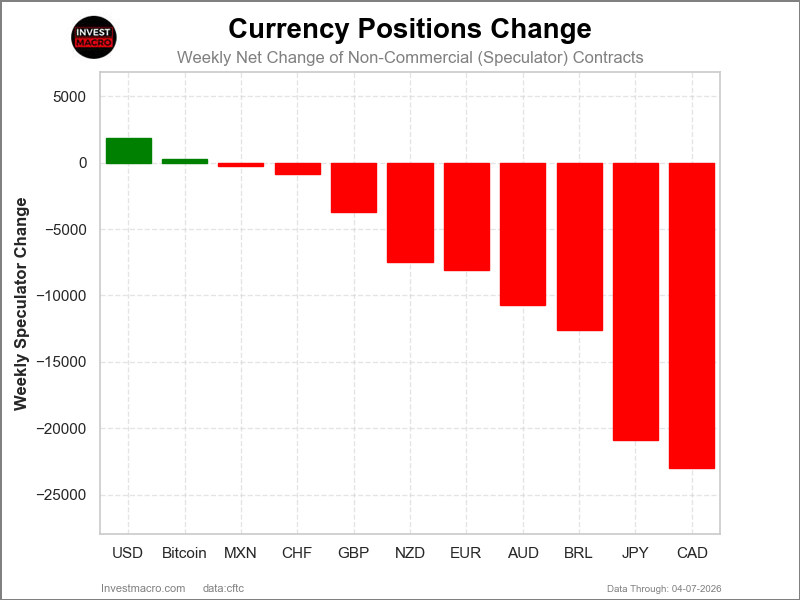
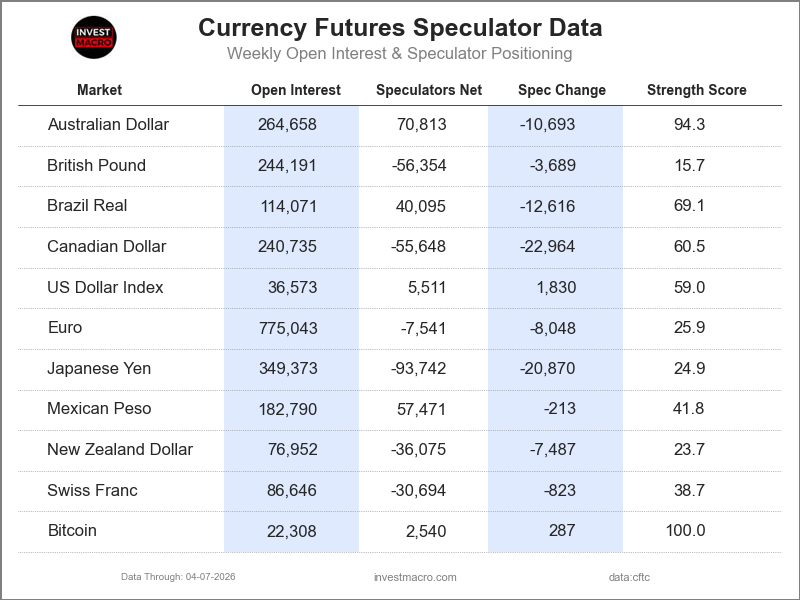
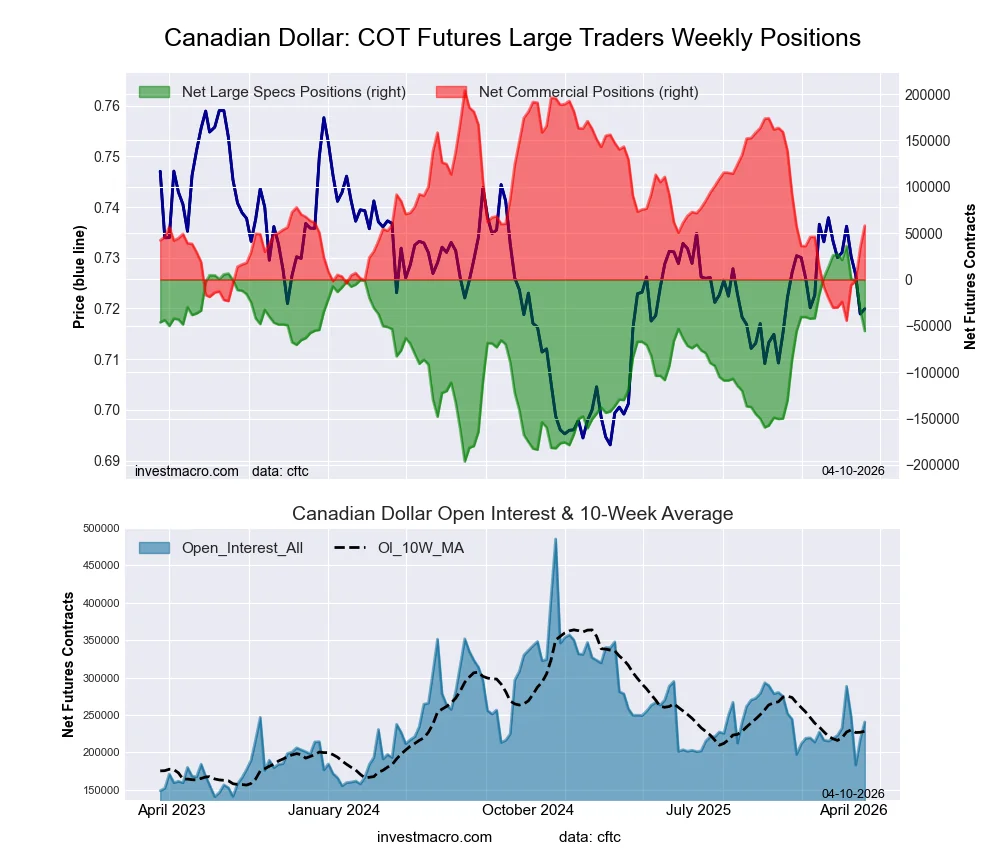
On Friday, the Canadian dollar (CAD) weakened slightly, falling 0.16% to 1.38 per US dollar. The main pressure on the loonie came from a combination of geopolitical calm and disappointing domestic data. Although the unemployment rate stabilized at 6.7%, analysts note that this was driven more by a decline in labor‑force participation than by genuine hiring momentum.
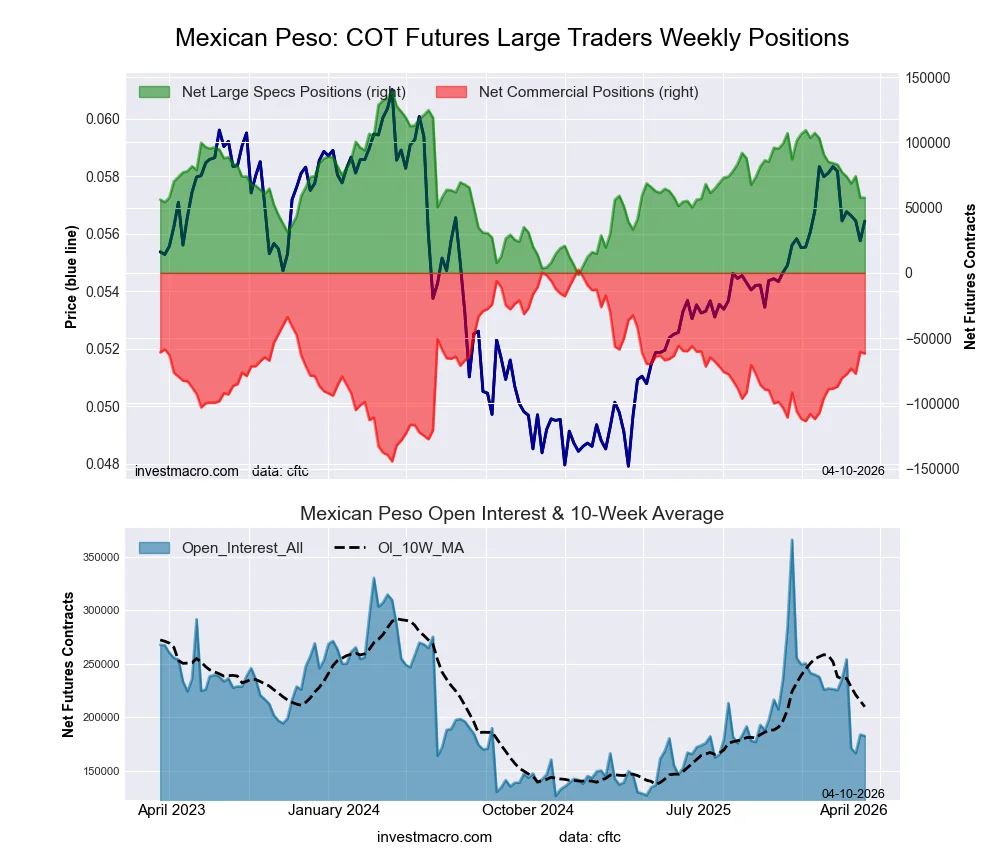
The Mexican peso (MXN) ended the trading week with a 0.3% gain, closing at 17.31 per dollar, reaffirming its status as one of the most resilient emerging‑market currencies. The primary driver of the peso’s strength remains the carry‑trade strategy. The large interest‑rate differential between Banxico and the US Federal Reserve makes the peso highly attractive to investors seeking yield in an environment of relative stability.
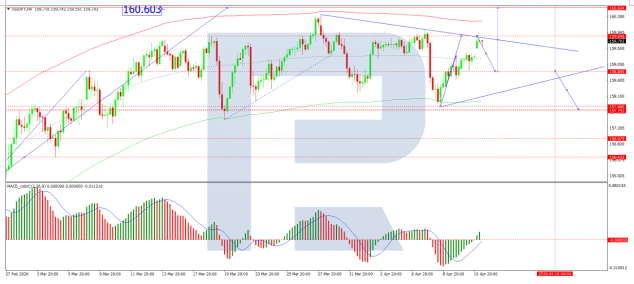
By the end of the day, Germany’s DAX (DE40) slipped by 0.01% (weekly +3.79%), France’s CAC 40 (FR40) rose by 0.17% (weekly +4.85%), Spain’s IBEX 35 (ES35) gained 0.55% (weekly +5.12%), and the UK’s FTSE 100 (UK100) closed down 0.03% (weekly +2.95%). This week, Europe’s main event will be the release of the final March inflation data, which will confirm the Eurozone’s transition into an energy‑shock phase. Inflation in Germany and the UK is expected to reflect a sharp rise in costs caused by the closure of the Strait of Hormuz and oil‑price volatility. Wholesale‑price data in Germany will serve as a leading indicator of how quickly the LNG shortage will spill into retail markets in the coming months. Alongside inflation reports, markets will assess the resilience of the real economy through February trade balance and industrial‑production data – both under scrutiny due to the impact of the 10% US tariffs imposed by the Trump administration.
On Europe’s political map, the central event is the parliamentary election in Hungary. Investors are awaiting the outcome of the contest between Viktor Orbán and opposition leader Péter Magyar, whose TISZA party, according to recent polls, has a chance to strip the ruling government of its majority. The result will determine whether Hungary retains its veto power on key EU policy issues or whether the architecture of European unity undergoes radical change.
In Asia, Japan’s Nikkei 225 (JP225) rose by 6.99% for the week, China’s FTSE China A50 (CHA50) gained 2.77%, Hong Kong’s Hang Seng (HK50) closed the week up 0.01%, and Australia’s ASX 200 (AU200) climbed 3.17%. This week, investor attention in the Asia‑Pacific region will focus on China, where a batch of macroeconomic data is expected to confirm the resilience of the world’s second‑largest economy. GDP growth for Q1 2026 is outlooked to accelerate to 5.0%, an important signal amid global instability. Despite expected slowdowns in retail sales and industrial production in March, a substantial trade surplus of 112 billion dollars and strong credit expansion (up to 3.4 trillion yuan) indicate that Beijing continues to successfully stimulate both domestic and external growth drivers. In Australia, the focus shifts to the labor market, where a stable unemployment rate of 4.3% and ongoing job creation support expectations of another RBA rate hike as early as May.
S&P 500 (US500) 6,816.89 −7.77 (−0.11%)
Dow Jones (US30) 23,803.95 −3.04 (−0.013%)
DAX (DE40) 23,803.95 −3.04 (−0.013%)
FTSE 100 (UK100) 10,600.53 −2.95 (−0.03%)
USD Index 98.70 −0.12 (−0.12%)
News feed for: 2026.04.13
- US Existing Home Sales (m/m) at 17:00 (GMT+3) – USD (MED)
By JustMarkets
This article reflects a personal opinion and should not be interpreted as an investment advice, and/or offer, and/or a persistent request for carrying out financial transactions, and/or a guarantee, and/or a forecast of future events.