Gold prices have continued their ascent, with a troy ounce of the precious metal reaching USD 2363. This rise is primarily fuelled by anticipated US employment data for June, which could significantly influence the Federal Reserve’s rate decisions.
Recent US economic indicators, including a contraction in the service sector and weaker-than-expected private sector employment figures from ADP, have painted a dovish picture regarding the Fed’s upcoming monetary policy moves. These factors contribute to the prevailing sentiment that the Fed might lower interest rates, with market probabilities favouring a cut by September currently standing at 73%.
Furthermore, ongoing political uncertainties in Europe, especially in France and the UK, affect the EUR exchange rate, thereby impacting the USD and indirectly influencing gold prices. Additionally, persistent geopolitical tensions in the Middle East continue to drive demand for safe-haven assets like gold.
Technical analysis of XAU/USD
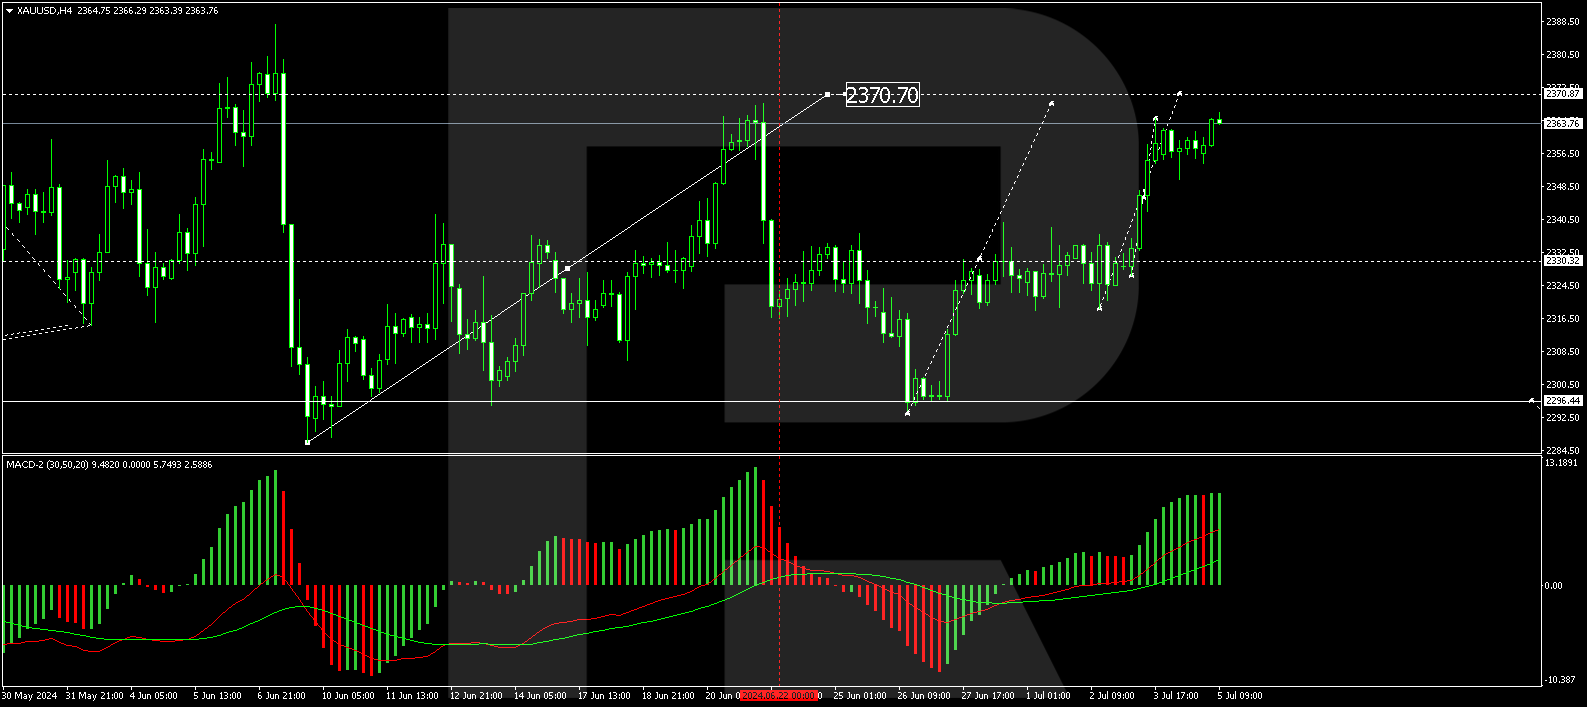
Gold (XAUUSD) is currently undergoing a correction that is anticipated to conclude at the level of 2370.70. Post-correction, the market might experience a decline towards 2295.00. A break below this could extend losses to 2222.22, setting a local target. This bearish potential is supported by the MACD indicator, which, although above zero, shows signs of peaking.
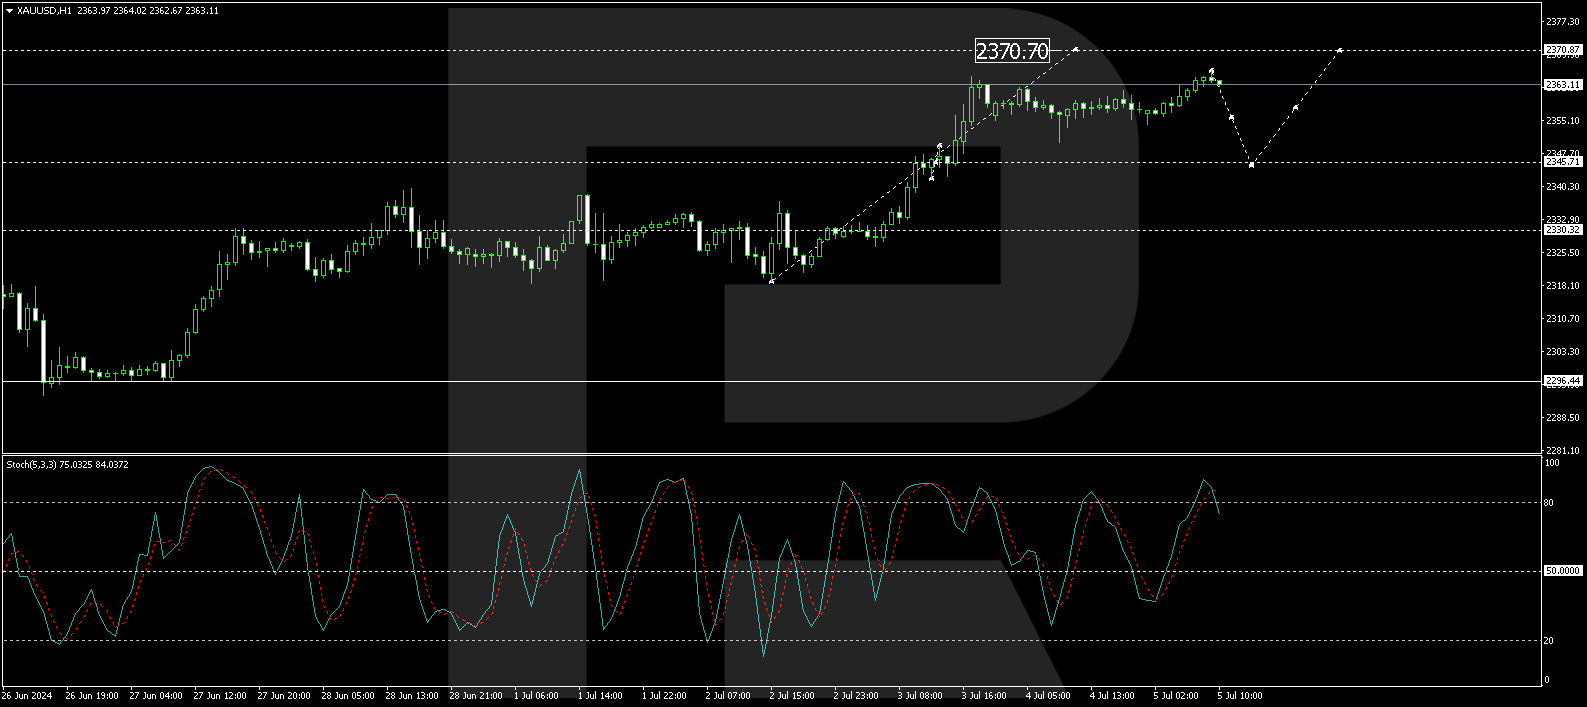
On the hourly chart, gold formed a tight consolidation around 2345.70 and breached the 2366.26 level upward, setting a local high. A corrective move down to 2345.70 is likely, followed by a potential rise to 2370.70, completing the current correction phase. Subsequently, the market might prepare for a new downtrend. The Stochastic oscillator, currently above 80, suggests an impending downturn, reinforcing the likelihood of a corrective decline.
Investors and traders will closely monitor the release of the US jobs report, given its potential to significantly sway Federal Reserve policy and, by extension, gold prices.
Disclaimer
Any forecasts contained herein are based on the author’s particular opinion. This analysis may not be treated as trading advice. RoboForex bears no responsibility for trading results based on trading recommendations and reviews contained herein.
The Dow Jones (US30) Index added 0.41% at Monday’s close, while the S&P 500 (US500) Index gained 0.62%. The NASDAQ Technology Index (US100) closed positive 0.84% on Tuesday. Stock indices ended Tuesday’s trading with moderate gains. Stocks found support on Tuesday thanks to lower bond yields after Fed Chairman Powell said prices show signs of resuming a disinflationary trend.
Tuesday’s US economic news was hawkish for Fed policy and bearish for stocks after JOLTS job openings for May unexpectedly rose by 221,000 to 8.140 million, indicating a strengthening labor market versus expectations of a decline to 7.946 million.
Tesla (TSLA) stock price rose more than 10% to a 5-month high and led gains in the S&P 500 and Nasdaq 100 after the company reported second-quarter vehicle shipments of 443,956 units, beating the consensus forecast of 436,000 units. Bank of America (BAC) shares closed higher by more than 2% after Seaport Global Securities upgraded the stock to “buy” from “neutral” with a $48 price target. PayPal Holdings (PYPL) closed with an increase of more than 2% after Susquehanna upgraded the stock to positive from neutral with a $71 price target. Shares of Nike (NKE) closed down more than 1% after RBC Capital Markets lowered its price target on the stock to $75 from $100.
Equity markets in Europe mostly fell yesterday. Germany’s DAX (DE40) fell by 0.69%, France’s CAC 40 (FR40) closed down 0.30%, Spain’s IBEX 35 (ES35) lost 1.30%, and the UK’s FTSE 100 (UK100) closed negative 0.56%. European stocks fell on Tuesday amid hawkish comments from ECB President Lagarde, who said on Monday night that the ECB does not yet have sufficient evidence that inflation threats have passed, reinforcing expectations that the ECB will delay further interest rate cuts. European stocks also declined as political uncertainty in France remains high ahead of the second round of parliamentary elections this Sunday.
The Eurozone Consumer Price Index for June declined to 2.5% y/y from 2.6% y/y in May, which was in line with expectations. However, core CPI for June rose 2.9% y/y, unchanged from May and exceeding expectations of a decline to 2.8% y/y. ECB Governing Council spokesman Simkus said yesterday that core inflation is the “most important” indicator that will force the ECB to act and that the ECB will not rush to lower borrowing costs. Policymakers are looking at September and the months ahead for further potential interest rate cuts. Swaps estimate the odds of a 25 bps ECB rate cut at 7% for the July 18 meeting and 65% for the September 12 meeting.
WTI crude oil prices retreated from a 2-month high on Tuesday and declined after Russian crude exports rose to a 2-month high. Oil initially moved higher on Tuesday due to rising tensions in the Middle East, with Israel close to a full-scale war with Hezbollah in Lebanon and Houthi rebels in Yemen stepping up attacks on commercial ships in the region. According to API data, the US crude inventories fell sharply by 9.163 million barrels in the week ended June 28, the largest weekly decline since early August 2023 and well above market expectations for a 0.15 million barrel drop.
Natural gas prices fell for the sixth straight session on Tuesday, hitting a seven-week low. They remain under pressure as US storage inventories are +20.6% above the 5-year seasonal average, indicating ample supplies. However, the forecast for hot summer temperatures in the US is a favorable factor for natural gas prices in the coming weeks.
Asian markets were mostly up yesterday. Japan’s Nikkei 225 (JP225) rose by 1.12%, China’s FTSE China A50 (CHA50) gained 0.78%, Hong Kong’s Hang Seng (HK50) added 0.29%, and Australia’s ASX 200 (AU200) was negative 0.42%.
In New Zealand, the latest economic data fell short of expectations. Tuesday’s business survey showed a significant drop in confidence in the second quarter due to high interest rates weighing heavily on demand. Markets are betting that the Reserve Bank of New Zealand (RBNZ) will cut rates as early as October.
The Caixin China Services PMI fell to 51.2 in June 2024 from May’s 10-month high of 54.0, below the forecast of 53.4. This is the 18th consecutive month of growth in service sector activity.
S&P 500 (US500) 5,509.01 +33.92 (+0.62%)
Dow Jones (US30) 39,331.85 +162.33 (+0.41%)
DAX (DE40) 18,164.06 −126.60 (−0.69%)
FTSE 100 (UK100) 8,121.20 −45.56 (−0.56%)
USD Index 105.69 −0.21 (−0.20%)
Important events today:
– Japan Services PMI (m/m) at 03:30 (GMT+3);
– Australia Retail Sales (m/m) at 04:30 (GMT+3);
– China Caixin Services PMI (m/m) at 04:45 (GMT+3);
– German Services PMI (m/m) at 10:55 (GMT+3);
– Eurozone Services PMI (m/m) at 11:00 (GMT+3);
– UK Services PMI (m/m) at 11:30 (GMT+3);
– Eurozone Producer Price Index (m/m) at 12:00 (GMT+3);
– US ADP Nonfarm Employment Change (m/m) at 15:15 (GMT+3);
– US Initial Jobless Claims (m/m) at 15:30 (GMT+3);
– US Trade Balance (m/m) at 15:30 (GMT+3);
– US ISM Services PMI (m/m) at 17:00 (GMT+3);
– Eurozone ECB President Lagarde Speaks at 17:15 (GMT+3);
This article reflects a personal opinion and should not be interpreted as an investment advice, and/or offer, and/or a persistent request for carrying out financial transactions, and/or a guarantee, and/or a forecast of future events.
Unexpected results could trigger volatility on GBP & UK100
Bloomberg FX model: 77% GBPUSD – (1.2569- 1.2800)
UK100 under pressure with W1 support at 8100
Millions of voters in Britain will be heading to the polls tomorrow!
And the outcome may shape the UK’s outlook over the next few years.
Here, we’ll break down what exactly is going on and how it could impact your trading.
What is happening?
On Thursday 4th July, Britons will elect the 650 MPs who sit in the House of Parliament.
The political party that wins at least 50% of seats will form the new government, and its leader the Prime Minister.
Polling stations open at 7am until 10pm UK time.
The lowdown…
On May 22, 2024, UK Prime Minister surprised the public by announcing elections will be held on July 4th despite having until January 2025.
Who are the major players?
Rishi Sunak: Conservative leader
Keir Starmer: Labour leader
Ed Davey: Liberal Democrats
Nigel Farage: Reform UK
John Swinney: SNP party
Carla Denyer: Green party
According to opinion polls, the opposition Labour Party leads the Conservatives by around 20 points and is on course for a historic landslide victory.
What does this mean?
It could mean Labour returns in power for the first time since 2010 when led by Gordon Brown.
What could go wrong?
Polls have been wrong before with elections full of surprises.
Despite what the polls are showing, the current government (Conservatives) stays in power.
Or a hung parliament situation where no party has a majority of seats – leading to coaling governments after the election. The last time this happened was in 2017.
How will this impact UK markets
Broadly speaking, the market-friendly outcome appears to be a Labour victory.
This is based on markets expecting little change in fiscal policy in the near future. In addition, an incoming Labour-led government would seek to adopt closer ties with the EU – possibly boosting confidence in the UK economic outlook in the medium to longer term.
How about the Pound & FXTM’s UK100?
In the short term, a Labour win could boost the British Pound but hit the UK100.
A shock result that sees the current government stay in power may weaken the Pound, supporting the UK100 as a result.
Note: Over 80% of the revenues from FTSE100 companies come from outside of the UK.
So essentially, when the pound appreciates, it results in lower revenues for those companies that acquire sales from overseas – dragging the UK100 lower as a result. The same is true vice versa
Technical outlook
GBPUSD
Prices remain in a wide range on the weekly charts with support at 1.2600 and resistance at 1.2800.
A breakdown below 1.2600 could see a decline towards 1.2500
Should 1.2600 prove to be reliable support, prices may retest 1.2800
According to Bloomberg’s FX forecast model, there’s a 77%% chance that GBPUSD trades within the 1.256- 1.2800 range over the next one-week period.
UK100
FXTM’s UK100 is under pressure on the weekly charts with bears eyeing the 8100 level.
A solid break below 8100 could signal a decline toward 8020 and 7900.
Should 8100 prove to be reliable support, prices may rebound toward 8250.
AUD/USD has climbed to 0.6676 yet remains in a “sideways” pattern, indicating a lack of clear directional momentum in the market.
The Australian dollar’s appreciation is linked to a softening in the US dollar’s stance, influenced by remarks from Federal Reserve Chair Jerome Powell. Powell highlighted the need for further economic data to assess the disinflationary trends, suggesting a cautious approach to rate adjustments. This uncertainty around US monetary policy has led to a dip in the USD, boosting AUD.
Conversely, the Reserve Bank of Australia (RBA) maintains a vigilant stance on inflation, with recent minutes suggesting a potential rate hike if inflationary pressures escalate. This possibility lends some support to the Australian dollar. Recent economic data from Australia, including a spike in May’s retail sales and continued private sector growth in June, further bolsters this perspective.
Market speculation hints at a potential RBA rate increase in August, with forthcoming data likely to provide clearer indicators of this likelihood.
Technical analysis of AUD/USD
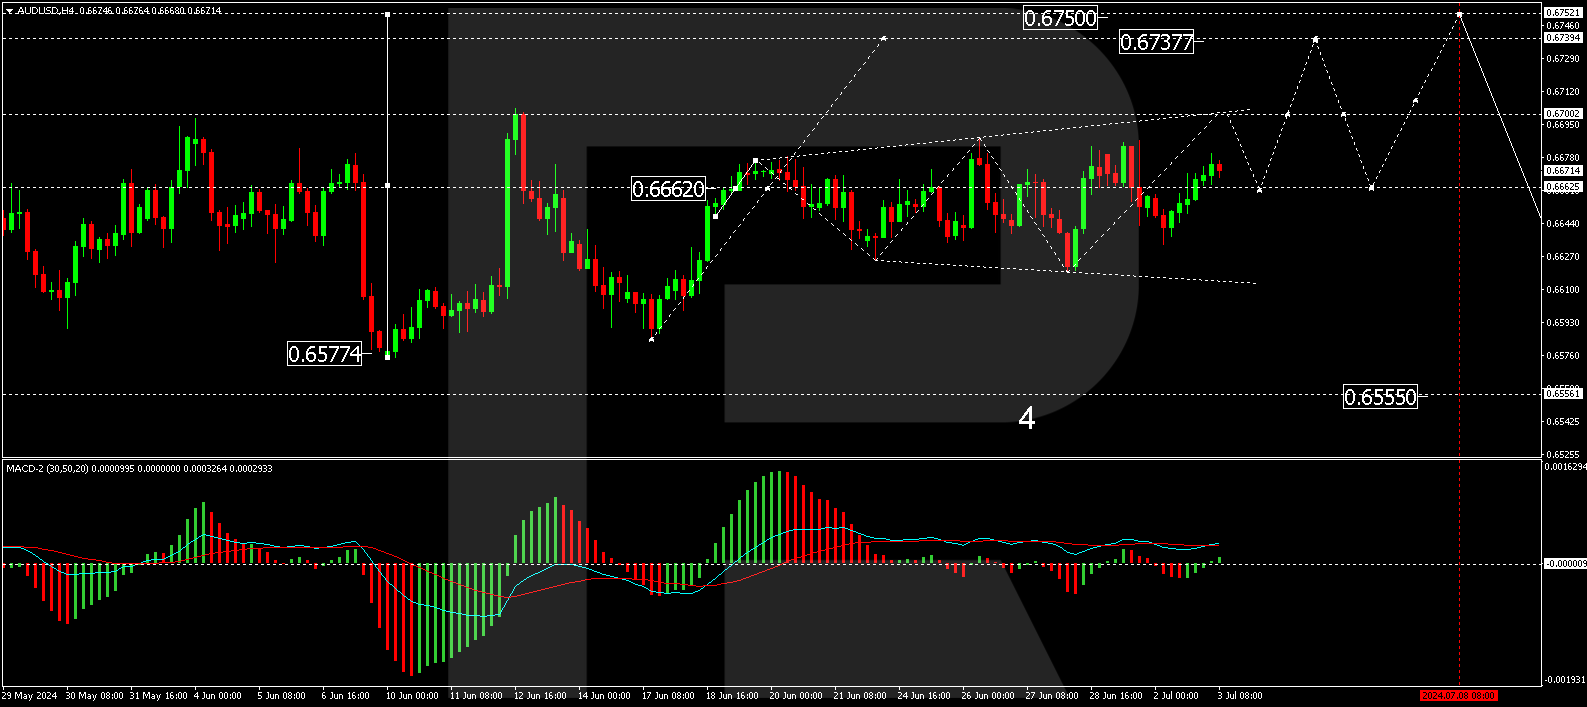
The AUD/USD pair navigates within a broad consolidation range, forming a diverging “Triangle” around 0.6662. Currently, there is potential for the price to ascend to 0.6702. Upon reaching this level, a retraction to 0.6662 is anticipated, with a potential downward break targeting 0.6555 before resuming upward movements towards 0.6737. The MACD indicator supports this growth scenario, with its signal line positioned above zero and upwards.
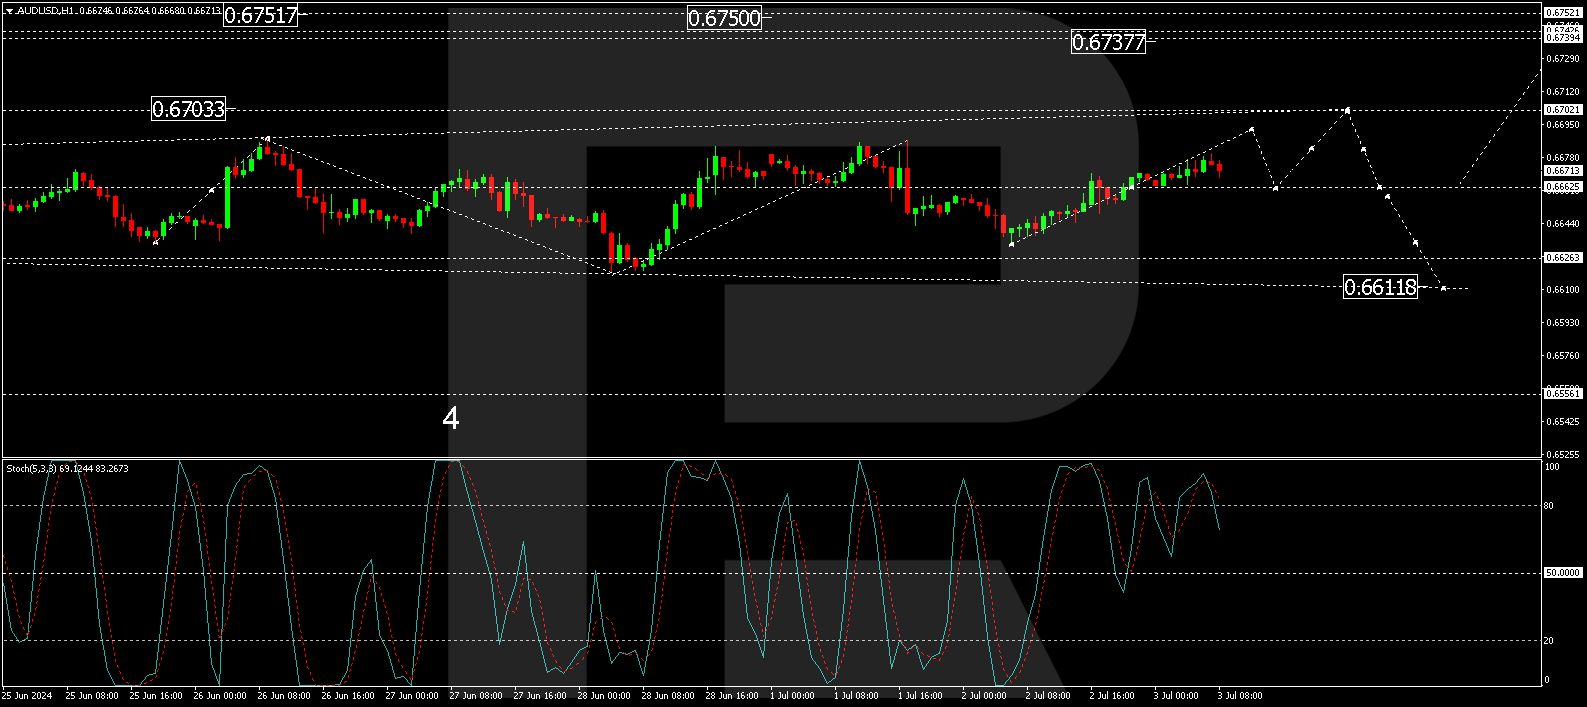
On the hourly chart, a tight consolidation has been observed around 0.6662. The expected trajectory involves an ascent to 0.6690, potentially extending to 0.6702. This growth forecast is underscored by the Stochastic oscillator, whose signal line is above 80, suggesting an impending downward adjustment to around 50.
Market outlook
As the global financial landscape navigates through mixed economic signals and central bank policies, the AUD/USD pair will likely continue to experience volatility. Investors and traders will closely monitor upcoming economic releases and central bank communications to gauge the potential shifts in monetary policy, especially from the RBA and the Fed, which could significantly influence the currency pair’s movements in the near term.
Disclaimer
Any forecasts contained herein are based on the author’s particular opinion. This analysis may not be treated as trading advice. RoboForex bears no responsibility for trading results based on trading recommendations and reviews contained herein.
Electroencephalography, or EEG, was invented 100 years ago. In the years since the invention of this device to monitor brain electricity, it has had an incredible impact on how scientists study the human brain.
Since its first use, the EEG has shaped researchers’ understanding of cognition, from perception to memory. It has also been important for diagnosing and guiding treatment of multiple brain disorders, including epilepsy.
I am a cognitive neuroscientist who uses EEG to study how people remember events from their past. The EEG’s 100-year anniversary is an opportunity to reflect on this discovery’s significance in neuroscience and medicine.
Discovery of EEG
On July 6, 1924, psychiatrist Hans Berger performed the first EEG recording on a human, a 17-year-old boy undergoing neurosurgery. At the time, Berger and other researchers were performing electrical recordings on the brains of animals.
What set Berger apart was his obsession with finding the physical basis of what he called psychic energy, or mental effort, in people. Through a series of experiments spanning his early career, Berger measured brain volume and temperature to study changes in mental processes such as intellectual work, attention and desire.
He then turned to recording electrical activity. Though he recorded the first traces of EEG in the human brain in 1924, he did not publish the results until 1929. Those five intervening years were a tortuous phase of self-doubt about the source of the EEG signal in the brain and refining the experimental setup. Berger recorded hundreds of EEGs on multiple subjects, including his own children, with both experimental successes and setbacks.
Finally convinced of his results, he published a series of papers in the journal Archiv für Psychiatrie and had hopes of winning a Nobel Prize. Unfortunately, the research community doubted his results, and years passed before anyone else started using EEG in their own research.
Berger was eventually nominated for a Nobel Prize in 1940. But Nobels were not awarded that year in any category due to World War II and Germany’s occupation of Norway.
Neural oscillations
When many neurons are active at the same time, they produce an electrical signal strong enough to spread instantaneously through the conductive tissue of the brain, skull and scalp. EEG electrodes placed on the head can record these electrical signals.
Since the discovery of EEG, researchers have shown that neural activity oscillates at specific frequencies. In his initial EEG recordings in 1924, Berger noted the predominance of oscillatory activity that cycled eight to 12 times per second, or 8 to 12 hertz, named alpha oscillations. Since the discovery of alpha rhythms, there have been many attempts to understand how and why neurons oscillate.
Neural oscillations are thought to be important for effective communication between specialized brain regions. For example, theta oscillations that cycle at 4 to 8 hertz are important for communication between brain regions involved in memory encoding and retrieval in animals and humans.
Researchers then examined whether they could alter neural oscillations and therefore affect how neurons talk to each other. Studies have shown that many behavioral and noninvasive methods can alter neural oscillations and lead to changes in cognitive performance. Engaging in specific mental activities can induce neural oscillations in the frequencies those mental activities use. For example, my team’s research found that mindfulness meditation can increase theta frequency oscillations and improve memory retrieval.
Noninvasive brain stimulation methods can target frequencies of interest. For example, my team’s ongoing research found that brain stimulation at theta frequency can lead to improved memory retrieval.
EEG has also led to major discoveries about how the brain processes information in many other cognitive domains, including how people perceive the world around them, how they focus their attention, how they communicate through language and how they process emotions.
Scientists are using EEG to see whether memory can be improved with noninvasive brain stimulation. Although the research is still in its infancy, there have been some promising results. For example, one study found that noninvasive brain stimulation at gamma frequency – 25 hertz – improved memory and neurotransmitter transmission in Alzheimer’s disease.
A new type of noninvasive brain stimulation called temporal interference uses two high frequencies to cause neural activity equal to the difference between the stimulation frequencies. The high frequencies can better penetrate the brain and reach the targeted area. Researchers recently tested this method in people using 2,000 hertz and 2,005 hertz to send 5 hertz theta frequency at a key brain region for memory, the hippocampus. This led to improvements in remembering the name associated with a face.
Although these results are promising, more research is needed to understand the exact role neural oscillations play in cognition and whether altering them can lead to long-lasting cognitive enhancement.
The future of EEG
The 100-year anniversary of the EEG provides an opportunity to consider what it has taught us about brain function and what this technique can do in the future.
In a survey commissioned by the journal Nature Human Behaviour, over 500 researchers who use EEG in their work were asked to make predictions on the future of the technique. What will be possible in the next 100 years of EEG?
Some researchers, including myself, predict that we’ll use EEG to diagnose and create targeted treatments for brain disorders. Others anticipate that an affordable, wearable EEG will be widely used to enhance cognitive function at home or will be seamlessly integrated into virtual reality applications. The possibilities are vast.
It’s a widely accepted notion among economists that cultural differences can pose a significant barrier to trade. The larger the cultural gap between two countries – judging by differences in language, customs, values and business norms – the more challenging and costly trade relations become. This is a recurringthemein research.
Our research uncovered a distinctive pattern: Unlike many other nations, cultural differences rarely influence the scale of China’s trade activities.
Bridging cultural gaps: Strategies and successes
Countries have various tools to minimize the effects of cultural differences on their trade. Cultural exchange programs, bilateral trade agreements and international trade shows have shown remarkable success in fostering mutual understanding, easing trade negotiations and overcoming cultural barriers.
However, these options are available to all countries. What makes China unique?
By aligning itself with the economic development needs of its trading partners, China has been able to minimize the negative effects of cultural differences on its trade. It’s a strategy that has proved to be remarkably effective.
A closer examination of China’s trade ventures in Africa, the Middle East and Latin America — all regions with significant cultural differences from China — paints a vivid picture of this observation.
Despite its cultural differences with nations on the African continent, each with its own unique traditions, languages and customs, China has built a multibillion-dollar trade network in the region that spans industries from mining to telecom. China’s engagement in Africa is facilitated by a combination of local infrastructure investment, affordable technology provision and favorable loan terms. These partnerships are more about creating symbiotic relationships and less about efficiency. This facilitates market access and helps China to overcome cultural barriers.
In the Middle East, too, China has made significant inroads by aligning itself with the region’s development goals, such as those outlined in Saudi Arabia’s Vision 2030 and the United Arab Emirates’ Centennial 2071. China’s Belt and Road Initiative complements these long-term development plans, offering the capital investment and construction expertise needed to bring ambitious infrastructure projects to life.
China’s presence in Latin America has also grown substantially over the past decade. Despite the geographical and cultural distance, China has become one of the top trade partners for countries such as Brazil, Chile and Peru. This relationship is built on reciprocity: Latin American countries supply raw materials and agricultural products in exchange for Chinese investment in the infrastructure and manufacturing sectors.
Again, this is a strategy that hinges on pragmatic economic interactions focused on mutual benefits and development goals.
The need for strategic adaptability
Some might argue that trading with China is an obvious choice due to its size and influence. The economic incentives include access to China’s population of over 1.4 billion and its significant role in global value chains, especially in electronics, textiles and machinery. As China’s influence in global markets grows, U.S. companies also face competitive pressures to maintain their market positions.
However, China’s trade practices, frequently entangled with governmental intervention, potentially undermine market efficiency — an established economic objective — in numerous ways.
In international trade, market efficiency refers to the extent to which prices in the global market reflect all available information, allowing resources to be allocated optimally across countries.
China has been known to require foreign companies to transfer technology to local firms as a condition for market access. This practice may distort market efficiency by forcing companies to share proprietary technology rather than compete on a level playing field.
Intellectual property theft and insufficient protection of intellectual property rights in China have also been major concerns for Western companies. The lack of robust intellectual property enforcement can lead to inefficiencies, as it discourages innovation and investment by foreign firms who fear their inventions and technologies may be copied without adequate legal recourse.
Western companies also face various market-access barriers in China, such as joint venture requirements, limits on foreign ownership and regulatory hurdles. These barriers can prevent the efficient allocation of resources and limit competition and innovation, resulting in a less efficient market overall.
Despite these concerns, Western firms continue to do business with China.
China’s adeptness in transcending cultural barriers, combined with Western firms’ continued engagement, pose a significant challenge for Western economies, notably the United States’. The challenge is heightened as the U.S. maintains a focus on traditional efficiency approaches in forging trade relationships across diverse regions such as Africa, Latin America and the Middle East.
Since traditional market efficiency approaches might not always suffice, Western economies may need to reconsider their strategies.
At Monday’s close, the Dow Jones (US30) Index added 0.13%, while the S&P 500 (US500) Index gained 0.27%. The NASDAQ Technology Index (US100) closed positive 0.83%. Strengthening large-cap tech stocks boosted the broad market on Monday. However, concerns that the economy is losing momentum could limit the potential for further stock gains.
The ISM US Manufacturing Index for June unexpectedly fell by 0.2 to a four-month low of 48.5, weaker than expectations for a rise to 49.1. The ISM Goods and Services Price Sub-Index for June fell by 4.9 to a 6-month low of 52.1, weaker than expectations of 55.9.
Tesla (TSLA) shares rose more than 6% and led gains in the S&P 500 and Nasdaq 100 after Wells Fargo listed it as a tactical idea for the third quarter.
Equity markets in Europe were mostly up yesterday. Germany’s DAX (DE40) rose by 0.30%, France’s CAC 40 (FR40) closed higher by 1.09%, Spain’s IBEX 35 (ES35) Index added 1.04%, and the UK’s FTSE 100 (UK100) closed positive 0.03%. The S&P Eurozone Manufacturing PMI for June was revised upward by 0.2 to 45.8 from the previously reported 45.6. The German Consumer Price Index for June (EU harmonized) declined to 2.5% y/y from 2.8% y/y in May, which was in line with expectations. ECB President Lagarde said that the ECB does not yet have sufficient evidence that inflationary threats have passed, reinforcing expectations that the ECB will postpone further interest rate cuts. Today, the Eurozone will release Eurozone inflation data for June and unemployment data for May.
WTI crude oil futures rose to around $83.5 a barrel on Tuesday, hitting a two-month-high, driven by prospects for higher demand during the summer travel season. Prognoses from the American Automobile Association showed vacation travel up 5.2% year-over-year, with auto travel alone expected to rise 4.8% from a year ago. In addition, bets on a rate cut by the US Federal Reserve are providinxg support for oil prices after a recent slowdown in US inflation sparked optimism that a rate cut is imminent.
Asian markets traded mixed yesterday. Japan’s Nikkei 225 (JP225) was up 0.12%, China’s FTSE China A50 (CHA50) added 0.34%, Hong Kong’s Hang Seng (HK50) was not trading, and Australia’s ASX 200 (AU200) was negative 0.22%.
The offshore yuan depreciated to 7.30 per dollar, remaining at its lowest level in seven months, while weak guidance from the People’s Bank of China (PBoC) pressured investor sentiment. The Bank of China set the average rate at 7.1291 per dollar, the lowest since November 21, signaling a willingness to weaken the yuan further. The yuan’s depreciation is also supported by a stronger US dollar, driven by a sharp rise in US bond yields and speculation about Donald Trump’s possible return to the presidency.
The Japanese yen fell to 161.5 per dollar, sliding to new 38-year lows due to a sharp interest rate differential between Japan and the US. A lack of urgency from the Bank of Japan to normalize monetary policy is weighing on the currency. However, there is growing speculation that the BOJ may raise rates at its next meeting in late July. A weak yen raises the cost of imports, which adds to inflationary pressures and negatively affects household consumption. Meanwhile, Finance Minister Shun’ichi Suzuki reiterated on Tuesday that the government remains vigilant in monitoring exchange rate movements.
Minutes from the Reserve Bank of Australia’s (RBA) June meeting showed that policymakers emphasized the need to remain vigilant against upside risks to inflation, adding that a significant rise in prices could necessitate a significant rate hike. Nevertheless, the board sees an opportunity to bring inflation to the target level while maintaining stability in the economy and labor market. Markets are currently pricing in a one-in-three chance of a rate hike as early as August while ruling out the possibility of an RBA rate cut this year.
S&P 500 (US500) 5,475.09 +14.61 (+0.27%)
Dow Jones (US30) 39,169.52 +50.66 (+0.13%)
DAX (DE40) 18,290.66 +55.21 (+0.30%)
FTSE 100 (UK100) 8,166.76 +2.64 (+0.032%)
USD Index 105.82 −0.04 (−0.04%)
Important events today:
– Australia RBA Meeting Minutes at 04:30 (GMT+3);
– Eurozone Consumer Price Index (m/m) at 12:00 (GMT+3);
– Eurozone Unemployment Rate (m/m) at 12:00 (GMT+3);
– Canada Manufacturing PMI (m/m) at 16:30 (GMT+3);
– Eurozone ECB President Lagarde Speaks at 16:30 (GMT+3);
This article reflects a personal opinion and should not be interpreted as an investment advice, and/or offer, and/or a persistent request for carrying out financial transactions, and/or a guarantee, and/or a forecast of future events.
Over past year NFP triggered moves of ↑ 2.3% & ↓ 1.9%
Bearish channel breached but resistance at $63500
Thanks to the incoming US jobs report and developments concerning the failed Mt. Gox exchange, this could be a wild week for Bitcoin!
Despite prices rebounding from sub-$60k, sentiment remains fragile with a major liquidation event and uncertainty over US interest rates keeping bears in the game.
Looking at the technical picture, Bitcoin remains in a range on the weekly charts with potential resistance forming around $63500.
With all the above said, here are 4 things that could rock Bitcoin this week:
1) FOMC minutes
The Fed minutes on Wednesday will be an appetizer before the main course on Friday.
Investors will be seeking insight into why Fed officials lowered their expectations for 2024 rate cuts despite growth and unemployment projections unchanged.
Bitcoin may slip if the minutes sound more hawkish than expected.
Should the minutes strike a dovish note, Bitcoin prices may edge higher.
Golden nugget: Over the past year, the Fed minutes have triggered upside moves of as much as 1.6% or declines of 1.3% in a 6-hour window post-release.
2) Bankrupt Tokyo-based exchange Mt. Gox
From early July 2024, collapsed Tokyo-based bitcoin exchange, Mt. Gox is expected to start paying back users roughly $9 billion worth of stolen tokens.
Imagine losing 1 bitcoin worth roughly $500 back in 2014 and then receiving that same Bitcoin today worth around $60,000. What would you do?
There are expectations around the receivers of the stolen tokens cashing out, potentially triggering steep losses on Bitcoin.
3) US jobs report
The incoming US jobs report is likely to influence bets around when the Fed cuts rates in H2.
Markets expect the US economy to have created 200k jobs in June, compared with the blockbuster 272k in the previous month while the unemployment rate is expected to remain unchanged at 4%.
It is worth keeping in mind that cryptocurrencies have shown sensitivity to interest rates due to their risky nature.
A soft jobs report may push Bitcoin prices higher.
If the jobs data exceeds market forecasts, this could drag Bitcoin prices lower.
Golden nugget: Over the past year, the US jobs report has triggered upside moves of as much as 2.3% or declines of 1.9% in a 6-hour window post-release.
4) Technical forces
Prices have breached the daily bearish channel, but resistance can be found at $63500.
Sustained weakness below $63500 may encourage a decline back towards $59000.
A solid daily close above $63500 could open a path towards the 100-day SMA and 50-day SMA.
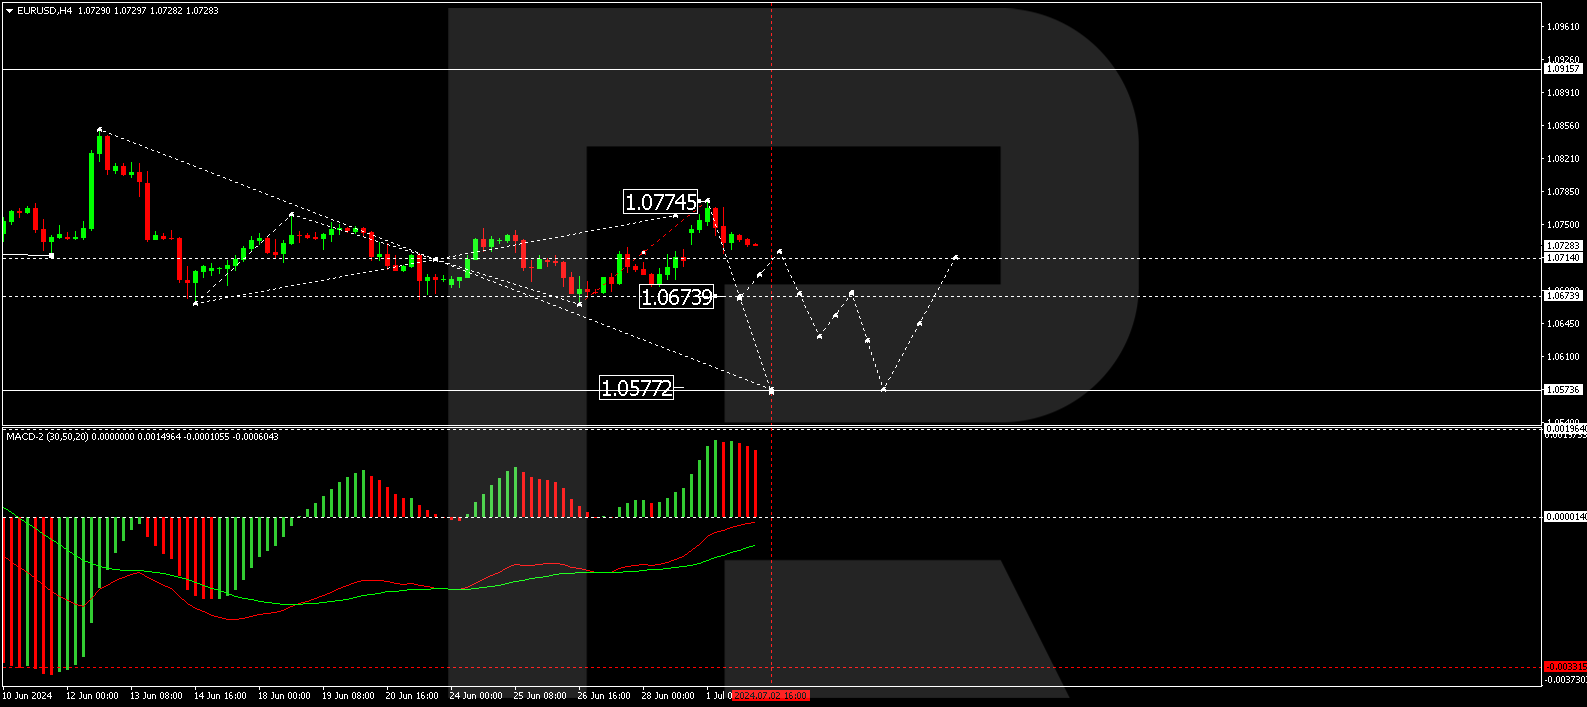
The EUR/USD pair experienced a noticeable uptick yesterday, but failed to sustain its peak, settling at 1.0732 today. Early gains were buoyed by the initial outcomes from France’s parliamentary elections, which did not reflect the worst-case scenario, sparking a temporary surge in risk appetite and bolstering the euro.
However, last evening’s economic indicators from the U.S. painted a mixed picture, dampening the initial enthusiasm. The ISM Manufacturing Index for June dipped to 48.5 from 48.7, falling short of expectations and remaining below the pivotal 50-point mark that delineates expansion from contraction. Conversely, Markit’s Manufacturing PMI indicated a slight improvement, rising to 51.6 from 51.3.
Additionally, a report showed a 0.1% month-on-month decline in U.S. construction spending for May, a reversal from the previous increase of 0.3% and weaker than anticipated, suggesting a potential slowdown in the construction sector and broader economic support.
Market participants are now turning their attention to an upcoming speech by Jerome Powell, Chair of the Federal Reserve, for further clues on the direction of U.S. monetary policy.
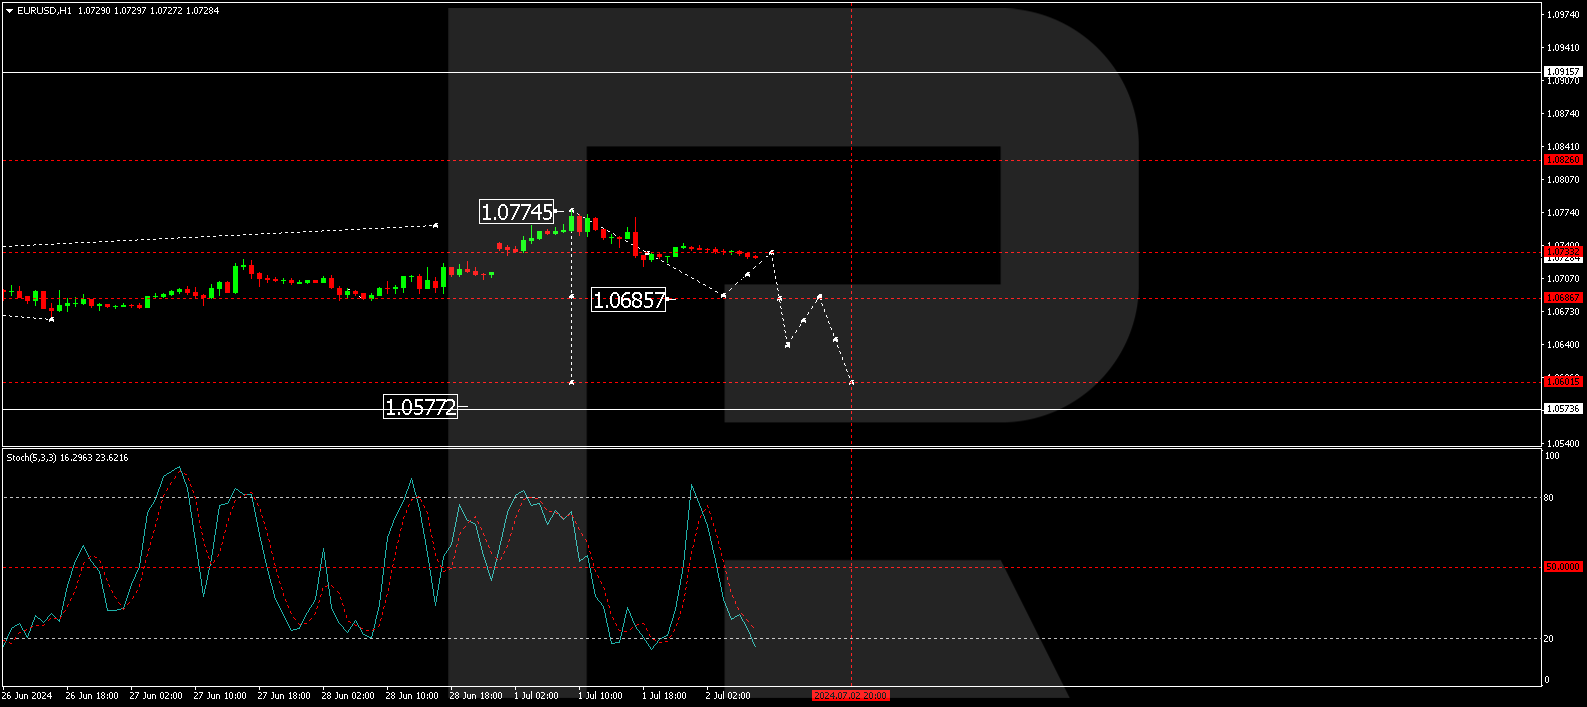
Technical analysis of EUR/USD
The EUR/USD pair completed a correction to 1.0774 but is now forming a declining wave towards 1.0675. Should this level be reached, a minor correction to 1.0714 may occur before a potential further drop to 1.0630, and potentially extending down to 1.0573. The MACD indicator underlines this bearish outlook with its signal line positioned below zero and histograms trending downwards.
On the hourly chart, the pair is currently crafting a declining structure with an initial target at 1.0675. Following this, a correction towards 1.0714 is plausible, before a continuation of the downtrend to 1.0640. The Stochastic oscillator corroborates this view, with its signal line approaching the 20 level, indicating a potential for further declines before a rebound towards 50 might occur.
Market outlook
Investors will continue to assess the blend of economic data and central bank signals, particularly from the Fed, to gauge the potential trajectory of interest rates and their impact on currency valuations. Today’s speech by Jerome Powell could be particularly pivotal in setting market expectations moving forward.
Disclaimer
Any forecasts contained herein are based on the author’s particular opinion. This analysis may not be treated as trading advice. RoboForex bears no responsibility for trading results based on trading recommendations and reviews contained herein.
Parties have till Tuesday evening to apply for second round
Second round of election on July 7th
Key level of interest – 7470 and 7700
FXTM’s FRA40 initially rebounded on Monday morning as investors welcomed the preliminary results of French parliamentary elections.
Although Marine Le Pen’s National Party dominated the first round, it was not enough for an outright majority in the second round scheduled for July 7th. The prospect of a hung parliament may be a market-friendly outcome despite the uncertainty it presents. Such a scenario could block Le Pen’s big spending plans that would have disregarded European Union fiscal rules and hit investor sentiment.
Note: A hung parliament is when no single political party wins a majority.
It is worth noting that all those who got votes of at least 12.5% are eligible to participate in the second round.
First round election results:
National Rally (far-right): 33.1%
New Popular Front (left-wing): 28%
Renaissance and allies (centrist): 20.8%
Republicans: 10.2%
Despite the initial positivity, European markets could remain tense ahead of the deadline on Tuesday evening for candidates to confirm whether or not they’re running.
Depending on how this plays out, it may shape expectations over what to expect in the second round of elections on Sunday 7th July.
Prices jumped as much as 3% on Monday morning, punching above the 7700-resistance level before giving back gains. More volatility may be on the cards on Tuesday depending on how markets react to the candidates participating in round 2 of the elections.
Still, key support can be found at 7470 and resistance at 7700.


