By InvestMacro
Here are the latest charts and statistics for the Commitment of Traders (COT) data published by the Commodities Futures Trading Commission (CFTC).
The latest COT data is updated through Tuesday June 25th and shows a quick view of how large market participants (for-profit speculators and commercial traders) were positioned in the futures markets. All currency positions are in direct relation to the US dollar where, for example, a bet for the euro is a bet that the euro will rise versus the dollar while a bet against the euro will be a bet that the euro will decline versus the dollar.
Weekly Speculator Bets led by Canadian & Australian Dollars
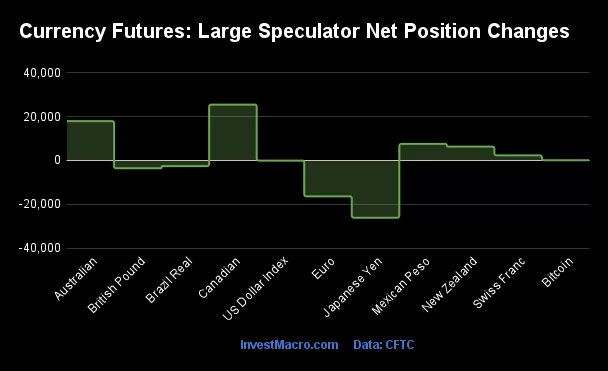
The COT currency market speculator bets were higher this week as six out of the eleven currency markets we cover had higher positioning while the other five markets had lower speculator contracts.
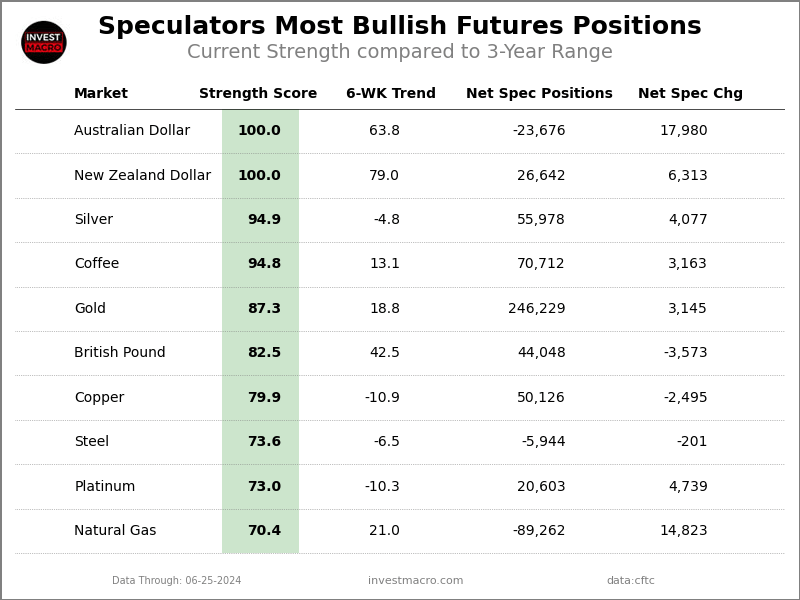
Leading the gains for the currency markets was the Canadian Dollar (25,519 contracts) with the Australian Dollar (17,980 contracts), the Mexican Peso (7,552 contracts), the New Zealand Dollar (6,313 contracts), the Swiss Franc (2,333 contracts) and with Bitcoin (99 contracts) also showing positive weeks.
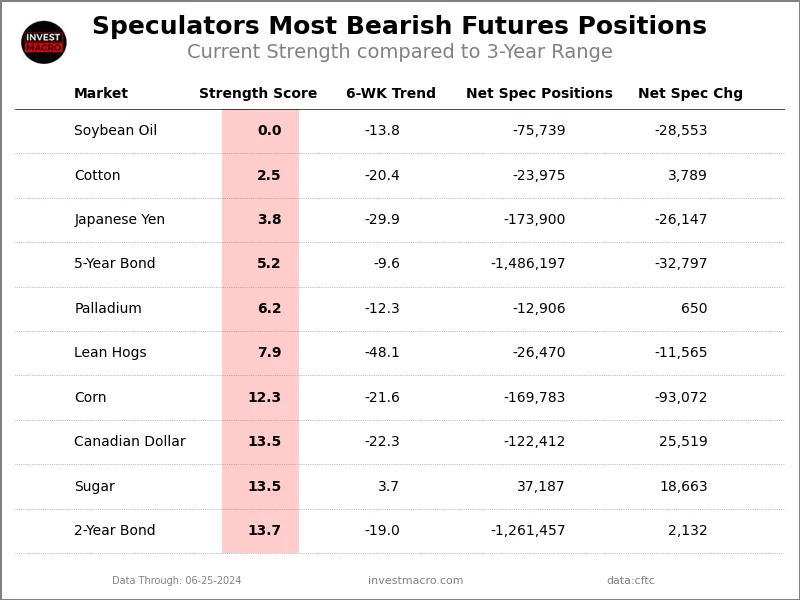
The currencies seeing declines in speculator bets on the week were the Japanese Yen (-26,147 contracts), the EuroFX (-16,382 contracts), the British Pound (-3,573 contracts), the Brazilian Real (-2,563 contracts) and with the US Dollar Index (-73 contracts) also registering lower bets on the week.
COT Currency Roundup:
The Canadian dollar speculative position jumped by over +25,000 contracts this week but this was following three straight weeks of declines that had brought the overall position to an all-time record low level. The CAD position has fallen for 13 out of the past 17 weeks and dropped to a record bearish level on June 18th at a total of -147,931 contracts. This week’s speculator position settled at a total of -122,412 contracts. Helping keep the pressure on the Canadian dollar (also called the loonie) recently was the Bank of Canada’s decision to lower their interest rate on June 5th to 4.75 percent from the previous 5 percent. With inflation subsiding in the Canadian economy, there is speculation that interest rates will come down as well and in turn, dampen the perceived attractiveness of the loonie versus other major currencies.
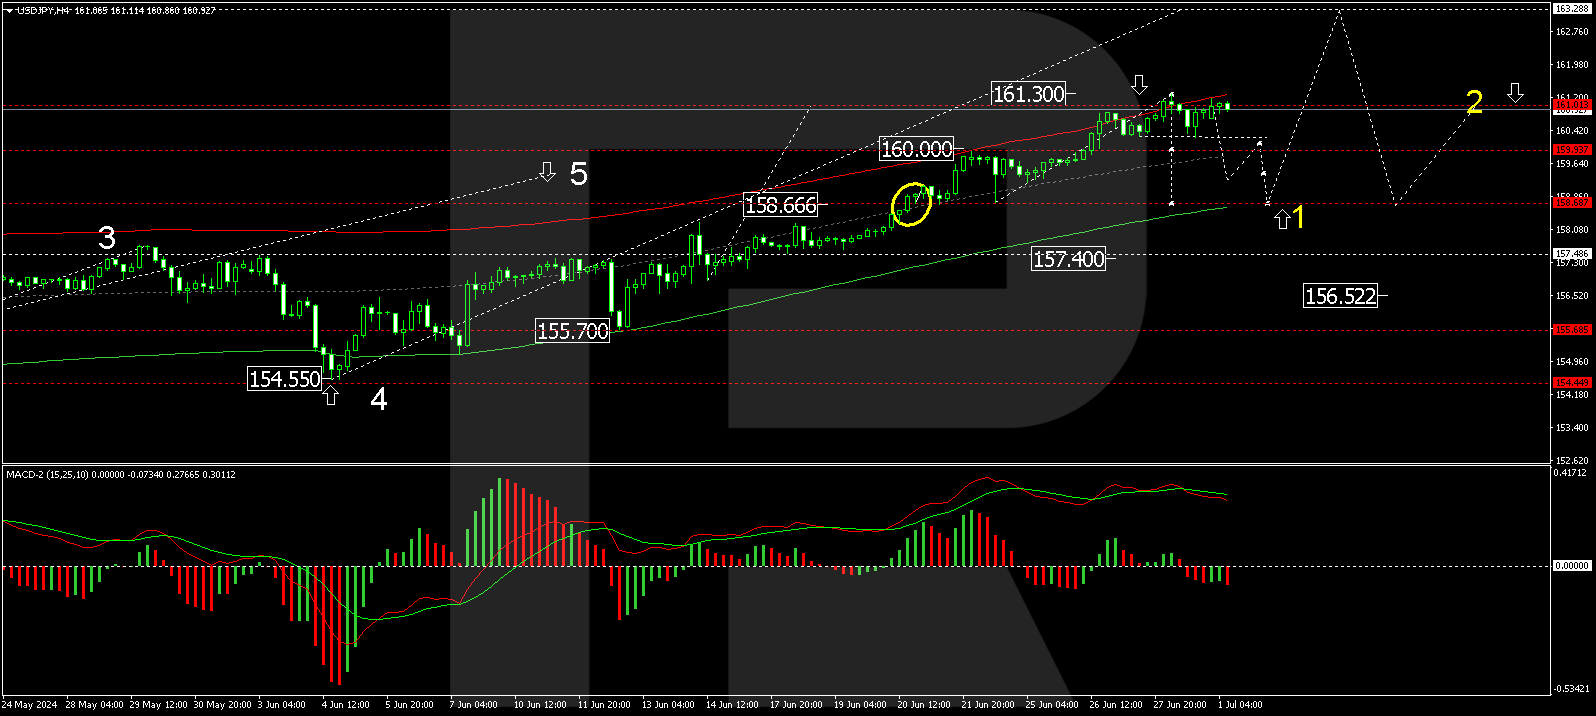
The Japanese yen speculator contracts continued to drop this week and have fallen for three straight weeks. The yen speculative positioning has also declined in 13 out of the last 20 weeks as the overall bearish position has now been above -100,000 contracts for twenty consecutive weeks. The US Dollar/Japanese yen exchange rate continues to see Dollar strength (vs the yen) as the USDJPY currency pair touched above the 161.00 level this week – marking the highest level for the USD since the late-1980s.
The euro currency contracts flipped back into negative territory this week and are in a small bearish position for the first time since April 30th. The euro speculator bets have declined for three straight weeks and are standing at a total of -8,431 contracts this week. The euro exchange rate versus the US Dollar (EURUSD currency pair) has had a very subdued year so far with a fluctuation between approximately 1.0650 and 1.1000 since the beginning of January. This week the EURUSD closed at 1.0752.
The Australian dollar speculator position sharply rose for a second straight week this week with a gain of +17,980 contracts following last week’s +23,129 contract rise. The Aussie spec position has seen a marked improvement since hitting an all-time low on March 19th at -107,538 contracts with this week’s standing coming in at -23,676 contracts. This is the least bearish level since June 29th of 2021, almost exactly three years ago.
The large speculative US Dollar Index positions dipped very slightly this week by just -73 contracts. However, the Dollar Index speculative position has been on quite a run with gains in the previous eleven straight weeks. This improved sentiment brought the spec position from out of bearish territory to the highest level since December of 2023 above +17,000 contracts and near where the speculator position currently sits at +17,522 contracts. The Dollar Index price has also been on the upswing with gains in four straight weeks and closed out this week at the 105.50 level.
Finally, the large speculative New Zealand Dollar currency positions gained this week by over +6,000 net contracts. The NZD net positions have now increased for six consecutive weeks – adding a total of +37,842 contracts to the net position in that time. This improvement has taken the NZD spec contracts to the most bullish level in the past three hundred and twenty-three weeks, dating back to April 17th of 2018.
Currencies Net Speculators Leaderboard
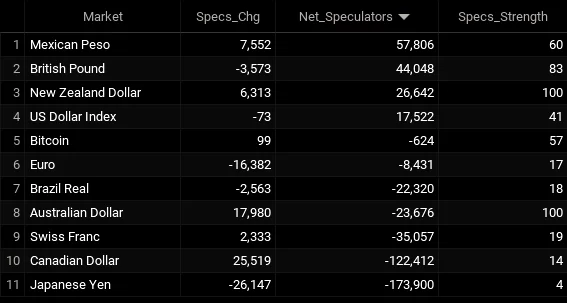
Legend: Weekly Speculators Change | Speculators Current Net Position | Speculators Strength Score compared to last 3-Years (0-100 range)
Strength Scores led by Australian & New Zealand Dollars
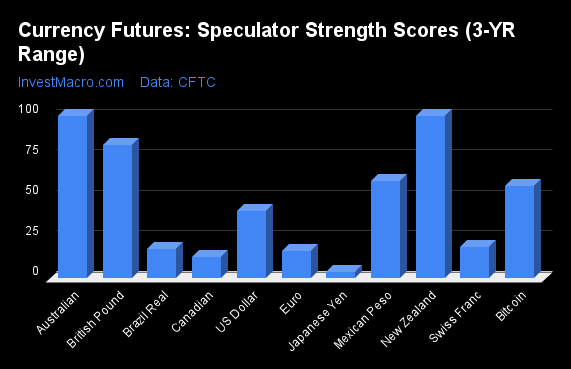
COT Strength Scores (a normalized measure of Speculator positions over a 3-Year range, from 0 to 100 where above 80 is Extreme-Bullish and below 20 is Extreme-Bearish) showed that the Australian Dollar (100 percent) and the New Zealand Dollar (100 percent) lead the currency markets this week. The British Pound (82 percent), the Mexican Peso (60 percent) and Bitcoin (57 percent) come in as the next highest in the weekly strength scores.
On the downside, the Japanese Yen (4 percent), the Canadian Dollar (14 percent), the EuroFX (17 percent), the Brazilian Real (18 percent) and the Swiss Franc (19 percent) come in at the lowest strength levels currently and are in Extreme-Bearish territory (below 20 percent).
Strength Statistics:
US Dollar Index (41.4 percent) vs US Dollar Index previous week (41.6 percent)
EuroFX (16.7 percent) vs EuroFX previous week (23.7 percent)
British Pound Sterling (82.5 percent) vs British Pound Sterling previous week (84.9 percent)
Japanese Yen (3.8 percent) vs Japanese Yen previous week (20.1 percent)
Swiss Franc (19.1 percent) vs Swiss Franc previous week (15.0 percent)
Canadian Dollar (13.5 percent) vs Canadian Dollar previous week (0.0 percent)
Australian Dollar (100.0 percent) vs Australian Dollar previous week (78.6 percent)
New Zealand Dollar (100.0 percent) vs New Zealand Dollar previous week (86.8 percent)
Mexican Peso (59.8 percent) vs Mexican Peso previous week (56.1 percent)
Brazilian Real (18.0 percent) vs Brazilian Real previous week (20.8 percent)
Bitcoin (57.0 percent) vs Bitcoin previous week (55.5 percent)
New Zealand Dollar & Australian Dollar top the 6-Week Strength Trends
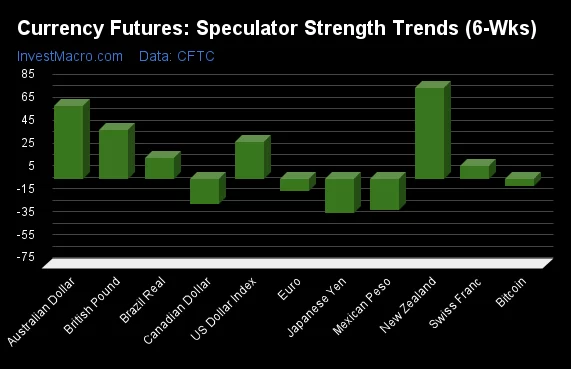
COT Strength Score Trends (or move index, calculates the 6-week changes in strength scores) showed that the New Zealand Dollar (79 percent) and the Australian Dollar (64 percent) lead the past six weeks trends for the currencies. The British Pound (43 percent), the US Dollar Index (32 percent) and the Brazilian Real (18 percent) are the next highest positive movers in the latest trends data.
The Japanese Yen (-30 percent) leads the downside trend scores currently with the Mexican Peso (-27 percent), Canadian Dollar (-22 percent) and the EuroFX (-11 percent) following next with lower trend scores.
Strength Trend Statistics:
US Dollar Index (32.2 percent) vs US Dollar Index previous week (33.6 percent)
EuroFX (-10.9 percent) vs EuroFX previous week (1.4 percent)
British Pound Sterling (42.5 percent) vs British Pound Sterling previous week (46.0 percent)
Japanese Yen (-29.9 percent) vs Japanese Yen previous week (-8.0 percent)
Swiss Franc (10.8 percent) vs Swiss Franc previous week (7.9 percent)
Canadian Dollar (-22.3 percent) vs Canadian Dollar previous week (-41.6 percent)
Australian Dollar (63.8 percent) vs Australian Dollar previous week (27.3 percent)
New Zealand Dollar (79.0 percent) vs New Zealand Dollar previous week (65.8 percent)
Mexican Peso (-27.1 percent) vs Mexican Peso previous week (-30.4 percent)
Brazilian Real (18.0 percent) vs Brazilian Real previous week (20.2 percent)
Bitcoin (-6.7 percent) vs Bitcoin previous week (0.9 percent)
Individual COT Forex Markets:
US Dollar Index Futures:
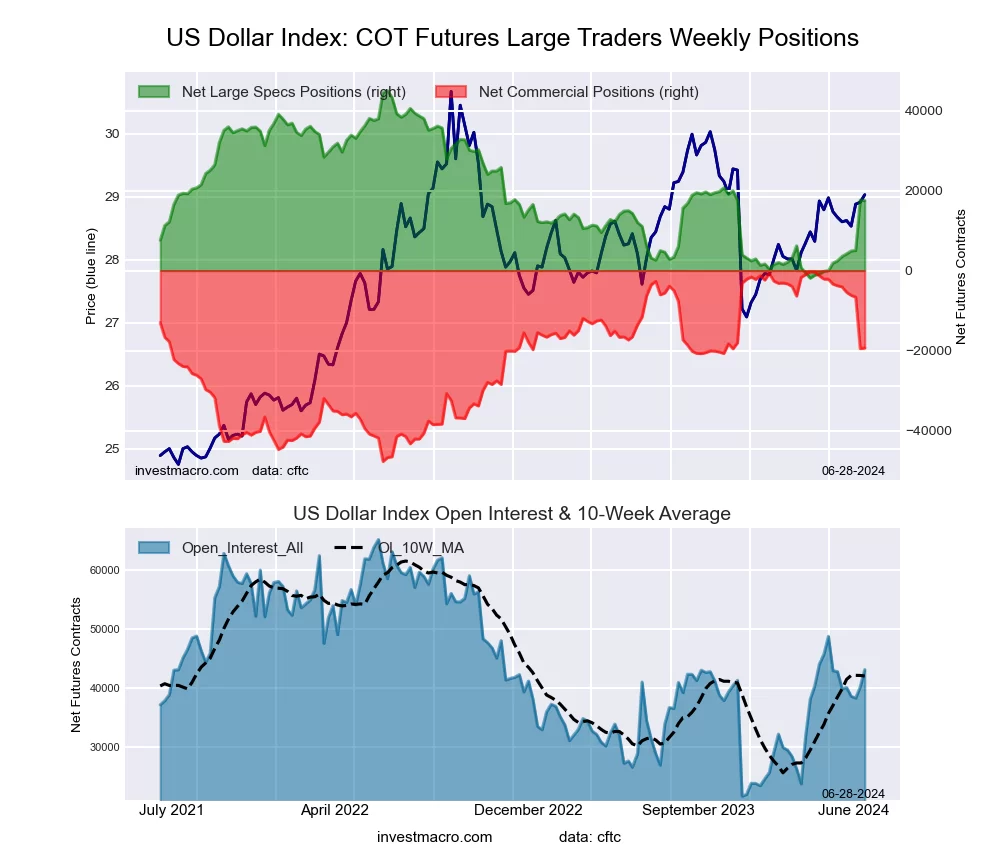 The US Dollar Index large speculator standing this week resulted in a net position of 17,522 contracts in the data reported through Tuesday. This was a weekly lowering of -73 contracts from the previous week which had a total of 17,595 net contracts.
This week’s current strength score (the trader positioning range over the past three years, measured from 0 to 100) shows the speculators are currently Bearish with a score of 41.4 percent. The commercials are Bullish with a score of 59.8 percent and the small traders (not shown in chart) are Bearish with a score of 32.6 percent.
Price Trend-Following Model: Strong Uptrend
Our weekly trend-following model classifies the current market price position as: Strong Uptrend. The current action for the model is considered to be: Hold – Maintain Long Position.
| US DOLLAR INDEX Statistics | SPECULATORS | COMMERCIALS | SMALL TRADERS |
| – Percent of Open Interest Longs: | 74.0 | 14.6 | 8.9 |
| – Percent of Open Interest Shorts: | 33.4 | 59.5 | 4.6 |
| – Net Position: | 17,522 | -19,365 | 1,843 |
| – Gross Longs: | 31,947 | 6,304 | 3,848 |
| – Gross Shorts: | 14,425 | 25,669 | 2,005 |
| – Long to Short Ratio: | 2.2 to 1 | 0.2 to 1 | 1.9 to 1 |
| NET POSITION TREND: | | | |
| – Strength Index Score (3 Year Range Pct): | 41.4 | 59.8 | 32.6 |
| – Strength Index Reading (3 Year Range): | Bearish | Bullish | Bearish |
| NET POSITION MOVEMENT INDEX: | | | |
| – 6-Week Change in Strength Index: | 32.2 | -32.8 | 5.7 |
Euro Currency Futures:
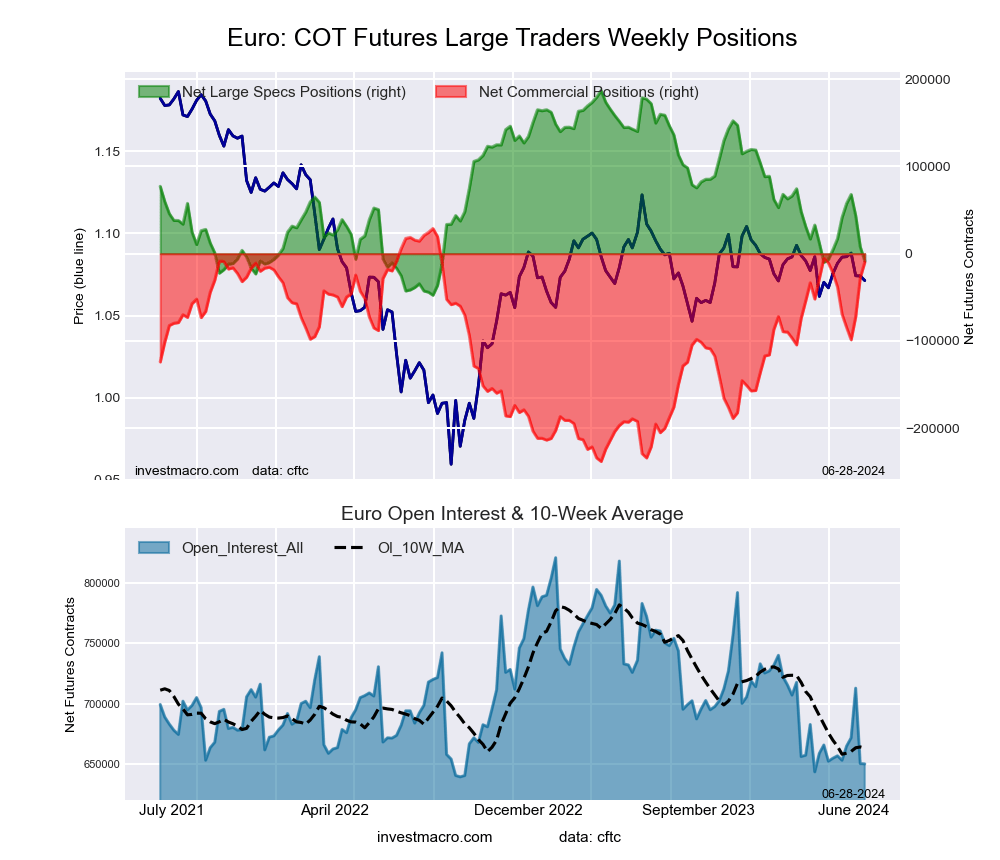 The Euro Currency large speculator standing this week resulted in a net position of -8,431 contracts in the data reported through Tuesday. This was a weekly fall of -16,382 contracts from the previous week which had a total of 7,951 net contracts.
This week’s current strength score (the trader positioning range over the past three years, measured from 0 to 100) shows the speculators are currently Bearish-Extreme with a score of 16.7 percent. The commercials are Bullish-Extreme with a score of 85.5 percent and the small traders (not shown in chart) are Bearish-Extreme with a score of 11.5 percent.
Price Trend-Following Model: Strong Downtrend
Our weekly trend-following model classifies the current market price position as: Strong Downtrend. The current action for the model is considered to be: Hold – Maintain Short Position.
| EURO Currency Statistics | SPECULATORS | COMMERCIALS | SMALL TRADERS |
| – Percent of Open Interest Longs: | 25.7 | 60.1 | 11.0 |
| – Percent of Open Interest Shorts: | 27.0 | 61.6 | 8.2 |
| – Net Position: | -8,431 | -9,767 | 18,198 |
| – Gross Longs: | 167,370 | 390,837 | 71,392 |
| – Gross Shorts: | 175,801 | 400,604 | 53,194 |
| – Long to Short Ratio: | 1.0 to 1 | 1.0 to 1 | 1.3 to 1 |
| NET POSITION TREND: | | | |
| – Strength Index Score (3 Year Range Pct): | 16.7 | 85.5 | 11.5 |
| – Strength Index Reading (3 Year Range): | Bearish-Extreme | Bullish-Extreme | Bearish-Extreme |
| NET POSITION MOVEMENT INDEX: | | | |
| – 6-Week Change in Strength Index: | -10.9 | 10.7 | -6.7 |
British Pound Sterling Futures:
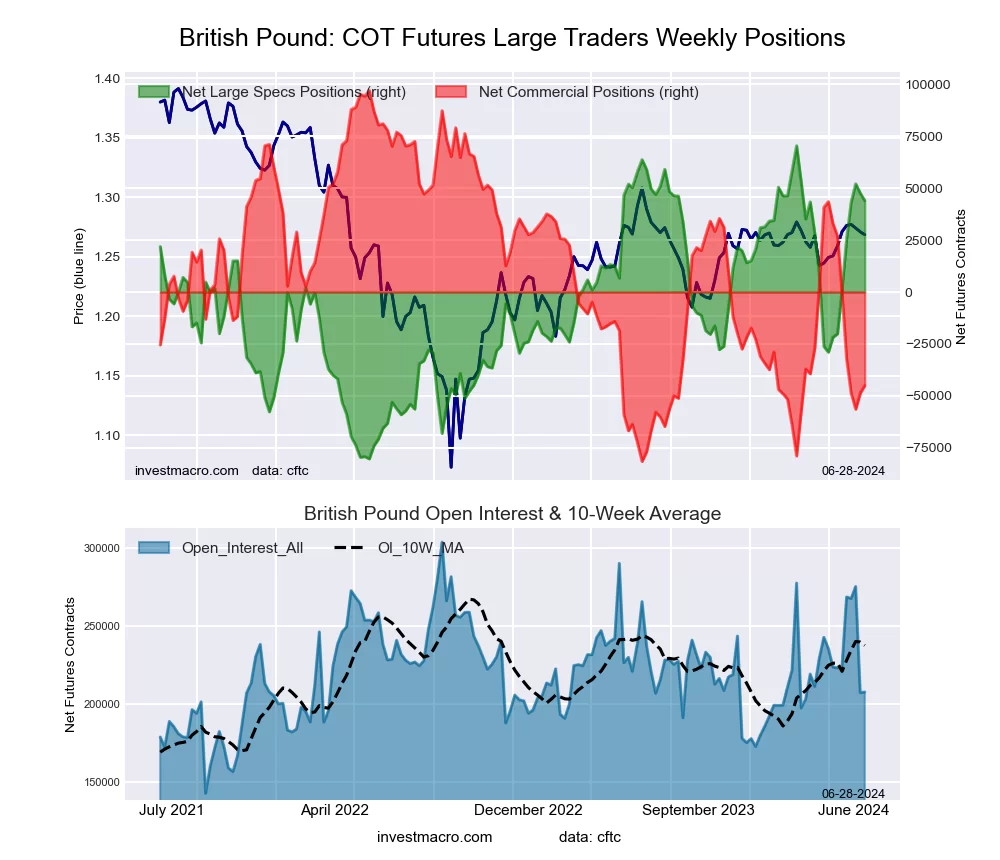 The British Pound Sterling large speculator standing this week resulted in a net position of 44,048 contracts in the data reported through Tuesday. This was a weekly fall of -3,573 contracts from the previous week which had a total of 47,621 net contracts.
This week’s current strength score (the trader positioning range over the past three years, measured from 0 to 100) shows the speculators are currently Bullish-Extreme with a score of 82.5 percent. The commercials are Bearish with a score of 20.5 percent and the small traders (not shown in chart) are Bullish with a score of 64.2 percent.
Price Trend-Following Model: Strong Uptrend
Our weekly trend-following model classifies the current market price position as: Strong Uptrend. The current action for the model is considered to be: Hold – Maintain Long Position.
| BRITISH POUND Statistics | SPECULATORS | COMMERCIALS | SMALL TRADERS |
| – Percent of Open Interest Longs: | 49.4 | 33.5 | 13.6 |
| – Percent of Open Interest Shorts: | 28.2 | 55.1 | 13.1 |
| – Net Position: | 44,048 | -45,026 | 978 |
| – Gross Longs: | 102,547 | 69,497 | 28,209 |
| – Gross Shorts: | 58,499 | 114,523 | 27,231 |
| – Long to Short Ratio: | 1.8 to 1 | 0.6 to 1 | 1.0 to 1 |
| NET POSITION TREND: | | | |
| – Strength Index Score (3 Year Range Pct): | 82.5 | 20.5 | 64.2 |
| – Strength Index Reading (3 Year Range): | Bullish-Extreme | Bearish | Bullish |
| NET POSITION MOVEMENT INDEX: | | | |
| – 6-Week Change in Strength Index: | 42.5 | -40.2 | 16.2 |
Japanese Yen Futures:
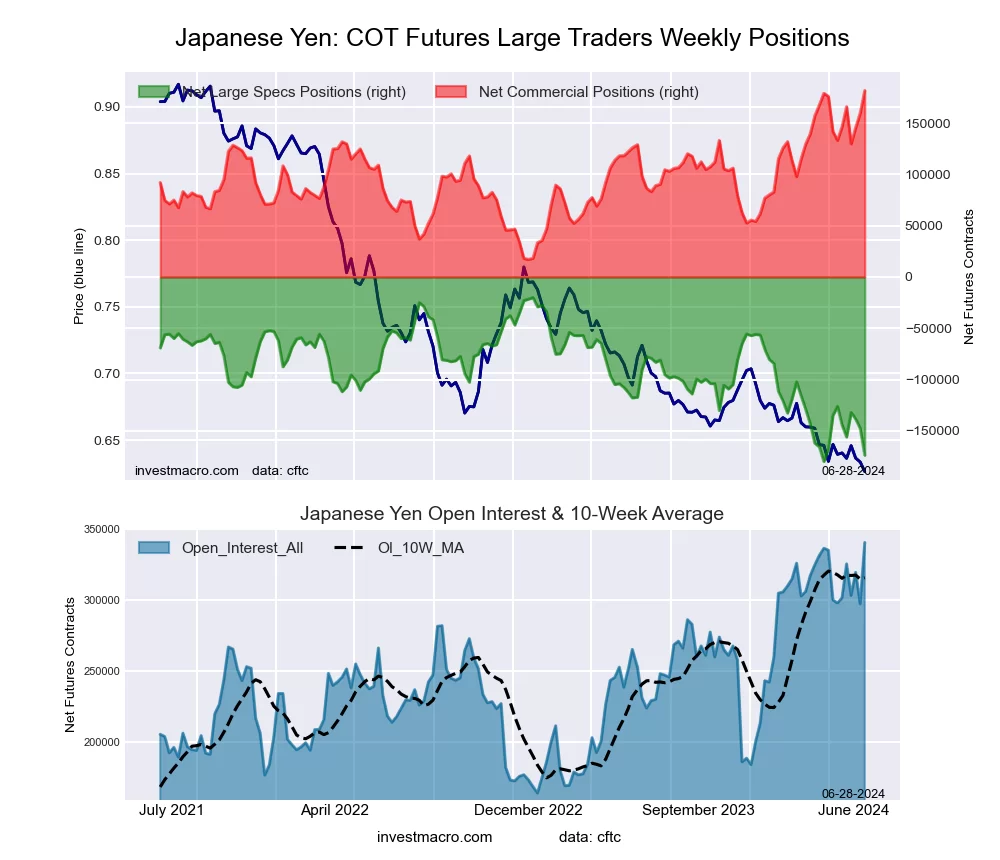 The Japanese Yen large speculator standing this week resulted in a net position of -173,900 contracts in the data reported through Tuesday. This was a weekly decline of -26,147 contracts from the previous week which had a total of -147,753 net contracts.
This week’s current strength score (the trader positioning range over the past three years, measured from 0 to 100) shows the speculators are currently Bearish-Extreme with a score of 3.8 percent. The commercials are Bullish-Extreme with a score of 100.0 percent and the small traders (not shown in chart) are Bullish with a score of 57.6 percent.
Price Trend-Following Model: Strong Downtrend
Our weekly trend-following model classifies the current market price position as: Strong Downtrend. The current action for the model is considered to be: Hold – Maintain Short Position.
| JAPANESE YEN Statistics | SPECULATORS | COMMERCIALS | SMALL TRADERS |
| – Percent of Open Interest Longs: | 10.2 | 76.2 | 11.1 |
| – Percent of Open Interest Shorts: | 61.3 | 22.8 | 13.5 |
| – Net Position: | -173,900 | 181,858 | -7,958 |
| – Gross Longs: | 34,576 | 259,292 | 37,891 |
| – Gross Shorts: | 208,476 | 77,434 | 45,849 |
| – Long to Short Ratio: | 0.2 to 1 | 3.3 to 1 | 0.8 to 1 |
| NET POSITION TREND: | | | |
| – Strength Index Score (3 Year Range Pct): | 3.8 | 100.0 | 57.6 |
| – Strength Index Reading (3 Year Range): | Bearish-Extreme | Bullish-Extreme | Bullish |
| NET POSITION MOVEMENT INDEX: | | | |
| – 6-Week Change in Strength Index: | -29.9 | 29.5 | -2.7 |
Swiss Franc Futures:
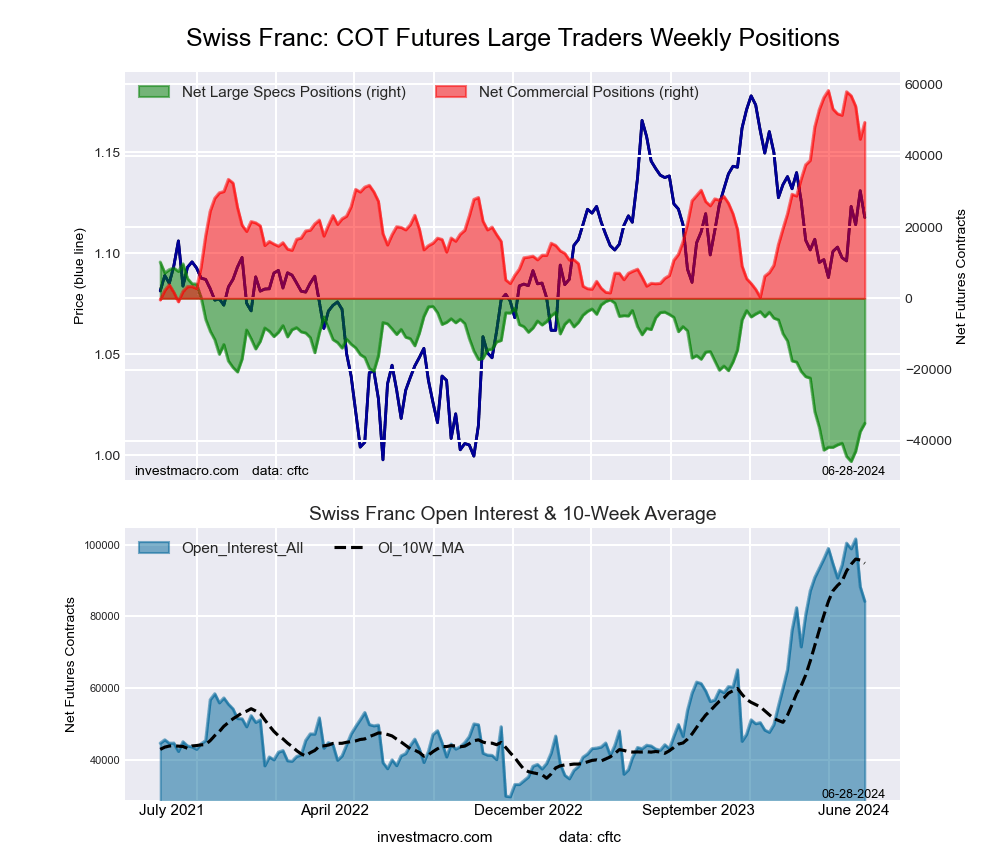 The Swiss Franc large speculator standing this week resulted in a net position of -35,057 contracts in the data reported through Tuesday. This was a weekly advance of 2,333 contracts from the previous week which had a total of -37,390 net contracts.
This week’s current strength score (the trader positioning range over the past three years, measured from 0 to 100) shows the speculators are currently Bearish-Extreme with a score of 19.1 percent. The commercials are Bullish-Extreme with a score of 84.9 percent and the small traders (not shown in chart) are Bearish-Extreme with a score of 12.3 percent.
Price Trend-Following Model: Downtrend
Our weekly trend-following model classifies the current market price position as: Downtrend. The current action for the model is considered to be: Hold – Maintain Short Position.
| SWISS FRANC Statistics | SPECULATORS | COMMERCIALS | SMALL TRADERS |
| – Percent of Open Interest Longs: | 7.7 | 80.7 | 11.0 |
| – Percent of Open Interest Shorts: | 49.4 | 22.1 | 27.9 |
| – Net Position: | -35,057 | 49,331 | -14,274 |
| – Gross Longs: | 6,506 | 67,969 | 9,253 |
| – Gross Shorts: | 41,563 | 18,638 | 23,527 |
| – Long to Short Ratio: | 0.2 to 1 | 3.6 to 1 | 0.4 to 1 |
| NET POSITION TREND: | | | |
| – Strength Index Score (3 Year Range Pct): | 19.1 | 84.9 | 12.3 |
| – Strength Index Reading (3 Year Range): | Bearish-Extreme | Bullish-Extreme | Bearish-Extreme |
| NET POSITION MOVEMENT INDEX: | | | |
| – 6-Week Change in Strength Index: | 10.8 | -4.1 | -16.4 |
Canadian Dollar Futures:
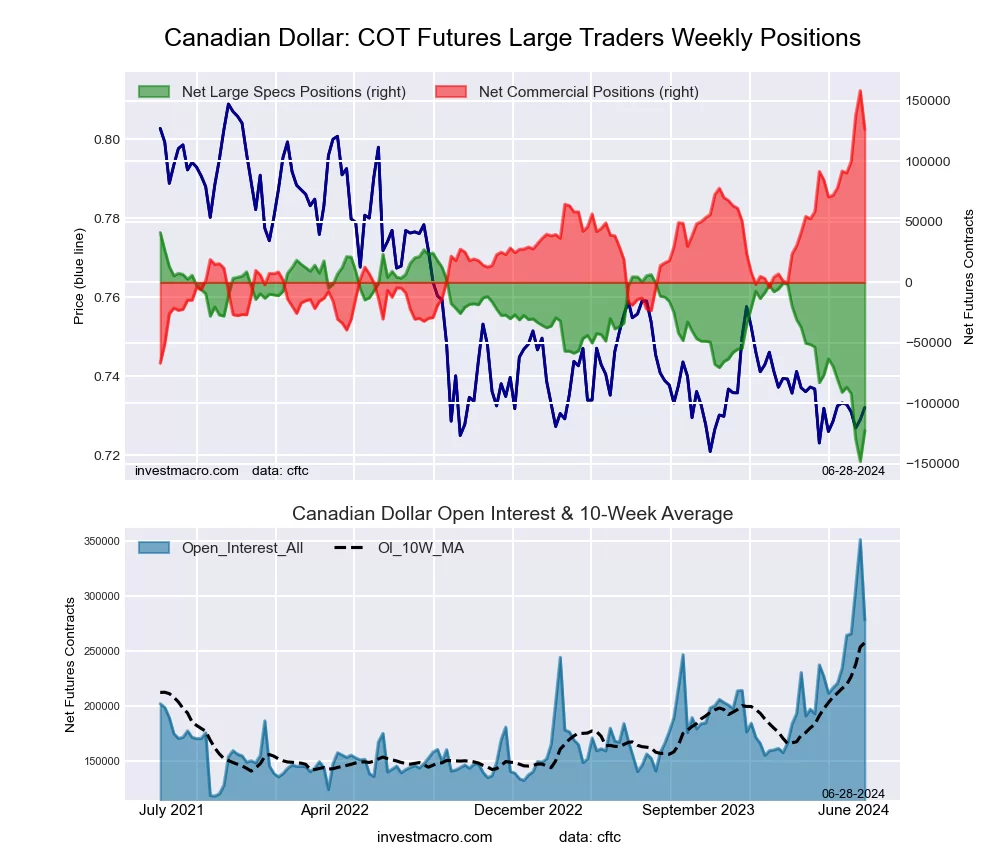 The Canadian Dollar large speculator standing this week resulted in a net position of -122,412 contracts in the data reported through Tuesday. This was a weekly boost of 25,519 contracts from the previous week which had a total of -147,931 net contracts.
This week’s current strength score (the trader positioning range over the past three years, measured from 0 to 100) shows the speculators are currently Bearish-Extreme with a score of 13.5 percent. The commercials are Bullish-Extreme with a score of 85.8 percent and the small traders (not shown in chart) are Bearish-Extreme with a score of 18.2 percent.
Price Trend-Following Model: Downtrend
Our weekly trend-following model classifies the current market price position as: Downtrend. The current action for the model is considered to be: Hold – Maintain Short Position.
| CANADIAN DOLLAR Statistics | SPECULATORS | COMMERCIALS | SMALL TRADERS |
| – Percent of Open Interest Longs: | 10.0 | 76.9 | 10.4 |
| – Percent of Open Interest Shorts: | 53.9 | 31.5 | 11.8 |
| – Net Position: | -122,412 | 126,330 | -3,918 |
| – Gross Longs: | 27,790 | 214,107 | 29,063 |
| – Gross Shorts: | 150,202 | 87,777 | 32,981 |
| – Long to Short Ratio: | 0.2 to 1 | 2.4 to 1 | 0.9 to 1 |
| NET POSITION TREND: | | | |
| – Strength Index Score (3 Year Range Pct): | 13.5 | 85.8 | 18.2 |
| – Strength Index Reading (3 Year Range): | Bearish-Extreme | Bullish-Extreme | Bearish-Extreme |
| NET POSITION MOVEMENT INDEX: | | | |
| – 6-Week Change in Strength Index: | -22.3 | 21.4 | -16.7 |
Australian Dollar Futures:
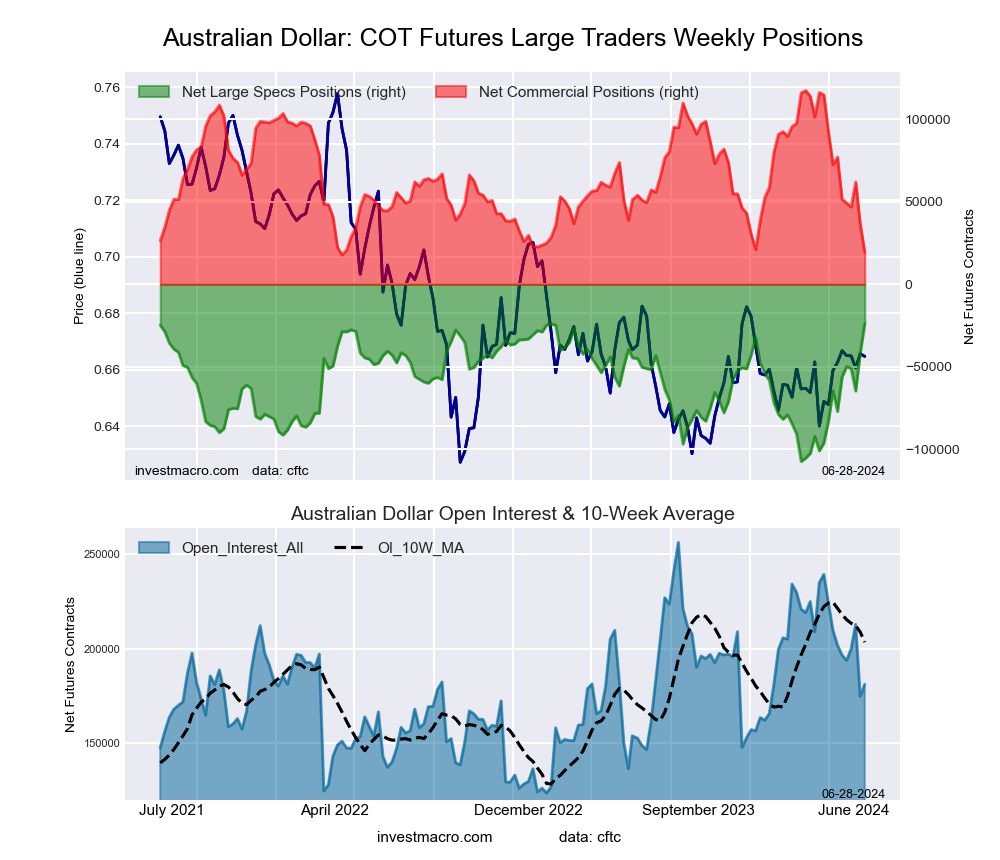 The Australian Dollar large speculator standing this week resulted in a net position of -23,676 contracts in the data reported through Tuesday. This was a weekly advance of 17,980 contracts from the previous week which had a total of -41,656 net contracts.
This week’s current strength score (the trader positioning range over the past three years, measured from 0 to 100) shows the speculators are currently Bullish-Extreme with a score of 100.0 percent. The commercials are Bearish-Extreme with a score of 1.5 percent and the small traders (not shown in chart) are Bullish with a score of 70.4 percent.
Price Trend-Following Model: Strong Uptrend
Our weekly trend-following model classifies the current market price position as: Strong Uptrend. The current action for the model is considered to be: Hold – Maintain Long Position.
| AUSTRALIAN DOLLAR Statistics | SPECULATORS | COMMERCIALS | SMALL TRADERS |
| – Percent of Open Interest Longs: | 35.7 | 45.6 | 15.1 |
| – Percent of Open Interest Shorts: | 48.8 | 34.9 | 12.7 |
| – Net Position: | -23,676 | 19,343 | 4,333 |
| – Gross Longs: | 64,620 | 82,549 | 27,370 |
| – Gross Shorts: | 88,296 | 63,206 | 23,037 |
| – Long to Short Ratio: | 0.7 to 1 | 1.3 to 1 | 1.2 to 1 |
| NET POSITION TREND: | | | |
| – Strength Index Score (3 Year Range Pct): | 100.0 | 1.5 | 70.4 |
| – Strength Index Reading (3 Year Range): | Bullish-Extreme | Bearish-Extreme | Bullish |
| NET POSITION MOVEMENT INDEX: | | | |
| – 6-Week Change in Strength Index: | 63.8 | -58.0 | 11.7 |
New Zealand Dollar Futures:
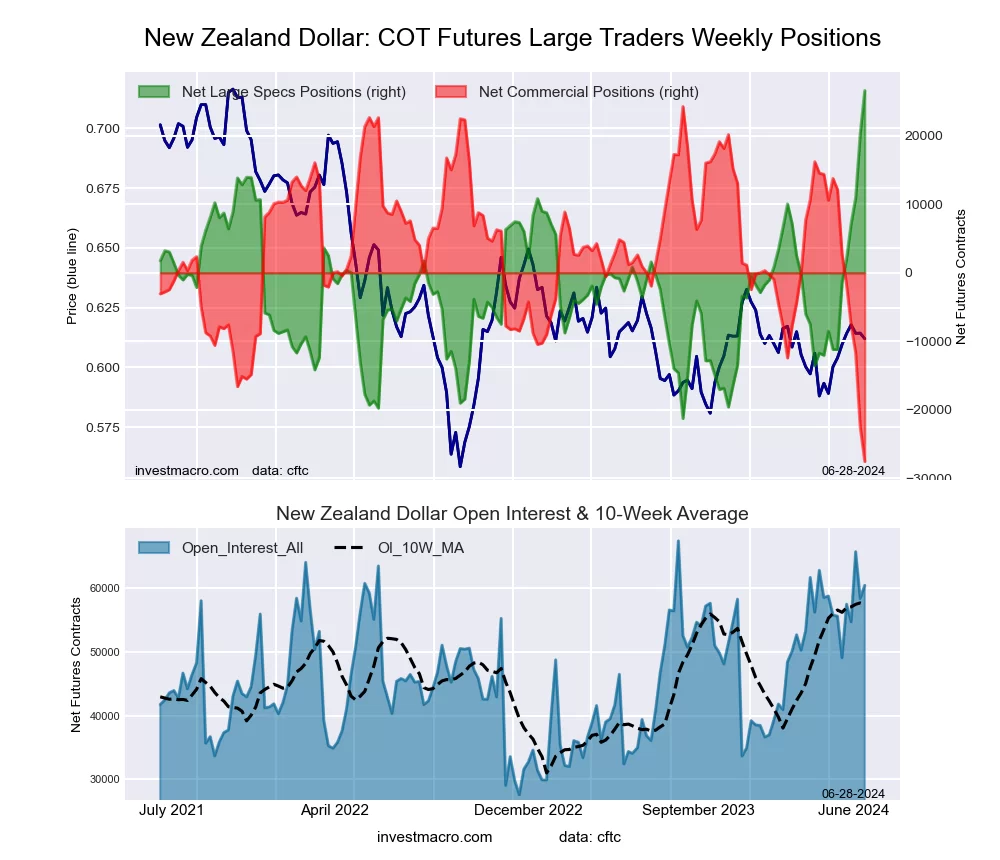 The New Zealand Dollar large speculator standing this week resulted in a net position of 26,642 contracts in the data reported through Tuesday. This was a weekly advance of 6,313 contracts from the previous week which had a total of 20,329 net contracts.
This week’s current strength score (the trader positioning range over the past three years, measured from 0 to 100) shows the speculators are currently Bullish-Extreme with a score of 100.0 percent. The commercials are Bearish-Extreme with a score of 0.0 percent and the small traders (not shown in chart) are Bullish with a score of 71.3 percent.
Price Trend-Following Model: Weak Downtrend
Our weekly trend-following model classifies the current market price position as: Weak Downtrend. The current action for the model is considered to be: Hold – Maintain Short Position.
| NEW ZEALAND DOLLAR Statistics | SPECULATORS | COMMERCIALS | SMALL TRADERS |
| – Percent of Open Interest Longs: | 72.3 | 17.8 | 7.5 |
| – Percent of Open Interest Shorts: | 28.2 | 63.4 | 6.0 |
| – Net Position: | 26,642 | -27,567 | 925 |
| – Gross Longs: | 43,711 | 10,779 | 4,540 |
| – Gross Shorts: | 17,069 | 38,346 | 3,615 |
| – Long to Short Ratio: | 2.6 to 1 | 0.3 to 1 | 1.3 to 1 |
| NET POSITION TREND: | | | |
| – Strength Index Score (3 Year Range Pct): | 100.0 | 0.0 | 71.3 |
| – Strength Index Reading (3 Year Range): | Bullish-Extreme | Bearish-Extreme | Bullish |
| NET POSITION MOVEMENT INDEX: | | | |
| – 6-Week Change in Strength Index: | 79.0 | -76.6 | 26.3 |
Mexican Peso Futures:
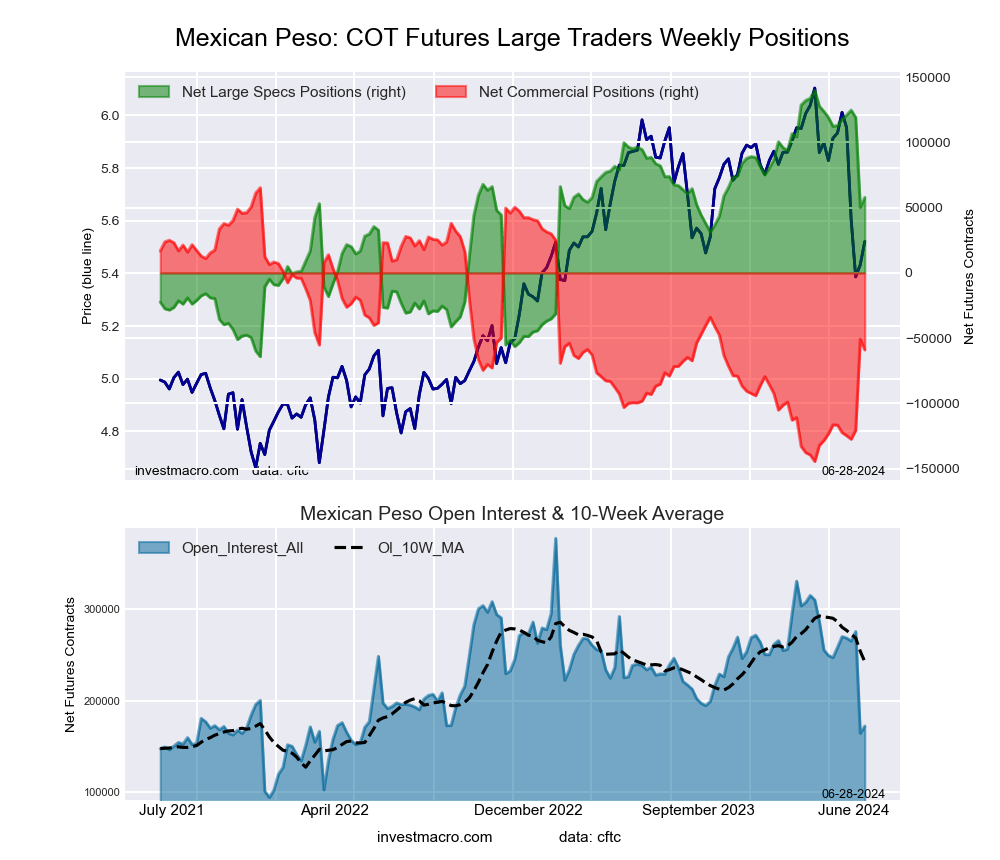 The Mexican Peso large speculator standing this week resulted in a net position of 57,806 contracts in the data reported through Tuesday. This was a weekly lift of 7,552 contracts from the previous week which had a total of 50,254 net contracts.
This week’s current strength score (the trader positioning range over the past three years, measured from 0 to 100) shows the speculators are currently Bullish with a score of 59.8 percent. The commercials are Bearish with a score of 40.8 percent and the small traders (not shown in chart) are Bearish-Extreme with a score of 18.6 percent.
Price Trend-Following Model: Strong Downtrend
Our weekly trend-following model classifies the current market price position as: Strong Downtrend. The current action for the model is considered to be: Hold – Maintain Short Position.
| MEXICAN PESO Statistics | SPECULATORS | COMMERCIALS | SMALL TRADERS |
| – Percent of Open Interest Longs: | 49.0 | 47.4 | 2.9 |
| – Percent of Open Interest Shorts: | 15.4 | 81.7 | 2.2 |
| – Net Position: | 57,806 | -58,963 | 1,157 |
| – Gross Longs: | 84,314 | 81,667 | 5,020 |
| – Gross Shorts: | 26,508 | 140,630 | 3,863 |
| – Long to Short Ratio: | 3.2 to 1 | 0.6 to 1 | 1.3 to 1 |
| NET POSITION TREND: | | | |
| – Strength Index Score (3 Year Range Pct): | 59.8 | 40.8 | 18.6 |
| – Strength Index Reading (3 Year Range): | Bullish | Bearish | Bearish-Extreme |
| NET POSITION MOVEMENT INDEX: | | | |
| – 6-Week Change in Strength Index: | -27.1 | 27.5 | -15.8 |
Brazilian Real Futures:
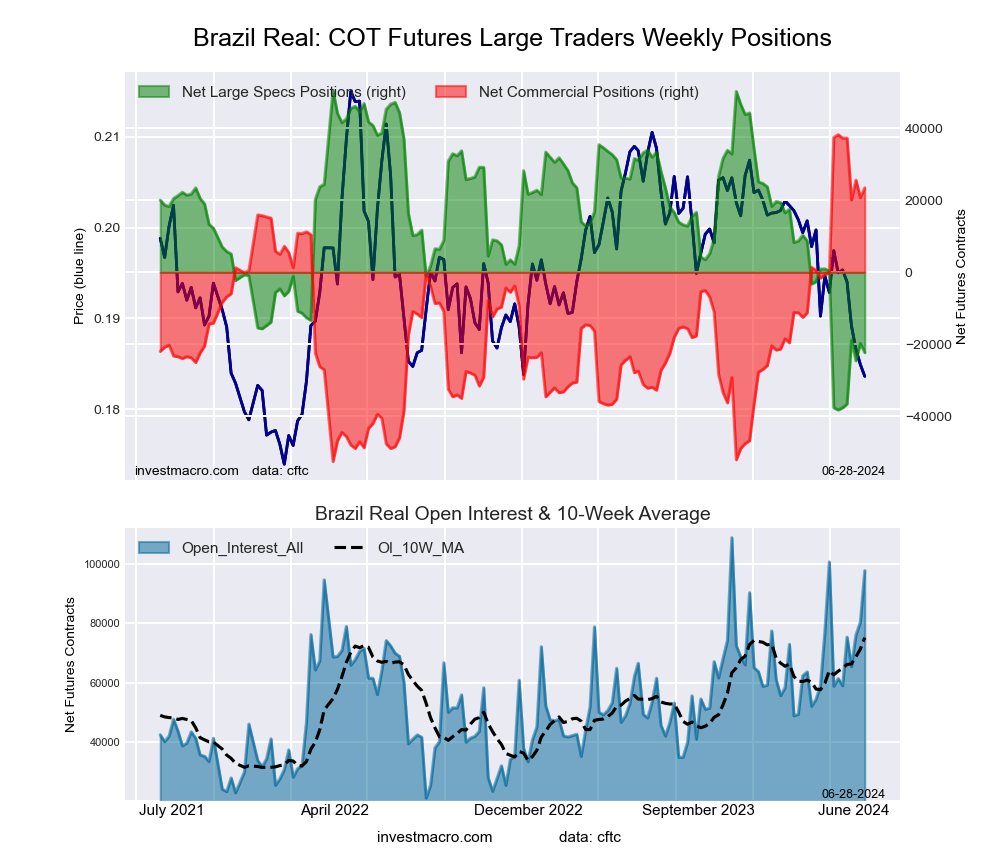 The Brazilian Real large speculator standing this week resulted in a net position of -22,320 contracts in the data reported through Tuesday. This was a weekly reduction of -2,563 contracts from the previous week which had a total of -19,757 net contracts.
This week’s current strength score (the trader positioning range over the past three years, measured from 0 to 100) shows the speculators are currently Bearish-Extreme with a score of 18.0 percent. The commercials are Bullish-Extreme with a score of 83.7 percent and the small traders (not shown in chart) are Bearish with a score of 23.7 percent.
Price Trend-Following Model: Strong Downtrend
Our weekly trend-following model classifies the current market price position as: Strong Downtrend. The current action for the model is considered to be: Hold – Maintain Short Position.
| BRAZIL REAL Statistics | SPECULATORS | COMMERCIALS | SMALL TRADERS |
| – Percent of Open Interest Longs: | 38.5 | 56.3 | 2.2 |
| – Percent of Open Interest Shorts: | 61.4 | 32.2 | 3.3 |
| – Net Position: | -22,320 | 23,477 | -1,157 |
| – Gross Longs: | 37,622 | 54,945 | 2,107 |
| – Gross Shorts: | 59,942 | 31,468 | 3,264 |
| – Long to Short Ratio: | 0.6 to 1 | 1.7 to 1 | 0.6 to 1 |
| NET POSITION TREND: | | | |
| – Strength Index Score (3 Year Range Pct): | 18.0 | 83.7 | 23.7 |
| – Strength Index Reading (3 Year Range): | Bearish-Extreme | Bullish-Extreme | Bearish |
| NET POSITION MOVEMENT INDEX: | | | |
| – 6-Week Change in Strength Index: | 18.0 | -16.3 | -10.9 |
Bitcoin Futures:
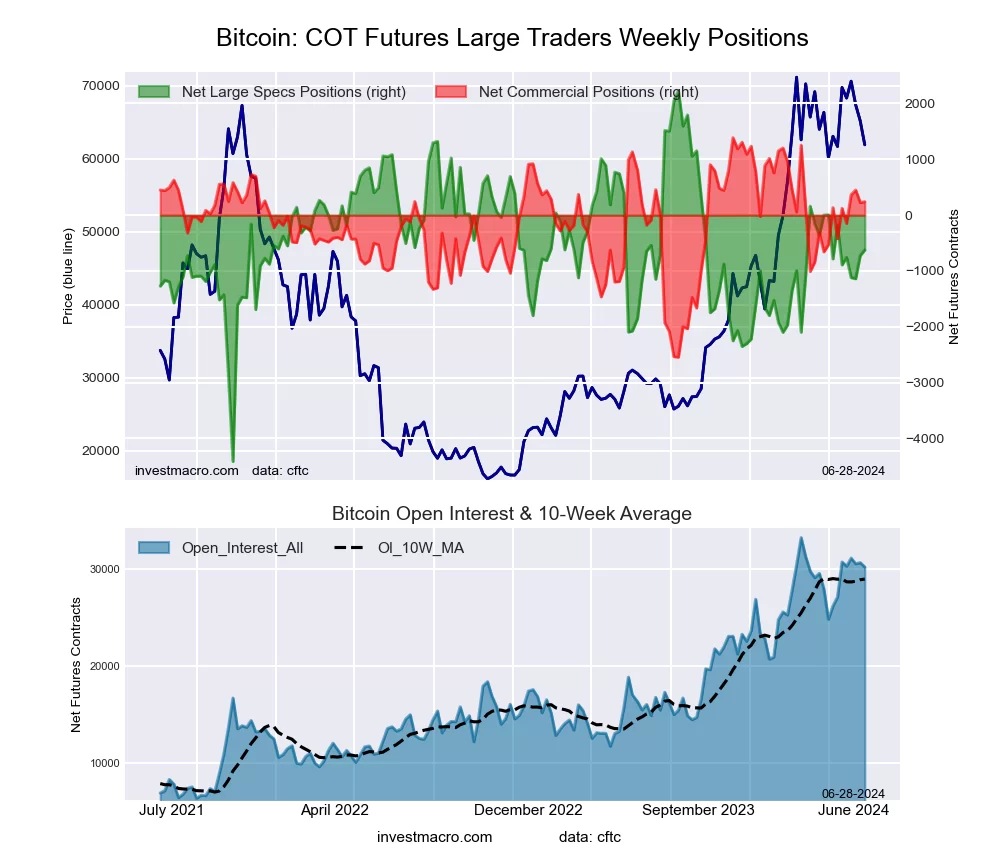 The Bitcoin large speculator standing this week resulted in a net position of -624 contracts in the data reported through Tuesday. This was a weekly increase of 99 contracts from the previous week which had a total of -723 net contracts.
This week’s current strength score (the trader positioning range over the past three years, measured from 0 to 100) shows the speculators are currently Bullish with a score of 57.0 percent. The commercials are Bullish with a score of 70.8 percent and the small traders (not shown in chart) are Bearish with a score of 21.6 percent.
Price Trend-Following Model: Weak Uptrend
Our weekly trend-following model classifies the current market price position as: Weak Uptrend. The current action for the model is considered to be: Hold – Maintain Long Position.
| BITCOIN Statistics | SPECULATORS | COMMERCIALS | SMALL TRADERS |
| – Percent of Open Interest Longs: | 73.3 | 3.7 | 5.0 |
| – Percent of Open Interest Shorts: | 75.3 | 2.9 | 3.7 |
| – Net Position: | -624 | 241 | 383 |
| – Gross Longs: | 22,103 | 1,121 | 1,499 |
| – Gross Shorts: | 22,727 | 880 | 1,116 |
| – Long to Short Ratio: | 1.0 to 1 | 1.3 to 1 | 1.3 to 1 |
| NET POSITION TREND: | | | |
| – Strength Index Score (3 Year Range Pct): | 57.0 | 70.8 | 21.6 |
| – Strength Index Reading (3 Year Range): | Bullish | Bullish | Bearish |
| NET POSITION MOVEMENT INDEX: | | | |
| – 6-Week Change in Strength Index: | -6.7 | 16.8 | -4.9 |
Article By InvestMacro – Receive our weekly COT Newsletter
*COT Report: The COT data, released weekly to the public each Friday, is updated through the most recent Tuesday (data is 3 days old) and shows a quick view of how large speculators or non-commercials (for-profit traders) were positioned in the futures markets.
The CFTC categorizes trader positions according to commercial hedgers (traders who use futures contracts for hedging as part of the business), non-commercials (large traders who speculate to realize trading profits) and nonreportable traders (usually small traders/speculators) as well as their open interest (contracts open in the market at time of reporting). See CFTC criteria here.