By JustMarkets
At Tuesday’s close, the Dow Jones (US30) Index was down 0.13%, while the S&P 500 (US500) Index added 0.07%. The NASDAQ Technology Index (US100) closed positive 0.14%. Stock indices showed mixed performance on Tuesday, with the S&P 500 (US500) and NASDAQ (US100) hitting new all-time highs. Strengthening bank and chip stocks led to a higher overall market.
Fed Chairman Powell said Tuesday that good data would bolster confidence that inflation is moving toward the Fed’s 2% target and recent data point to “modest further progress” in prices. He added that the labor market is strong but not overheated, and easing too quickly and too much could hurt inflation progress. Markets estimate the odds of a 25 bps rate cut at 5% at the next FOMC meeting on July 30–31 and 71% at the next meeting on September 17–18.
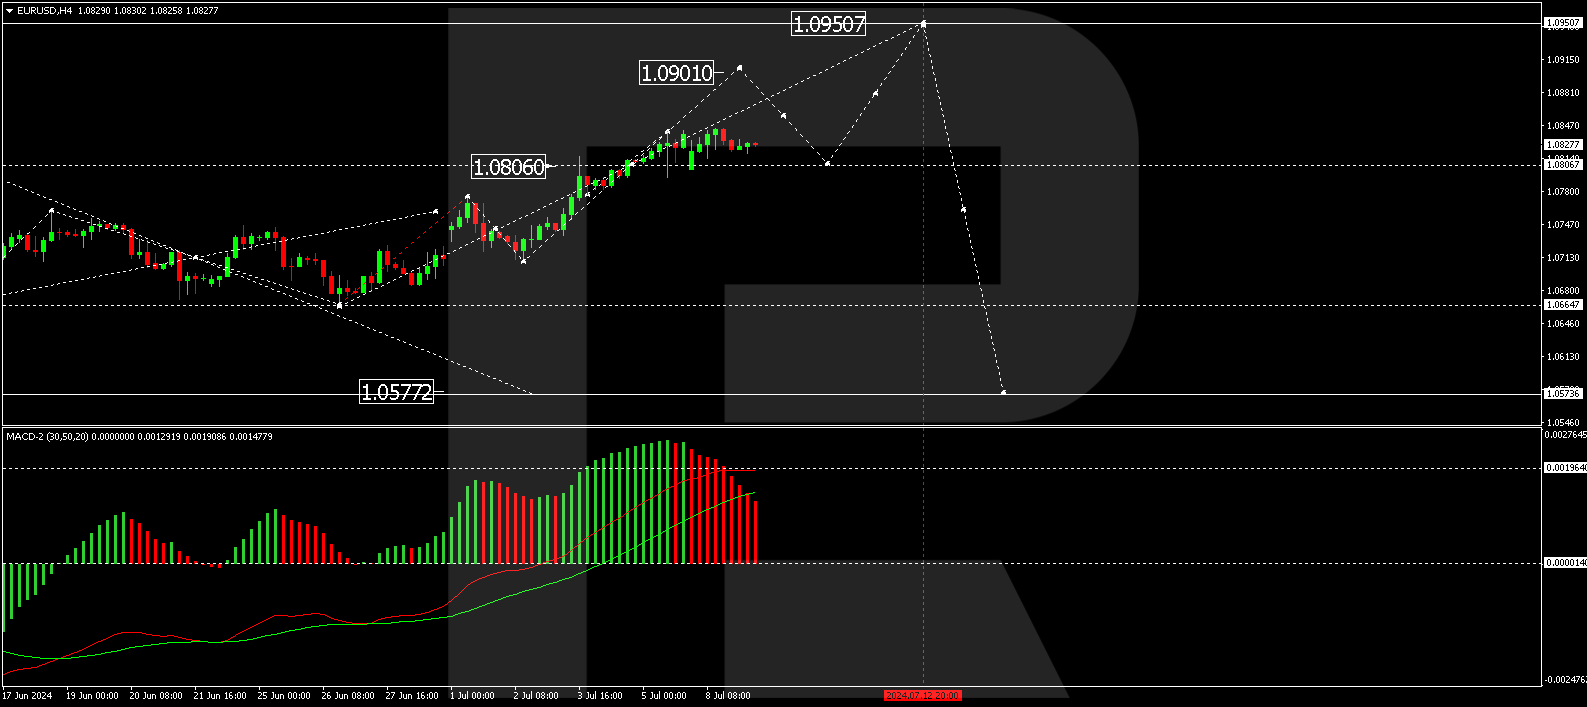
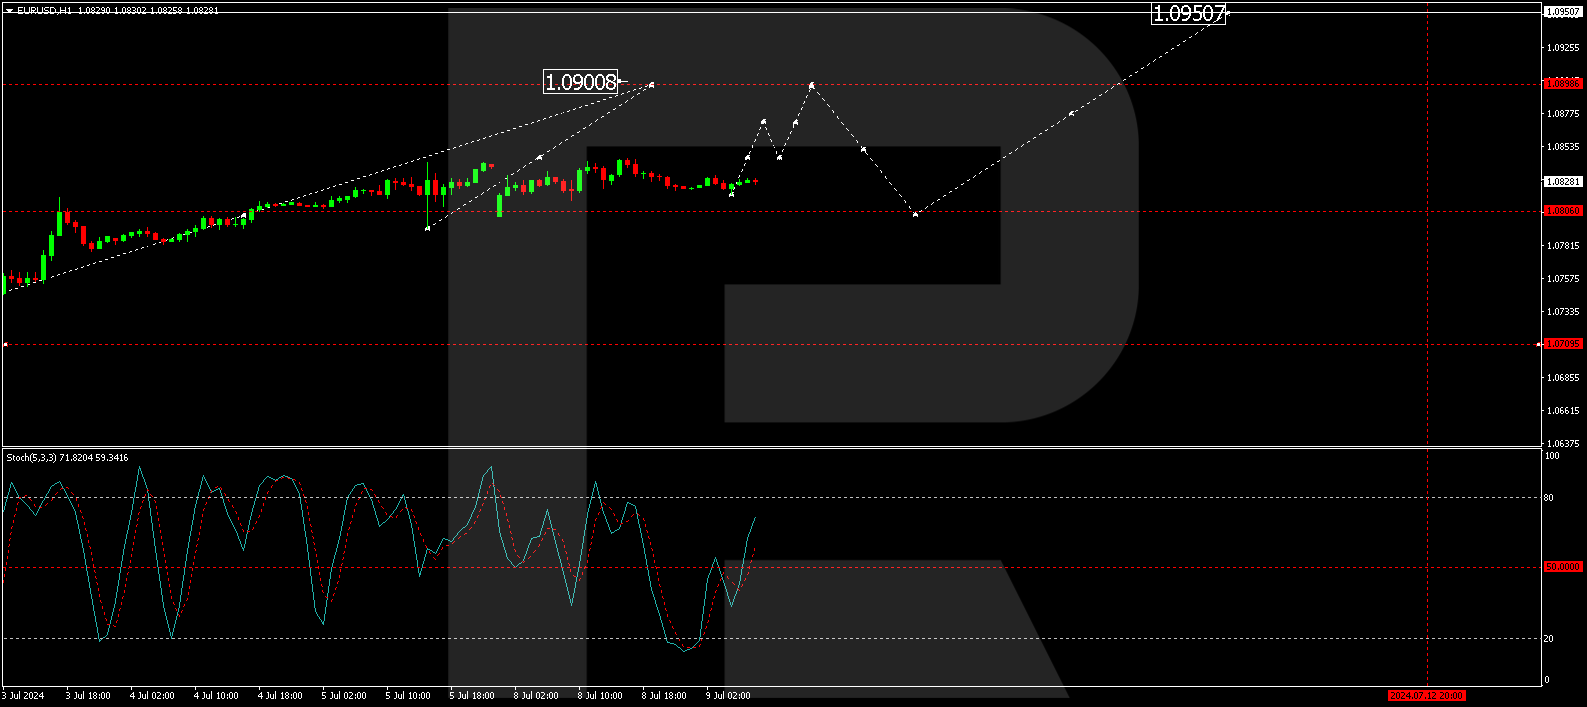
Markets await the US CPI report for June, due out on Thursday, to see if price pressures continue to ease. The consensus is that the June CPI fell to 3.1% y/y from 3.3% y/y in May, while the core CPI was unchanged from May at 3.4% y/y. Falling inflationary pressures may put pressure on the US dollar.
Equity markets in Europe were mostly down on Tuesday. Germany’s DAX (DE40) was down 0.02%, France’s CAC 40 (FR40) fell by 0.63%, Spain’s IBEX 35 (ES35) lost 0.01%, and the UK’s FTSE 100 (UK100) closed negative 0.13%. European equity markets opened higher on Wednesday amid easing political concerns in France. France faces a hung parliament after no party won an outright majority in Sunday’s election, although the left-wing New Popular Front won the most seats.
Norway’s annual consumer inflation rate slowed to 2.6% in June 2024, down from 3% the previous month and below market estimates of 2.9%. This is the lowest since December 2020, mainly due to lower inflation for food and non-alcoholic beverages (4.9% vs. 5.4%), recreation and culture (4% vs. 7.6%) and healthcare (4.6% vs. 4.8%).
WTI crude oil prices hovered around $81.5 a barrel on Wednesday, trying to break a three-day decline as traders reacted to a larger-than-expected drop in US crude inventories. According to API data, the US crude oil inventories fell by 1.923 million barrels in the week ended July 5, significantly higher than market expectations for a 0.25 million barrel decline. In addition, oil prices are supported by the growing likelihood of an interest rate cut by the Federal Reserve. This move is seen as a potential boost to economic activity and demand.
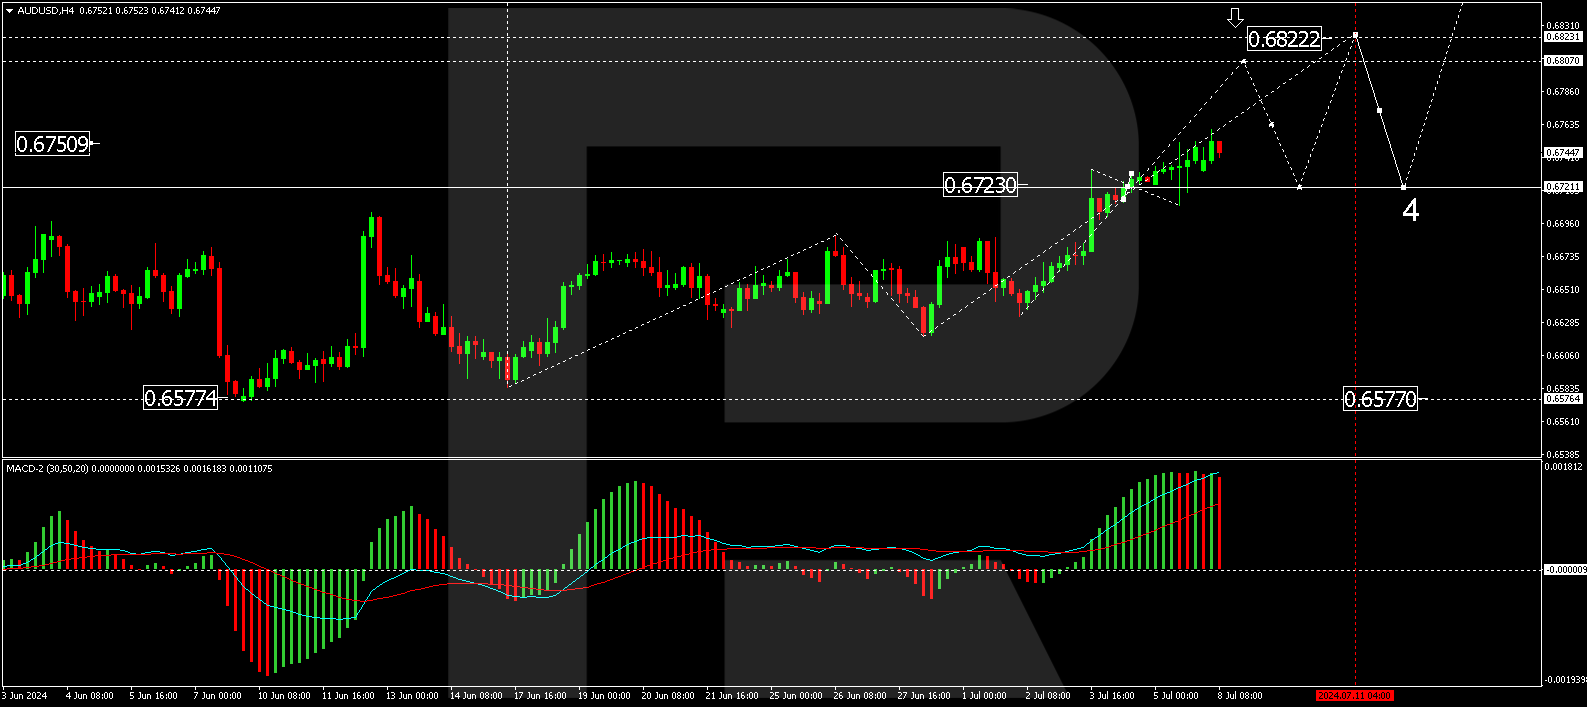
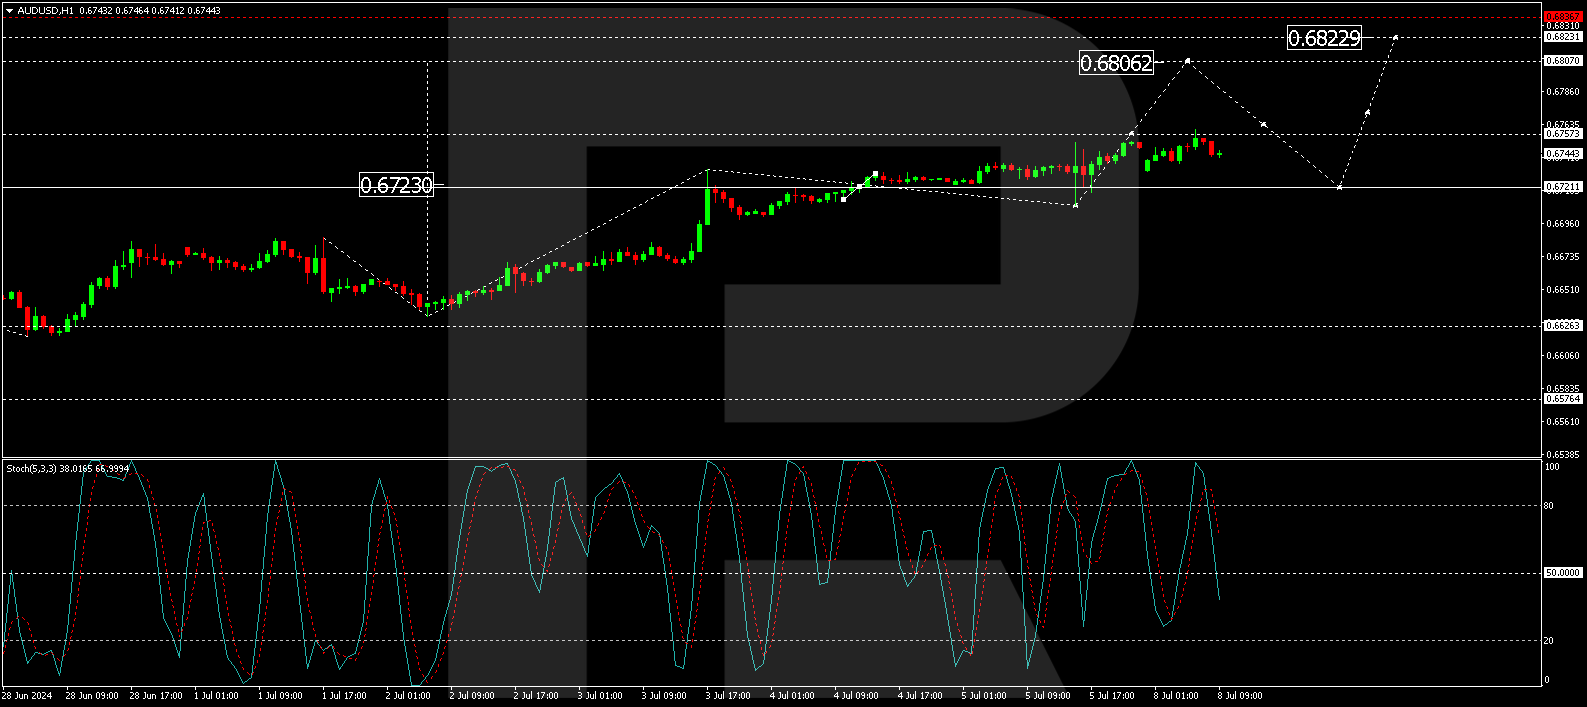
Asian markets were predominantly up yesterday. Japan’s Nikkei 225 (JP225) rose by 1.96%, China’s FTSE China A50 (CHA50) climbed 0.99%, Hong Kong’s Hang Seng (HK50) was little changed for the day, and Australia’s ASX 200 (AU200) was positive 0.86%. Stock indices in Asia continued to rise at Wednesday’s open as soft consumer inflation data in China bolstered the case for easing monetary policy in the country.
China’s annual inflation rate fell to 0.2% in June 2024 from 0.3% in the previous two months, falling short of market estimates of 0.4%. It was the fifth straight month of rising consumer inflation but the lowest since March amid a fragile economic recovery. Food prices fell for the 12th month (-2.1% vs. -2.0%) despite a sharp price rise during the Dragon Boat Festival. The offshore yuan weakened to 7.29 per dollar.
The Reserve Bank of New Zealand (RBNZ) kept the official cash rate (OCR) at 5.5% at the July 2024 policy meeting, extending the rate pause for the eighth consecutive time and confirming market expectations. Policymakers noted that restrictive monetary policy has eased pressure on manufacturing capacity and lowered consumer price inflation. Core inflation fell to a nearly three-year low of 4% in the first quarter of 2024 but was still above the target range of 1-3%. The Committee continues to expect core inflation to return to the target range in the second half of the year. The degree of restraint will be gradually adjusted in line with the expected decline in inflationary pressures.
S&P 500 (US500) 5,576.98 +4.13 (0.074%)
Dow Jones (US30) 39,291.97 −52.82 (0.13%)
DAX (DE40) 18,236.19 −235.86 (1.28%)
FTSE 100 (UK100) 8,139.81 −53.68 (0.66%)
USD Index 105.12 +0.12 (+0.11%)
- – Japan Producer Price Index (m/m) at 02:50 (GMT+3);
- – China Consumer Price Index (m/m) at 04:30 (GMT+3);
- – China Producer Price Index (m/m) at 04:30 (GMT+3);
- – New Zealand RBNZ Interest Rate Decision at 05:00 (GMT+3);
- – New Zealand RBNZ Rate Statement at 05:00 (GMT+3);
- – US Fed Chair Powell Testifies at 17:00 (GMT+3);
- – US Crude Oil Reserves (w/w) at 17:30 (GMT+3);
- – US FOMC Member Bowman Speaks at 21:30 (GMT+3).
By JustMarkets
This article reflects a personal opinion and should not be interpreted as an investment advice, and/or offer, and/or a persistent request for carrying out financial transactions, and/or a guarantee, and/or a forecast of future events.