By JustMarkets
At Wednesday’s end, the Dow Jones Index (US30) rose by 0.32%. The S&P 500 Index (US500) closed at the opening price. The Nasdaq Technology Index (US100) declined 0.08%.
Nvidia (NVDA) reported fiscal third-quarter results that beat Wall Street estimates, but its plans for the current quarter fell short of investors’ inflated expectations amid hot demand for artificial intelligence. NVIDIA Corporation shares fell more than 2% in after-hours trading following the report. Qualcomm (QCOM) closed down more than 6%, leading to a decline in chip stocks after Susquehanna Financial cut its price target on the company’s shares to $210 from $230. Additionally, shares of Advanced Micro Devices (AMD) and Texas Instruments (TXN) were down more than 1%.
Of the 90% of S&P 500 companies that posted Q3 earnings, 75% beat estimates, slightly below the 3-year average. According to Bloomberg Intelligence, S&P 500 companies reported an average 8.5% year-over-year increase in Q3 quarterly earnings, more than double estimates.
Equity markets in Europe ended trading yesterday on a weak note. The German DAX (DE40) fell by 0.29%, the French CAC 40 (FR40) closed down 0.43%, the Spanish IBEX 35 (ES35) rose by 0.01%, the British FTSE 100 (UK100) closed down 0.17%. Investors sold risk assets following reports that Ukraine fired UK-made Storm Shadow missiles at Russian territory for the first time since the war began in 2022. This followed the firing of US-made ATACMS missiles the same morning Russia expanded the scenario, justifying the use of nuclear weapons and raising fears of a wider conflict with possible NATO involvement. However, by the end of the day, geopolitical tensions in Europe had eased after Reuters reported that Russian President Putin was willing to discuss a ceasefire agreement in Ukraine with US President-elect Trump, which could roughly freeze the war on current front lines.
The US crude inventories rose by 545,000 barrels last week, exceeding market projections. Oil markets have come under pressure in recent months amid concerns about a possible oil glut next year due to slowing demand growth in China and record-high production levels, even as OPEC+ maintains current production levels.
The US natural gas (XNG/USD) prices rose more than 6% to nearly $3.2/MMBtu, the highest since June 11, as colder weather in late November is expected to boost heating demand.
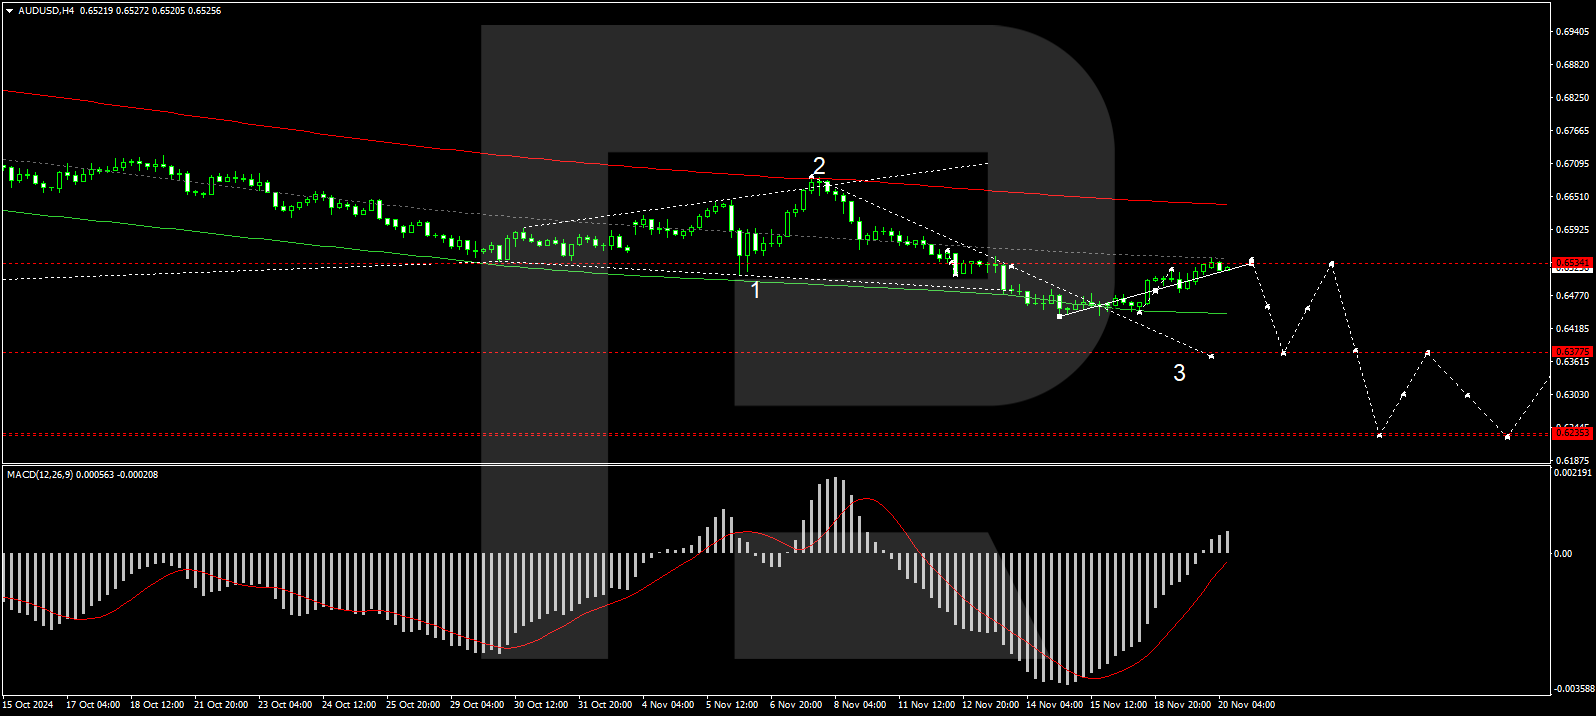
Asian markets were flat yesterday. Japan’s Nikkei 225 (JP225) fell by 0.16%, China’s FTSE China A50 (CHA50) rose by 0.13%, Hong Kong’s Hang Seng (HK50) gained 0.21%, and Australia’s ASX 200 (AU200) was negative 0.57%.
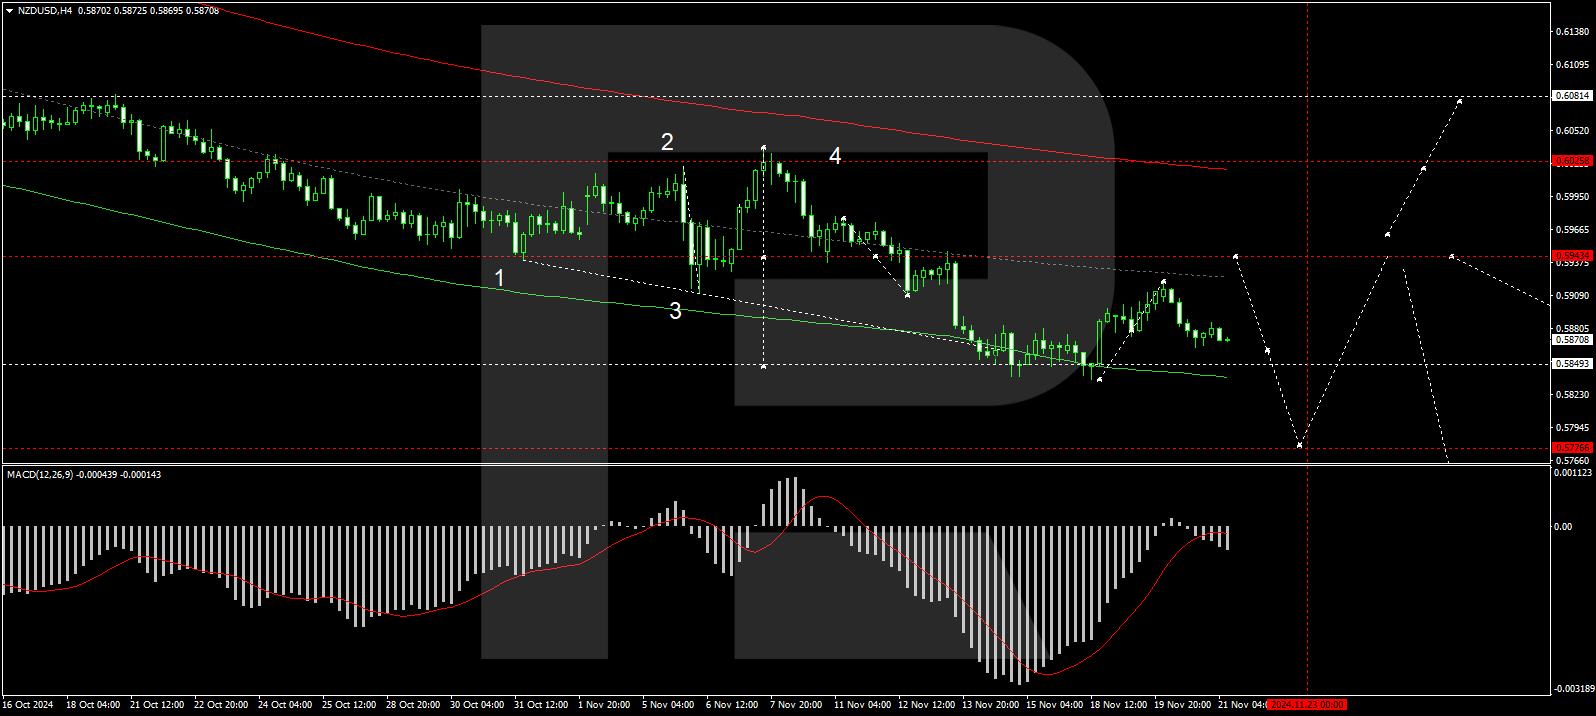
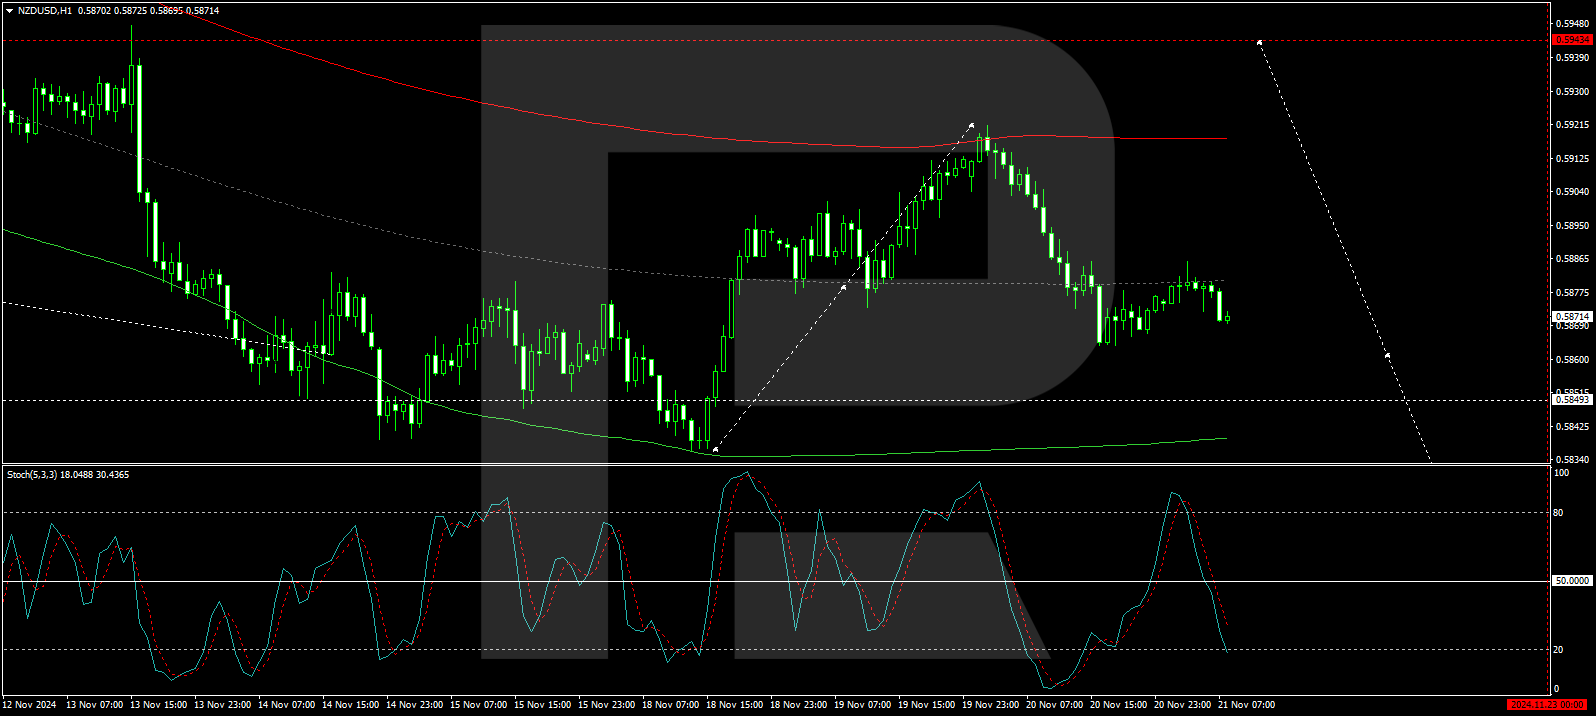
On Thursday, the New Zealand Treasury said it is likely to revise its economic and fiscal estimates downward due to a prolonged slowdown in labor productivity growth. This has prompted investors to increasingly consider the possibility that the Reserve Bank of New Zealand (RBNZ) will cut its 4.75% cash rate by 75bps more aggressively at its meeting next week, with a 50bps cut already fully priced in.
China’s Central Bank left key lending rates unchanged this week as expected, but investors remain hopeful that Beijing will introduce additional stimulus measures to support economic growth. Meanwhile, the prospect of higher tariffs on Chinese goods under the upcoming Trump administration adds to concerns about the country’s economic outlook.
S&P 500 (US500) 5,917.11 +0.13 (+0.0022%)
Dow Jones (US30) 43,408.47 +139.53 (+0.32%)
DAX (DE40) 19,004.78 −55.53 (−0.29%)
FTSE 100 (UK100) 8,085.07 −13.95 (−0.17%)
USD Index 106.67 −0.47 (−0.44%)
News feed for: 2024.11.21
- Japan BOJ Gov Ueda Speaks at 07:10 (GMT+2);
- Australia RBA Bullock Speech at 10:00 (GMT+2);
- US Initial Jobless Claims (w/w) at 15:30 (GMT+2);
- US Existing Home Sales (m/m) at 17:00 (GMT+2);
- US Natural Gas Storage (w/w) at 17:30 (GMT+2).
By JustMarkets
This article reflects a personal opinion and should not be interpreted as an investment advice, and/or offer, and/or a persistent request for carrying out financial transactions, and/or a guarantee, and/or a forecast of future events.