
By RoboForex Analytical Department
Gold prices recovered, reaching 2,644.00 USD per troy ounce on Friday, as investors navigated mixed signals from recent US economic data. The resilience in September’s employment market introduced some hesitations regarding the Federal Reserve’s pace of monetary easing, as the robust job data might warrant a less aggressive approach to rate cuts.
Recent inflation reports further complicated the market. While the overall consumer price index slowed, it was less than anticipated, and core inflation, which excludes volatile food and energy prices, actually increased. These developments have hindered progress in easing price pressures, leading to adjustments in expectations for US monetary policy.
Initially, there was speculation of a significant 50-basis-point rate cut; however, given the current economic landscape, a more conservative rate cut of 25 basis points is now deemed more likely at the Fed’s November meeting. This scenario holds an 86% probability, according to market forecasts. For gold, which does not yield coupon income, the prospect of easing by the US Federal Open Market Committee (FOMC) remains a positive catalyst, particularly in a lower interest rate environment where bonds and other interest-bearing assets become less competitive.
Despite the recent uptick, gold is on track to register its second consecutive weekly decline.
Technical analysis of gold (XAU/USD)
Free Reports:
 Sign Up for Our Stock Market Newsletter – Get updated on News, Charts & Rankings of Public Companies when you join our Stocks Newsletter
 Get our Weekly Commitment of Traders Reports - See where the biggest traders (Hedge Funds and Commercial Hedgers) are positioned in the futures markets on a weekly basis.
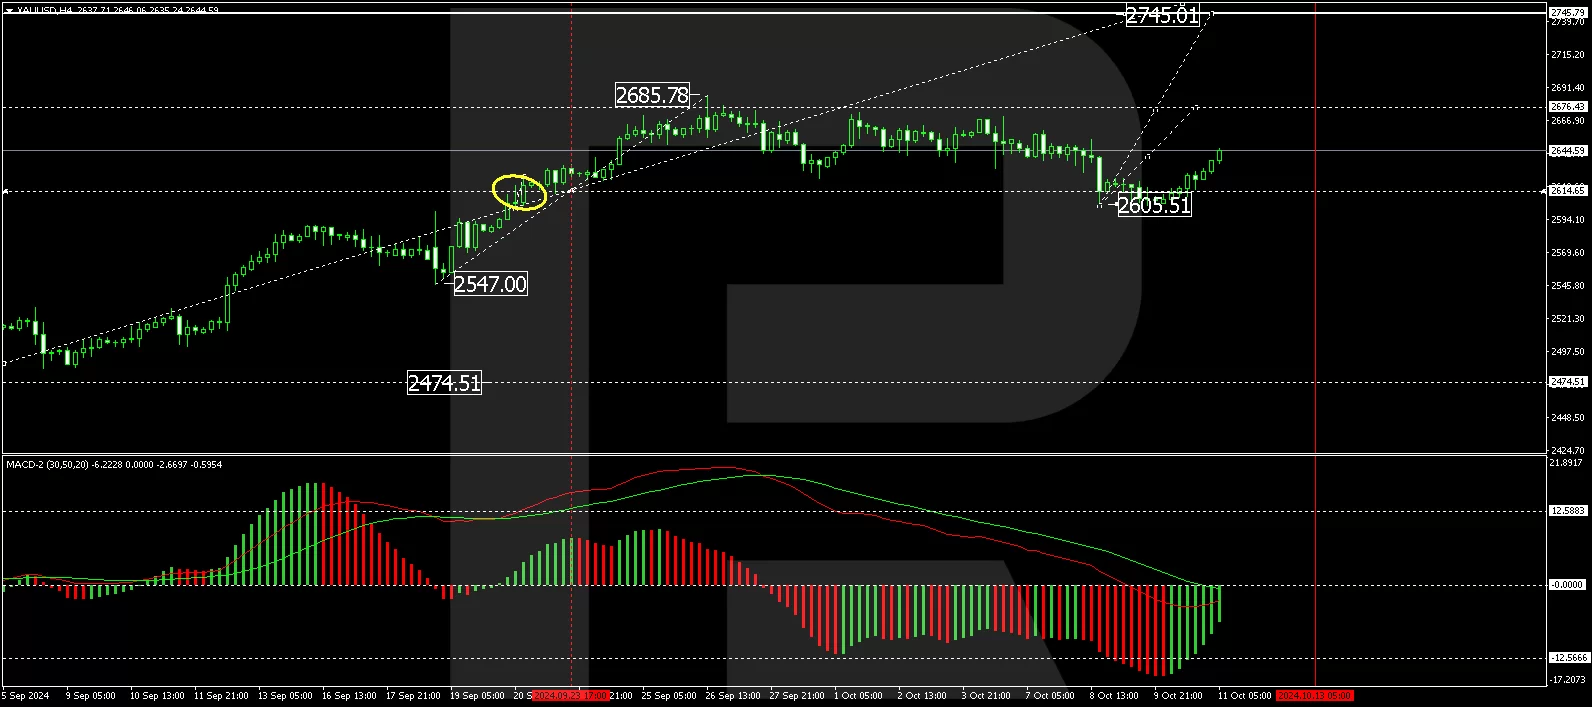
The gold market experienced a correction down to 2,605.00 but has since shown signs of resurgence. The current technical setup suggests a potential continuation towards 2,676.50, which would mark the next target in this upward trend. Following the achievement of this level, a correction back to 2,645.00 may occur. This bullish scenario is supported by the MACD indicator, which, although below zero, is gearing up for a potential rise, indicating strengthening momentum.
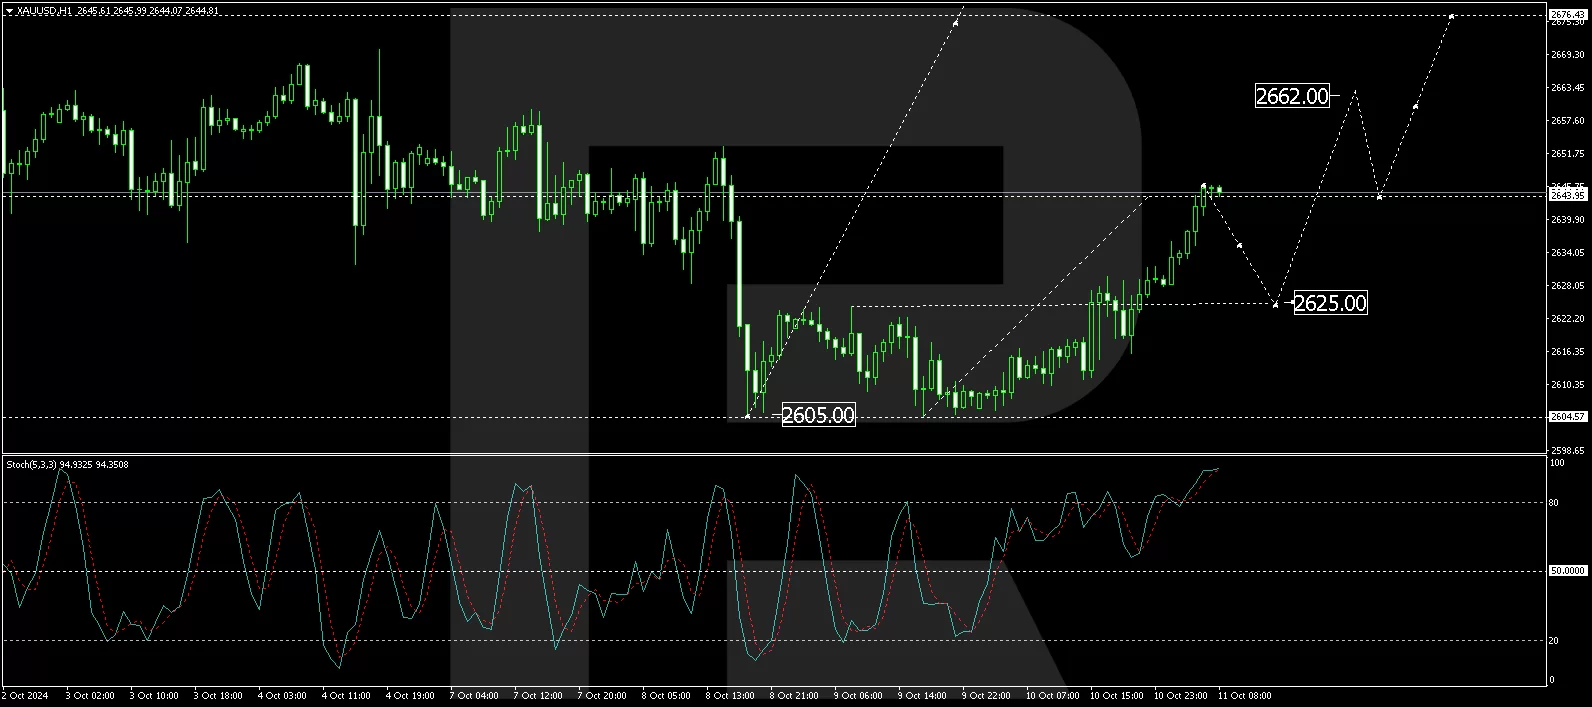
On the hourly chart, gold has formed a consolidation range above 2,605.00 and has broken upwards. It nearly reached the target of 2,644.00. Today, we might see the formation of a narrow consolidation range, and if a downward exit occurs, a corrective move to 2,625.00 could be expected. Following this correction, the market may gear up for another rise towards 2,662.00. This forecast is technically backed by the Stochastic oscillator, with its signal line currently above 80 but poised to start a decline, suggesting a short-term pullback before further gains.
Disclaimer
Any forecasts contained herein are based on the author’s particular opinion. This analysis may not be treated as trading advice. RoboForex bears no responsibility for trading results based on trading recommendations and reviews contained herein.

- The US and European stock indices are rising again amid renewed investor interest in the AI industry. Jul 10, 2026
- USD/JPY Falls as Yen Recovers Weekly Losses Jul 10, 2026
- Crude oil prices surged sharply by 7% in reaction to the rapid escalation of the conflict in the Middle East Jul 9, 2026
- Middle East Tensions Weigh on Gold Jul 9, 2026
- Pound Awaits Tighter Policy from Bank of England Jul 8, 2026
- The United States carried out airstrikes on Iran after Iran’s attacked tankers in the Strait of Hormuz. The RBNZ raised the interest rate to 2.5% Jul 8, 2026
- RoboForex Brings Full-Scale Trading to Telegram Jul 7, 2026
- Your Bourse Integrates TradingView Charts and Trading Platform Library with Trade Server Jul 7, 2026
- Yen Still Under Pressure: Markets Await Action from Authorities Jul 7, 2026
- Germany’s DAX Index has updated its all‑time high. OPEC+ countries have agreed to increase production Jul 7, 2026