By InvestMacro
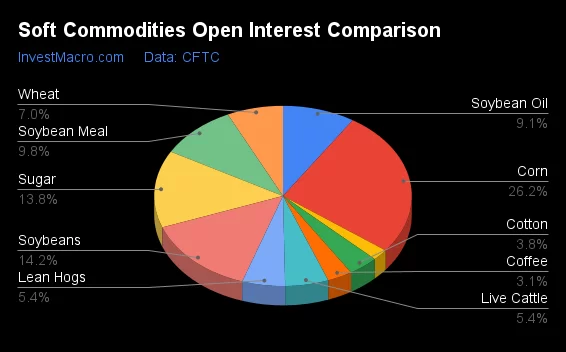
Here are the latest charts and statistics for the Commitment of Traders (COT) reports data published by the Commodities Futures Trading Commission (CFTC).
The latest COT data is updated through Tuesday November 19th and shows a quick view of how large traders (for-profit speculators and commercial entities) were positioned in the futures markets.
Weekly Speculator Changes led lower by Soybean Oil, Soybean Meal & Cotton
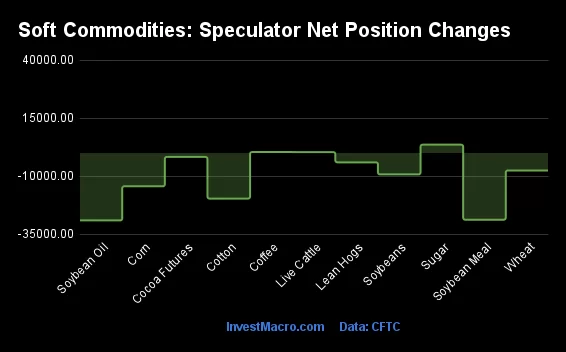
The COT soft commodities markets speculator bets were overall lower this week as just three out of the eleven softs markets we cover had higher positioning while the other eight markets had lower speculator contracts.
Leading the gains for the softs markets was Sugar (3,616 contracts) with Coffee (450 contracts) and Live Cattle (408 contracts) also seeing positive weeks.
The markets with the declines in speculator bets this week were Soybean Oil (-29,061 contracts), Soybean Meal (-28,762 contracts), Cotton (-19,649 contracts), Corn (-14,345 contracts), Soybeans (-9,218 contracts), Wheat (-7,510 contracts), Lean Hogs (-4,000 contracts) and with Cocoa (-1,668 contracts) also registering lower bets on the week.
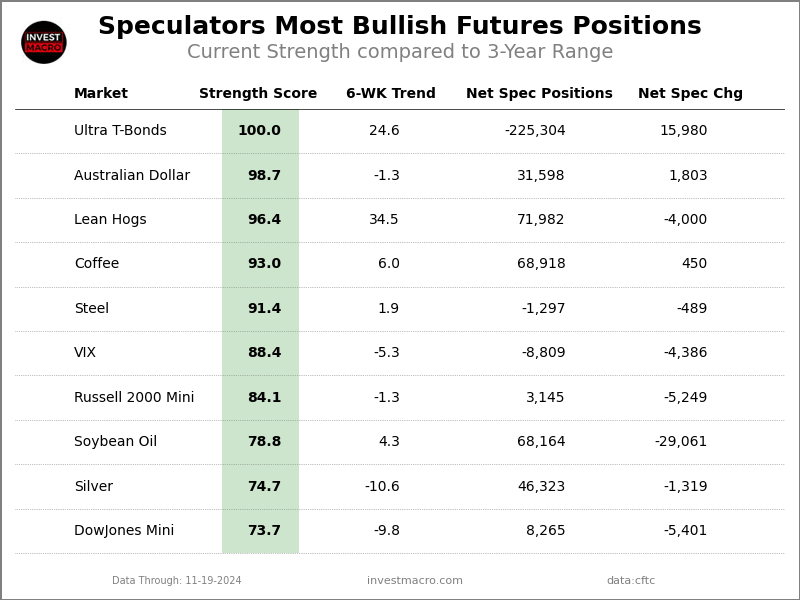
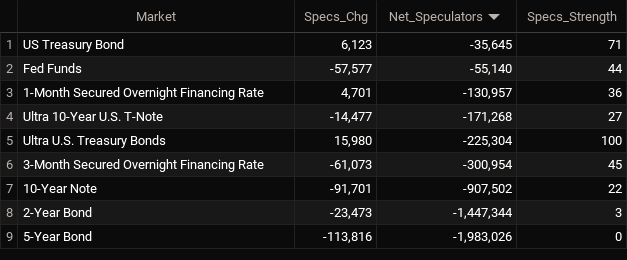
Soft Commodities Net Speculators Leaderboard
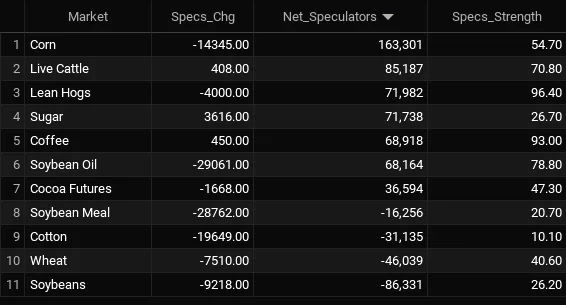
Legend: Weekly Speculators Change | Speculators Current Net Position | Speculators Strength Score compared to last 3-Years (0-100 range)
Strength Scores led by Lean Hogs & Coffee
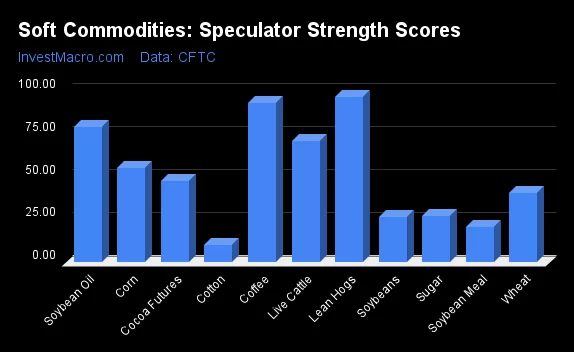
COT Strength Scores (a normalized measure of Speculator positions over a 3-Year range, from 0 to 100 where above 80 is Extreme-Bullish and below 20 is Extreme-Bearish) showed that Lean Hogs (96 percent) and Coffee (93 percent) lead the softs markets this week. Soybean Oil (79 percent), Live Cattle (71 percent) and Corn (55 percent) come in as the next highest in the weekly strength scores.
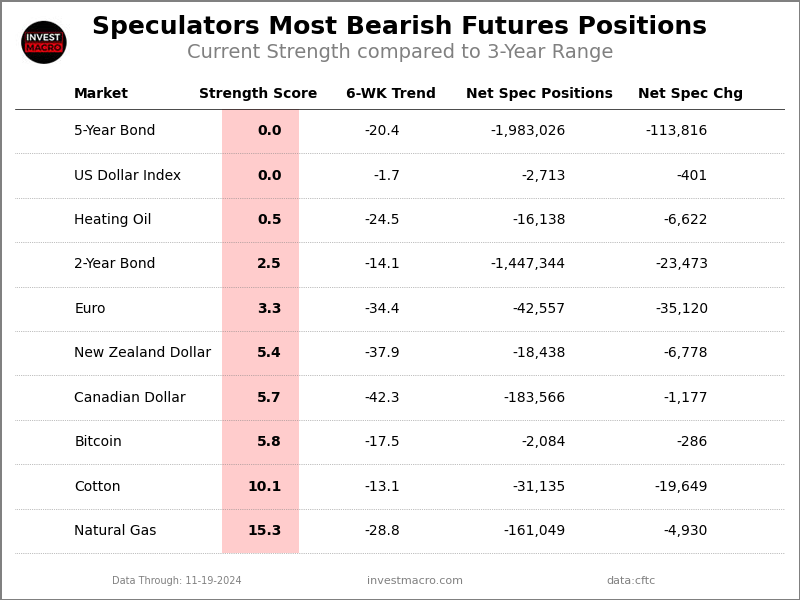
On the downside, Cotton (10 percent) comes in at the lowest strength levels currently and is in Extreme-Bearish territory (below 20 percent). The next lowest strength scores are Soybean Meal (21 percent), Soybeans (26 percent) and the Sugar (27 percent).
Strength Statistics:
Corn (54.7 percent) vs Corn previous week (56.5 percent)
Sugar (26.7 percent) vs Sugar previous week (25.4 percent)
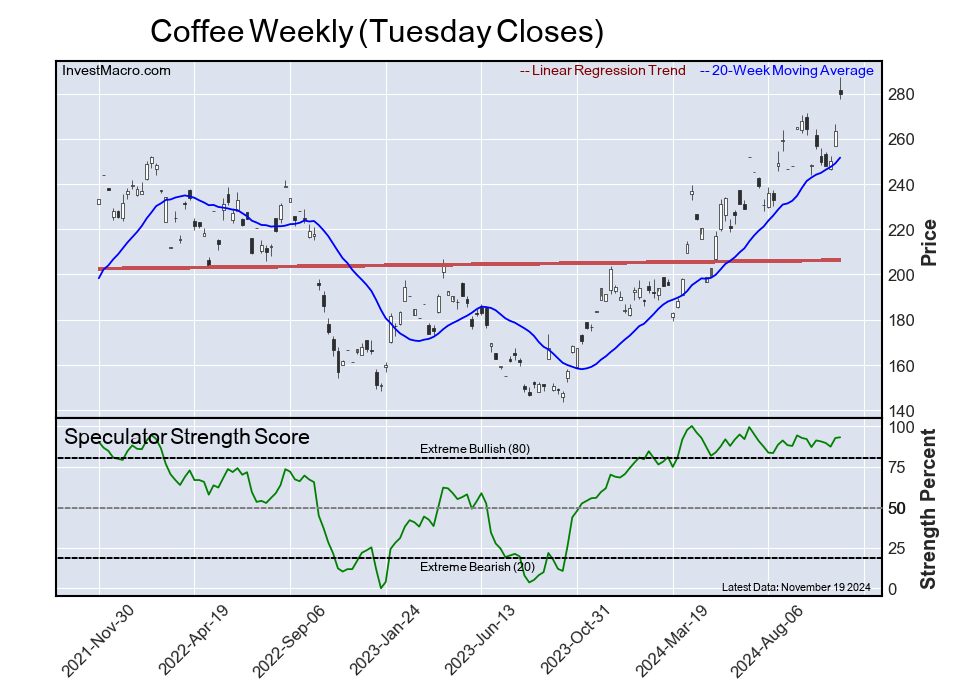
Coffee (93.0 percent) vs Coffee previous week (92.6 percent)
Soybeans (26.2 percent) vs Soybeans previous week (28.4 percent)
Soybean Oil (78.8 percent) vs Soybean Oil previous week (94.7 percent)
Soybean Meal (20.7 percent) vs Soybean Meal previous week (32.5 percent)
Live Cattle (70.8 percent) vs Live Cattle previous week (70.4 percent)
Lean Hogs (96.4 percent) vs Lean Hogs previous week (100.0 percent)
Cotton (10.1 percent) vs Cotton previous week (23.3 percent)
Cocoa (47.3 percent) vs Cocoa previous week (49.0 percent)
Wheat (40.6 percent) vs Wheat previous week (46.6 percent)
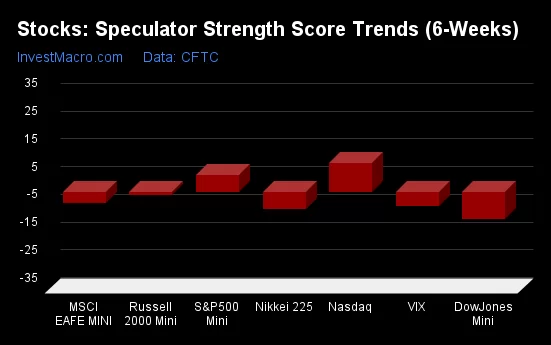
Lean Hogs & Live Cattle top the 6-Week Strength Trends
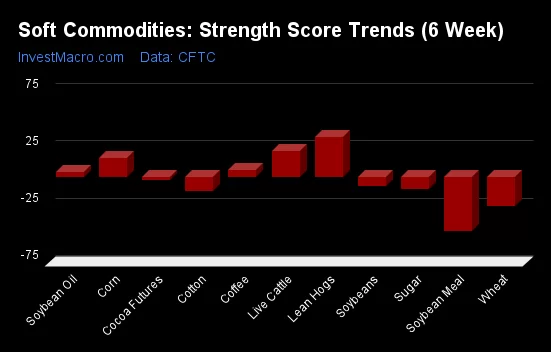
COT Strength Score Trends (or move index, calculates the 6-week changes in strength scores) showed that Lean Hogs (35 percent) and Live Cattle (22 percent) lead the past six weeks trends for soft commodities. Corn (16 percent), Coffee (6 percent) and Soybean Oil (4 percent) are the next highest positive movers in the latest trends data.
Soybean Meal (-48 percent) leads the downside trend scores currently with Wheat (-26 percent), Cotton (-13 percent) and Sugar (-11 percent) following next with lower trend scores.
Strength Trend Statistics:
Corn (16.2 percent) vs Corn previous week (23.5 percent)
Sugar (-11.1 percent) vs Sugar previous week (-21.6 percent)
Coffee (6.0 percent) vs Coffee previous week (0.6 percent)
Soybeans (-8.3 percent) vs Soybeans previous week (-0.8 percent)
Soybean Oil (4.3 percent) vs Soybean Oil previous week (25.7 percent)
Soybean Meal (-47.6 percent) vs Soybean Meal previous week (-37.5 percent)
Live Cattle (22.0 percent) vs Live Cattle previous week (34.4 percent)
Lean Hogs (34.5 percent) vs Lean Hogs previous week (50.7 percent)
Cotton (-13.1 percent) vs Cotton previous week (-0.9 percent)
Cocoa (-3.4 percent) vs Cocoa previous week (-1.1 percent)
Wheat (-25.8 percent) vs Wheat previous week (-25.7 percent)
Individual Soft Commodities Markets:
CORN Futures:
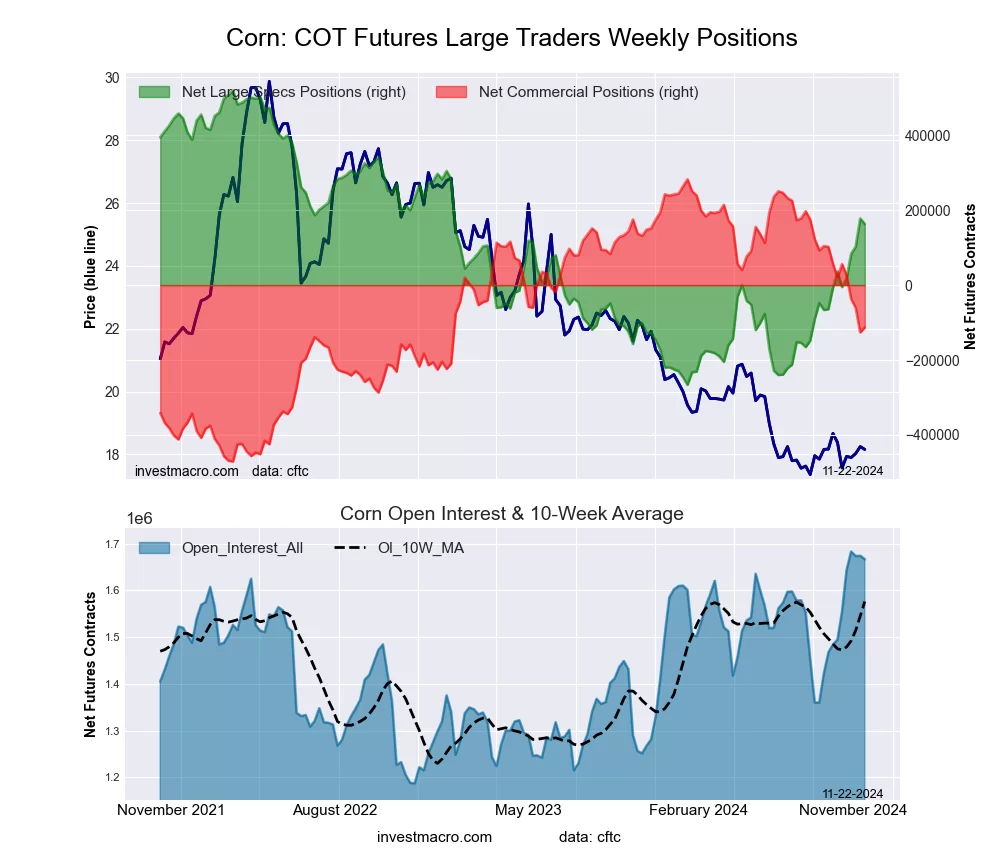 The CORN large speculator standing this week recorded a net position of 163,301 contracts in the data reported through Tuesday. This was a weekly reduction of -14,345 contracts from the previous week which had a total of 177,646 net contracts.
This week’s current strength score (the trader positioning range over the past three years, measured from 0 to 100) shows the speculators are currently Bullish with a score of 54.7 percent. The commercials are Bearish with a score of 47.5 percent and the small traders (not shown in chart) are Bearish with a score of 41.0 percent.
Price Trend-Following Model: Uptrend
Our weekly trend-following model classifies the current market price position as: Uptrend.
| CORN Futures Statistics | SPECULATORS | COMMERCIALS | SMALL TRADERS |
| – Percent of Open Interest Longs: | 25.1 | 47.3 | 7.8 |
| – Percent of Open Interest Shorts: | 15.3 | 54.1 | 10.8 |
| – Net Position: | 163,301 | -113,151 | -50,150 |
| – Gross Longs: | 418,990 | 787,938 | 129,840 |
| – Gross Shorts: | 255,689 | 901,089 | 179,990 |
| – Long to Short Ratio: | 1.6 to 1 | 0.9 to 1 | 0.7 to 1 |
| NET POSITION TREND: | | | |
| – Strength Index Score (3 Year Range Pct): | 54.7 | 47.5 | 41.0 |
| – Strength Index Reading (3 Year Range): | Bullish | Bearish | Bearish |
| NET POSITION MOVEMENT INDEX: | | | |
| – 6-Week Change in Strength Index: | 16.2 | -17.7 | 8.2 |
SUGAR Futures:
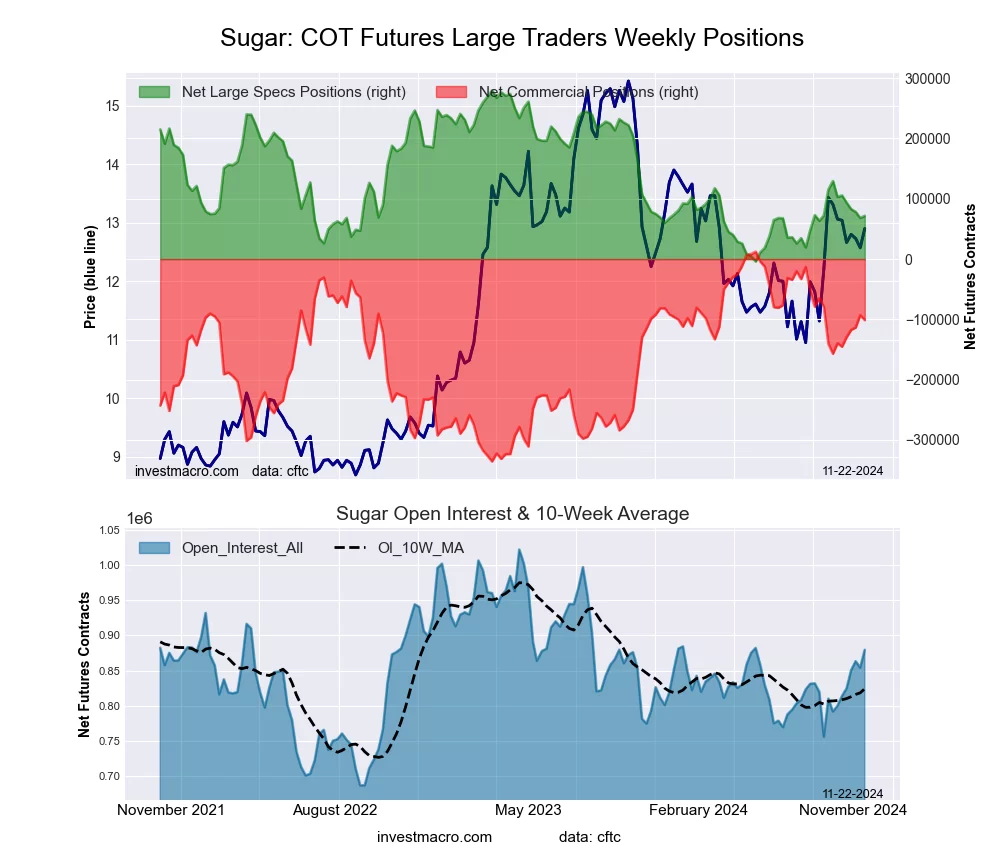 The SUGAR large speculator standing this week recorded a net position of 71,738 contracts in the data reported through Tuesday. This was a weekly lift of 3,616 contracts from the previous week which had a total of 68,122 net contracts.
This week’s current strength score (the trader positioning range over the past three years, measured from 0 to 100) shows the speculators are currently Bearish with a score of 26.7 percent. The commercials are Bullish with a score of 67.4 percent and the small traders (not shown in chart) are Bullish with a score of 57.9 percent.
Price Trend-Following Model: Uptrend
Our weekly trend-following model classifies the current market price position as: Uptrend.
| SUGAR Futures Statistics | SPECULATORS | COMMERCIALS | SMALL TRADERS |
| – Percent of Open Interest Longs: | 25.0 | 50.6 | 8.8 |
| – Percent of Open Interest Shorts: | 16.9 | 62.1 | 5.5 |
| – Net Position: | 71,738 | -101,154 | 29,416 |
| – Gross Longs: | 220,130 | 445,189 | 77,757 |
| – Gross Shorts: | 148,392 | 546,343 | 48,341 |
| – Long to Short Ratio: | 1.5 to 1 | 0.8 to 1 | 1.6 to 1 |
| NET POSITION TREND: | | | |
| – Strength Index Score (3 Year Range Pct): | 26.7 | 67.4 | 57.9 |
| – Strength Index Reading (3 Year Range): | Bearish | Bullish | Bullish |
| NET POSITION MOVEMENT INDEX: | | | |
| – 6-Week Change in Strength Index: | -11.1 | 11.1 | -9.3 |
COFFEE Futures:
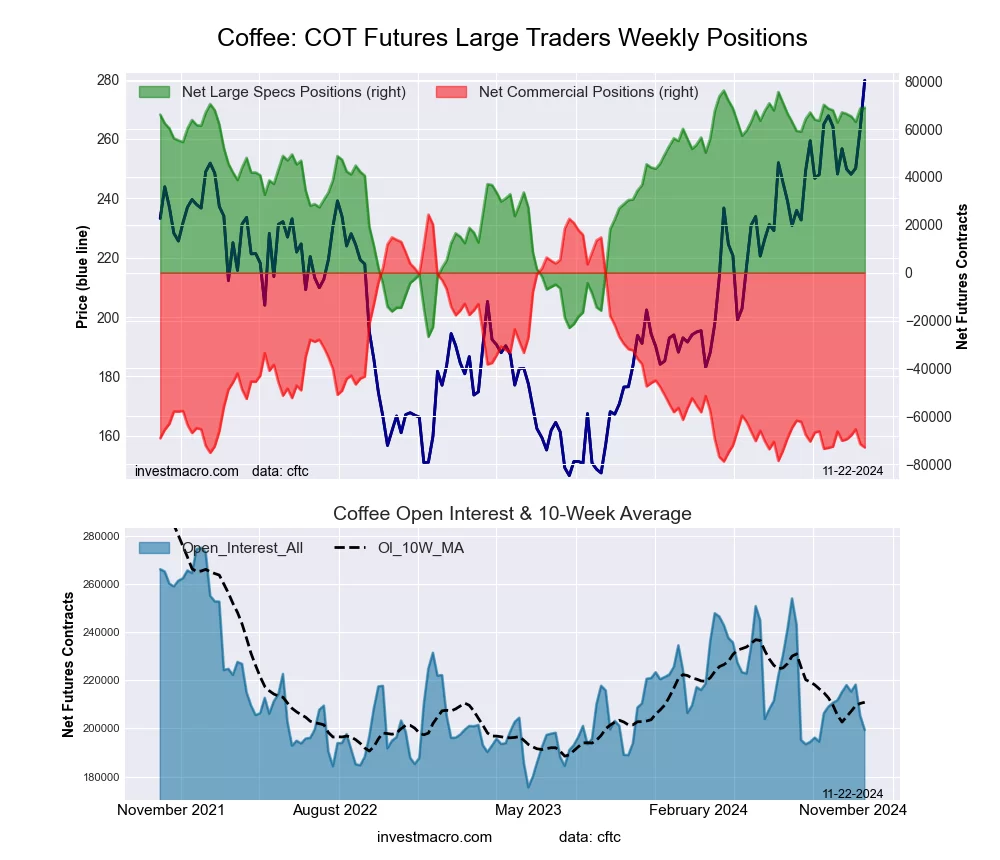 The COFFEE large speculator standing this week recorded a net position of 68,918 contracts in the data reported through Tuesday. This was a weekly rise of 450 contracts from the previous week which had a total of 68,468 net contracts.
This week’s current strength score (the trader positioning range over the past three years, measured from 0 to 100) shows the speculators are currently Bullish-Extreme with a score of 93.0 percent. The commercials are Bearish-Extreme with a score of 5.6 percent and the small traders (not shown in chart) are Bullish with a score of 79.9 percent.
Price Trend-Following Model: Strong Uptrend
Our weekly trend-following model classifies the current market price position as: Strong Uptrend.
| COFFEE Futures Statistics | SPECULATORS | COMMERCIALS | SMALL TRADERS |
| – Percent of Open Interest Longs: | 39.6 | 36.0 | 4.8 |
| – Percent of Open Interest Shorts: | 5.1 | 72.7 | 2.8 |
| – Net Position: | 68,918 | -73,015 | 4,097 |
| – Gross Longs: | 79,031 | 71,892 | 9,610 |
| – Gross Shorts: | 10,113 | 144,907 | 5,513 |
| – Long to Short Ratio: | 7.8 to 1 | 0.5 to 1 | 1.7 to 1 |
| NET POSITION TREND: | | | |
| – Strength Index Score (3 Year Range Pct): | 93.0 | 5.6 | 79.9 |
| – Strength Index Reading (3 Year Range): | Bullish-Extreme | Bearish-Extreme | Bullish |
| NET POSITION MOVEMENT INDEX: | | | |
| – 6-Week Change in Strength Index: | 6.0 | -6.6 | 8.7 |
SOYBEANS Futures:
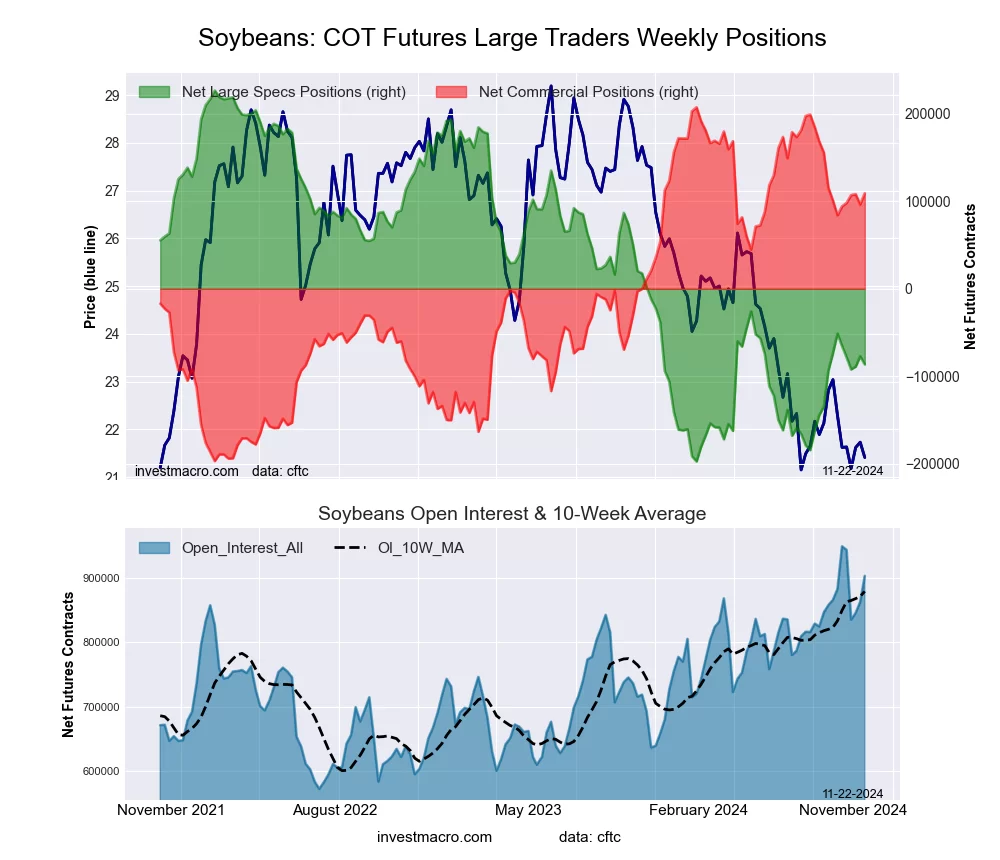 The SOYBEANS large speculator standing this week recorded a net position of -86,331 contracts in the data reported through Tuesday. This was a weekly decline of -9,218 contracts from the previous week which had a total of -77,113 net contracts.
This week’s current strength score (the trader positioning range over the past three years, measured from 0 to 100) shows the speculators are currently Bearish with a score of 26.2 percent. The commercials are Bullish with a score of 75.7 percent and the small traders (not shown in chart) are Bullish with a score of 53.1 percent.
Price Trend-Following Model: Strong Downtrend
Our weekly trend-following model classifies the current market price position as: Strong Downtrend.
| SOYBEANS Futures Statistics | SPECULATORS | COMMERCIALS | SMALL TRADERS |
| – Percent of Open Interest Longs: | 18.6 | 58.1 | 5.3 |
| – Percent of Open Interest Shorts: | 28.2 | 46.0 | 7.8 |
| – Net Position: | -86,331 | 109,077 | -22,746 |
| – Gross Longs: | 168,134 | 524,558 | 48,087 |
| – Gross Shorts: | 254,465 | 415,481 | 70,833 |
| – Long to Short Ratio: | 0.7 to 1 | 1.3 to 1 | 0.7 to 1 |
| NET POSITION TREND: | | | |
| – Strength Index Score (3 Year Range Pct): | 26.2 | 75.7 | 53.1 |
| – Strength Index Reading (3 Year Range): | Bearish | Bullish | Bullish |
| NET POSITION MOVEMENT INDEX: | | | |
| – 6-Week Change in Strength Index: | -8.3 | 6.2 | 26.0 |
SOYBEAN OIL Futures:
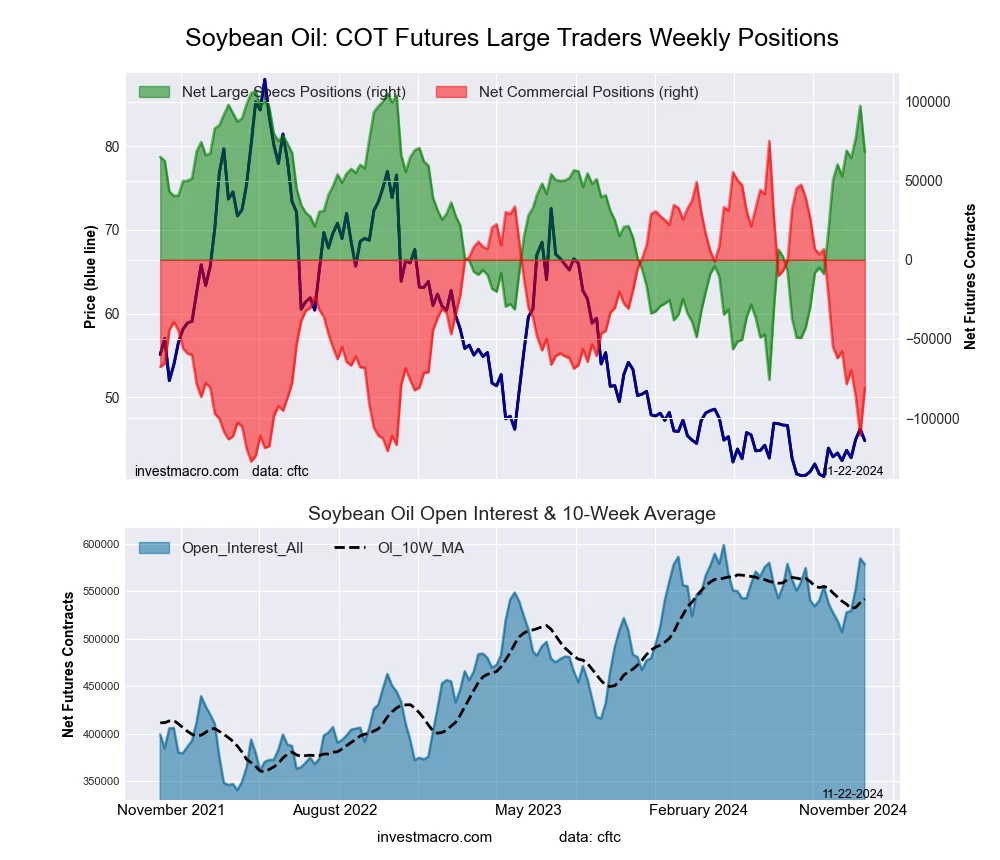 The SOYBEAN OIL large speculator standing this week recorded a net position of 68,164 contracts in the data reported through Tuesday. This was a weekly reduction of -29,061 contracts from the previous week which had a total of 97,225 net contracts.
This week’s current strength score (the trader positioning range over the past three years, measured from 0 to 100) shows the speculators are currently Bullish with a score of 78.8 percent. The commercials are Bearish with a score of 22.9 percent and the small traders (not shown in chart) are Bullish with a score of 64.1 percent.
Price Trend-Following Model: Strong Downtrend
Our weekly trend-following model classifies the current market price position as: Strong Downtrend.
| SOYBEAN OIL Futures Statistics | SPECULATORS | COMMERCIALS | SMALL TRADERS |
| – Percent of Open Interest Longs: | 27.8 | 49.3 | 6.4 |
| – Percent of Open Interest Shorts: | 16.0 | 63.4 | 4.2 |
| – Net Position: | 68,164 | -81,071 | 12,907 |
| – Gross Longs: | 161,005 | 285,534 | 37,163 |
| – Gross Shorts: | 92,841 | 366,605 | 24,256 |
| – Long to Short Ratio: | 1.7 to 1 | 0.8 to 1 | 1.5 to 1 |
| NET POSITION TREND: | | | |
| – Strength Index Score (3 Year Range Pct): | 78.8 | 22.9 | 64.1 |
| – Strength Index Reading (3 Year Range): | Bullish | Bearish | Bullish |
| NET POSITION MOVEMENT INDEX: | | | |
| – 6-Week Change in Strength Index: | 4.3 | -9.4 | 43.1 |
SOYBEAN MEAL Futures:
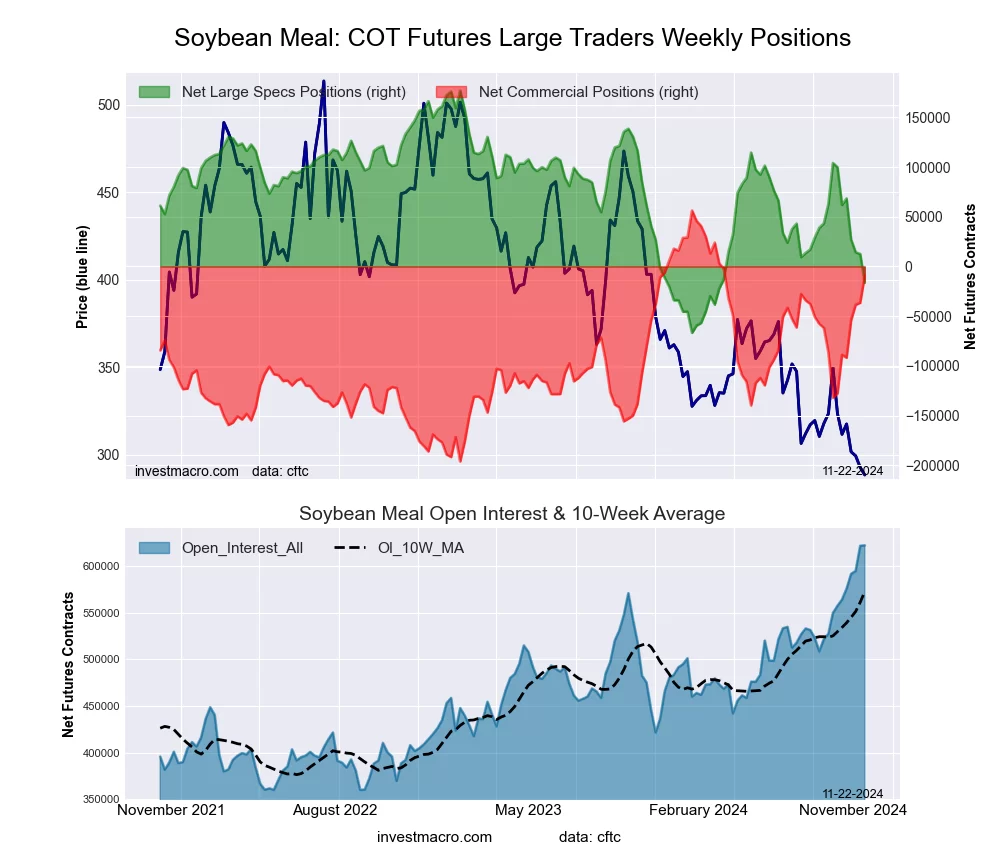 The SOYBEAN MEAL large speculator standing this week recorded a net position of -16,256 contracts in the data reported through Tuesday. This was a weekly fall of -28,762 contracts from the previous week which had a total of 12,506 net contracts.
This week’s current strength score (the trader positioning range over the past three years, measured from 0 to 100) shows the speculators are currently Bearish with a score of 20.7 percent. The commercials are Bullish with a score of 74.0 percent and the small traders (not shown in chart) are Bullish with a score of 71.1 percent.
Price Trend-Following Model: Strong Downtrend
Our weekly trend-following model classifies the current market price position as: Strong Downtrend.
| SOYBEAN MEAL Futures Statistics | SPECULATORS | COMMERCIALS | SMALL TRADERS |
| – Percent of Open Interest Longs: | 23.4 | 46.1 | 9.6 |
| – Percent of Open Interest Shorts: | 26.0 | 47.6 | 5.5 |
| – Net Position: | -16,256 | -9,392 | 25,648 |
| – Gross Longs: | 145,560 | 286,611 | 59,727 |
| – Gross Shorts: | 161,816 | 296,003 | 34,079 |
| – Long to Short Ratio: | 0.9 to 1 | 1.0 to 1 | 1.8 to 1 |
| NET POSITION TREND: | | | |
| – Strength Index Score (3 Year Range Pct): | 20.7 | 74.0 | 71.1 |
| – Strength Index Reading (3 Year Range): | Bearish | Bullish | Bullish |
| NET POSITION MOVEMENT INDEX: | | | |
| – 6-Week Change in Strength Index: | -47.6 | 46.9 | -10.4 |
LIVE CATTLE Futures:
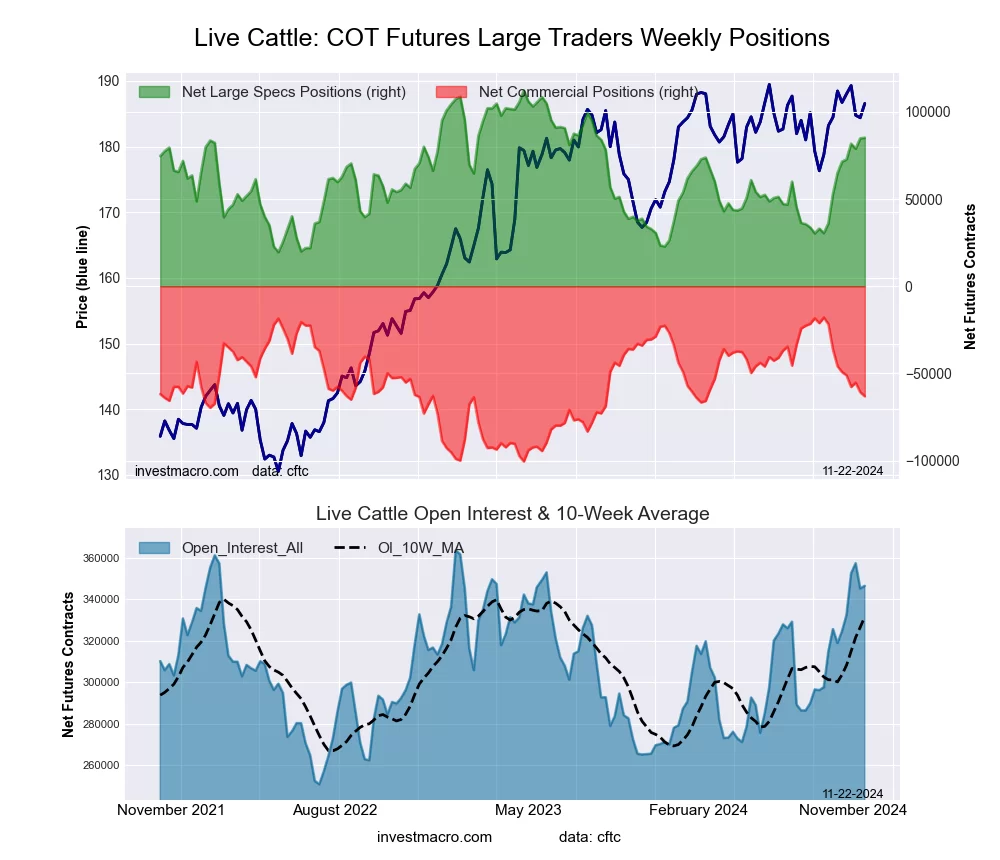 The LIVE CATTLE large speculator standing this week recorded a net position of 85,187 contracts in the data reported through Tuesday. This was a weekly gain of 408 contracts from the previous week which had a total of 84,779 net contracts.
This week’s current strength score (the trader positioning range over the past three years, measured from 0 to 100) shows the speculators are currently Bullish with a score of 70.8 percent. The commercials are Bearish with a score of 45.3 percent and the small traders (not shown in chart) are Bearish-Extreme with a score of 7.8 percent.
Price Trend-Following Model: Strong Uptrend
Our weekly trend-following model classifies the current market price position as: Strong Uptrend.
| LIVE CATTLE Futures Statistics | SPECULATORS | COMMERCIALS | SMALL TRADERS |
| – Percent of Open Interest Longs: | 44.1 | 33.1 | 7.3 |
| – Percent of Open Interest Shorts: | 19.5 | 51.3 | 13.7 |
| – Net Position: | 85,187 | -63,090 | -22,097 |
| – Gross Longs: | 152,864 | 114,603 | 25,343 |
| – Gross Shorts: | 67,677 | 177,693 | 47,440 |
| – Long to Short Ratio: | 2.3 to 1 | 0.6 to 1 | 0.5 to 1 |
| NET POSITION TREND: | | | |
| – Strength Index Score (3 Year Range Pct): | 70.8 | 45.3 | 7.8 |
| – Strength Index Reading (3 Year Range): | Bullish | Bearish | Bearish-Extreme |
| NET POSITION MOVEMENT INDEX: | | | |
| – 6-Week Change in Strength Index: | 22.0 | -21.0 | -12.0 |
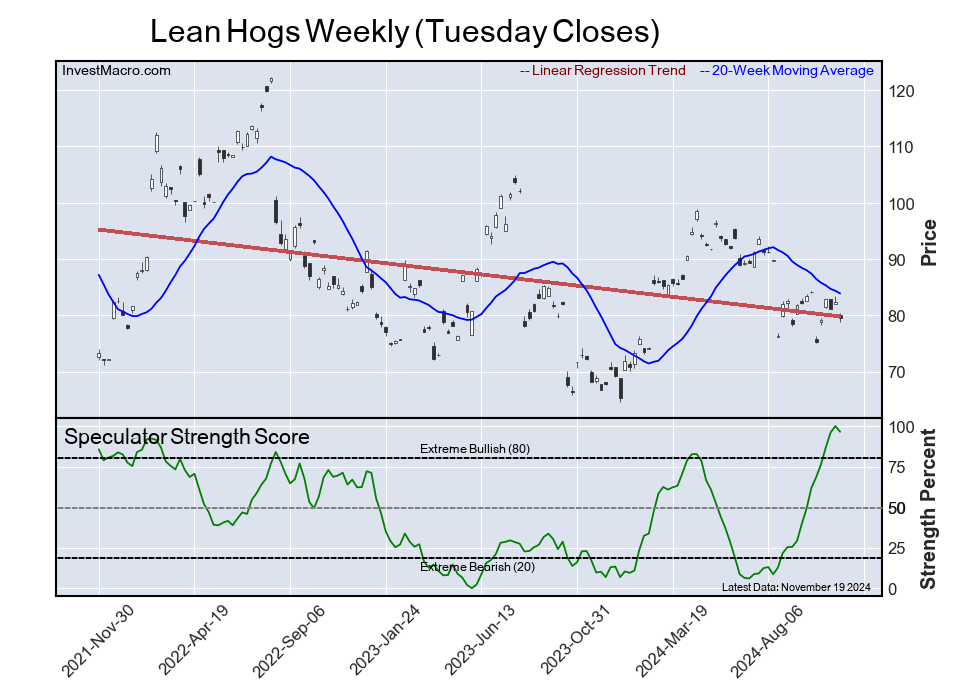
LEAN HOGS Futures:
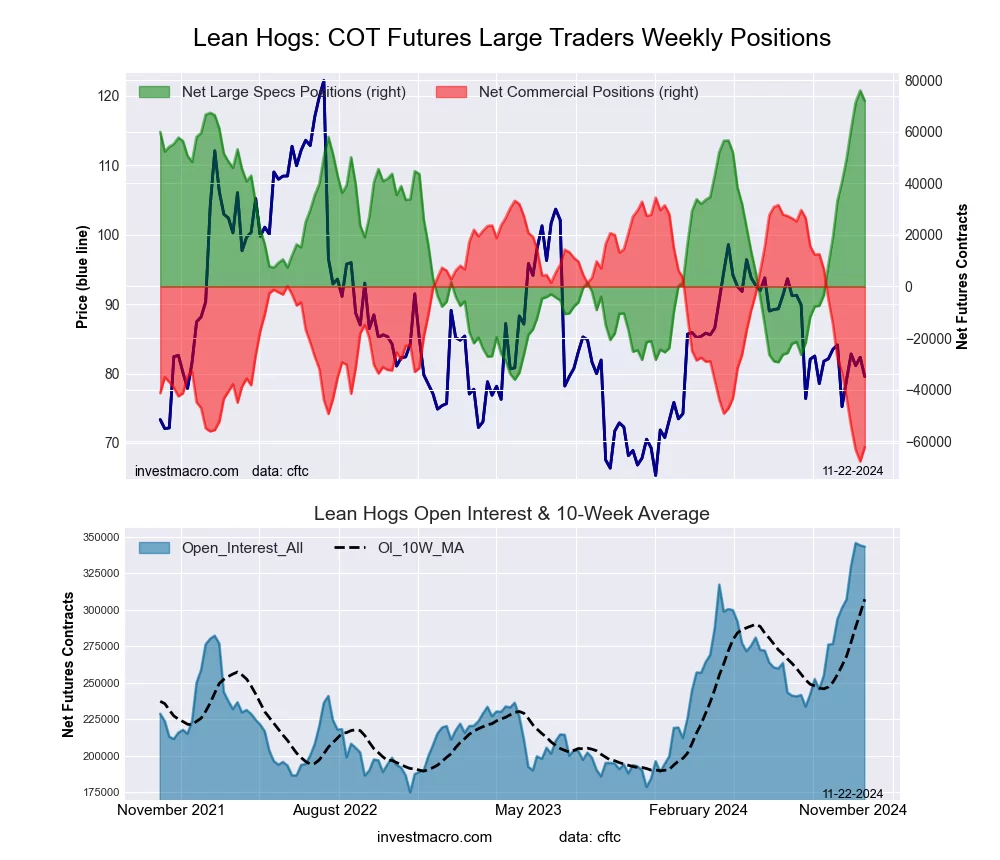 The LEAN HOGS large speculator standing this week recorded a net position of 71,982 contracts in the data reported through Tuesday. This was a weekly decline of -4,000 contracts from the previous week which had a total of 75,982 net contracts.
This week’s current strength score (the trader positioning range over the past three years, measured from 0 to 100) shows the speculators are currently Bullish-Extreme with a score of 96.4 percent. The commercials are Bearish-Extreme with a score of 5.4 percent and the small traders (not shown in chart) are Bearish with a score of 39.9 percent.
Price Trend-Following Model: Downtrend
Our weekly trend-following model classifies the current market price position as: Downtrend.
| LEAN HOGS Futures Statistics | SPECULATORS | COMMERCIALS | SMALL TRADERS |
| – Percent of Open Interest Longs: | 45.9 | 29.8 | 6.2 |
| – Percent of Open Interest Shorts: | 24.9 | 47.9 | 9.0 |
| – Net Position: | 71,982 | -62,301 | -9,681 |
| – Gross Longs: | 157,401 | 102,204 | 21,302 |
| – Gross Shorts: | 85,419 | 164,505 | 30,983 |
| – Long to Short Ratio: | 1.8 to 1 | 0.6 to 1 | 0.7 to 1 |
| NET POSITION TREND: | | | |
| – Strength Index Score (3 Year Range Pct): | 96.4 | 5.4 | 39.9 |
| – Strength Index Reading (3 Year Range): | Bullish-Extreme | Bearish-Extreme | Bearish |
| NET POSITION MOVEMENT INDEX: | | | |
| – 6-Week Change in Strength Index: | 34.5 | -33.5 | -19.8 |
COTTON Futures:
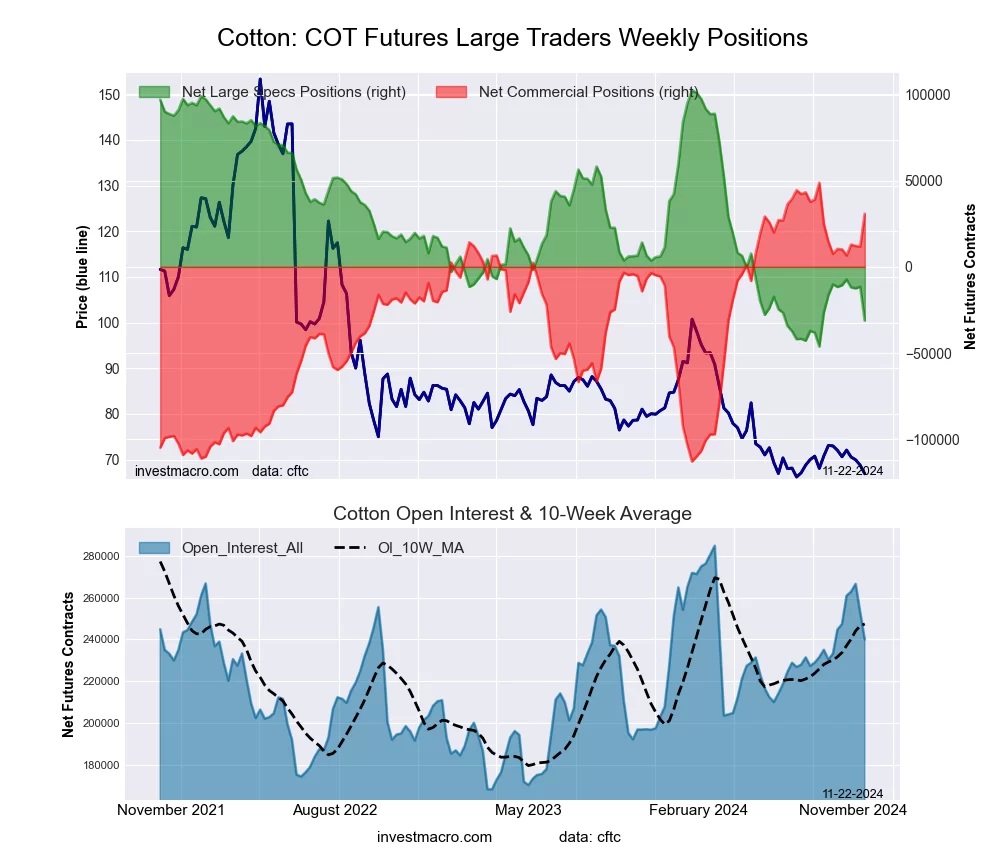 The COTTON large speculator standing this week recorded a net position of -31,135 contracts in the data reported through Tuesday. This was a weekly reduction of -19,649 contracts from the previous week which had a total of -11,486 net contracts.
This week’s current strength score (the trader positioning range over the past three years, measured from 0 to 100) shows the speculators are currently Bearish-Extreme with a score of 10.1 percent. The commercials are Bullish-Extreme with a score of 88.9 percent and the small traders (not shown in chart) are Bearish-Extreme with a score of 18.4 percent.
Price Trend-Following Model: Weak Uptrend
Our weekly trend-following model classifies the current market price position as: Weak Uptrend.
| COTTON Futures Statistics | SPECULATORS | COMMERCIALS | SMALL TRADERS |
| – Percent of Open Interest Longs: | 24.2 | 50.5 | 5.7 |
| – Percent of Open Interest Shorts: | 37.2 | 37.6 | 5.5 |
| – Net Position: | -31,135 | 30,832 | 303 |
| – Gross Longs: | 58,166 | 121,093 | 13,578 |
| – Gross Shorts: | 89,301 | 90,261 | 13,275 |
| – Long to Short Ratio: | 0.7 to 1 | 1.3 to 1 | 1.0 to 1 |
| NET POSITION TREND: | | | |
| – Strength Index Score (3 Year Range Pct): | 10.1 | 88.9 | 18.4 |
| – Strength Index Reading (3 Year Range): | Bearish-Extreme | Bullish-Extreme | Bearish-Extreme |
| NET POSITION MOVEMENT INDEX: | | | |
| – 6-Week Change in Strength Index: | -13.1 | 12.6 | -5.7 |
COCOA Futures:
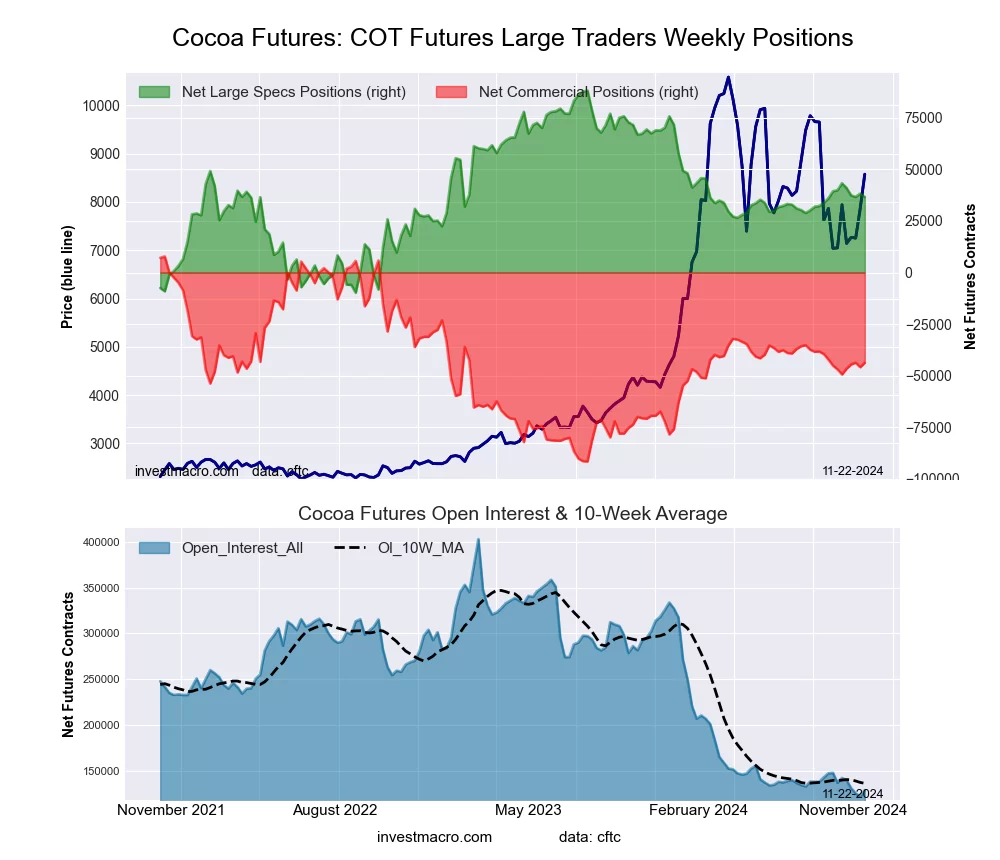 The COCOA large speculator standing this week recorded a net position of 36,594 contracts in the data reported through Tuesday. This was a weekly lowering of -1,668 contracts from the previous week which had a total of 38,262 net contracts.
This week’s current strength score (the trader positioning range over the past three years, measured from 0 to 100) shows the speculators are currently Bearish with a score of 47.3 percent. The commercials are Bearish with a score of 48.1 percent and the small traders (not shown in chart) are Bullish with a score of 73.4 percent.
Price Trend-Following Model: Weak Downtrend
Our weekly trend-following model classifies the current market price position as: Weak Downtrend.
| COCOA Futures Statistics | SPECULATORS | COMMERCIALS | SMALL TRADERS |
| – Percent of Open Interest Longs: | 43.2 | 37.4 | 9.5 |
| – Percent of Open Interest Shorts: | 14.9 | 71.2 | 4.0 |
| – Net Position: | 36,594 | -43,784 | 7,190 |
| – Gross Longs: | 55,932 | 48,440 | 12,337 |
| – Gross Shorts: | 19,338 | 92,224 | 5,147 |
| – Long to Short Ratio: | 2.9 to 1 | 0.5 to 1 | 2.4 to 1 |
| NET POSITION TREND: | | | |
| – Strength Index Score (3 Year Range Pct): | 47.3 | 48.1 | 73.4 |
| – Strength Index Reading (3 Year Range): | Bearish | Bearish | Bullish |
| NET POSITION MOVEMENT INDEX: | | | |
| – 6-Week Change in Strength Index: | -3.4 | 3.2 | 1.8 |
WHEAT Futures:
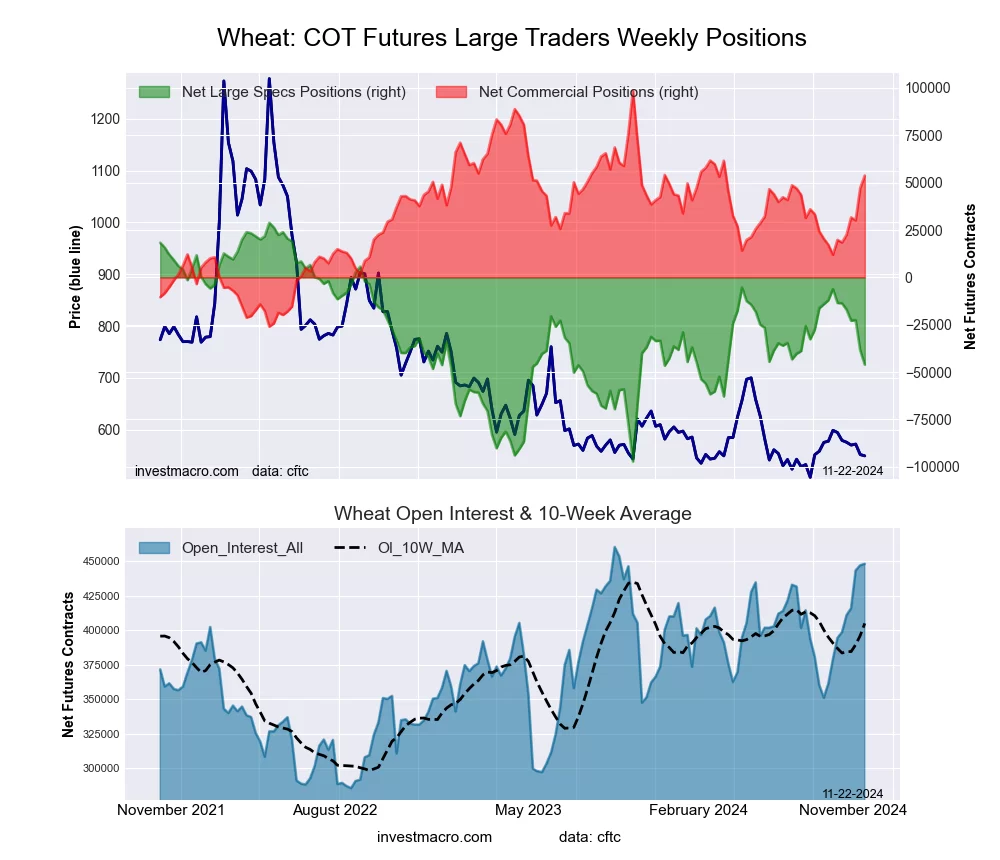 The WHEAT large speculator standing this week recorded a net position of -46,039 contracts in the data reported through Tuesday. This was a weekly reduction of -7,510 contracts from the previous week which had a total of -38,529 net contracts.
This week’s current strength score (the trader positioning range over the past three years, measured from 0 to 100) shows the speculators are currently Bearish with a score of 40.6 percent. The commercials are Bullish with a score of 64.0 percent and the small traders (not shown in chart) are Bearish-Extreme with a score of 16.0 percent.
Price Trend-Following Model: Weak Uptrend
Our weekly trend-following model classifies the current market price position as: Weak Uptrend.
| WHEAT Futures Statistics | SPECULATORS | COMMERCIALS | SMALL TRADERS |
| – Percent of Open Interest Longs: | 26.0 | 38.8 | 6.9 |
| – Percent of Open Interest Shorts: | 36.3 | 26.8 | 8.6 |
| – Net Position: | -46,039 | 53,723 | -7,684 |
| – Gross Longs: | 116,397 | 173,884 | 30,822 |
| – Gross Shorts: | 162,436 | 120,161 | 38,506 |
| – Long to Short Ratio: | 0.7 to 1 | 1.4 to 1 | 0.8 to 1 |
| NET POSITION TREND: | | | |
| – Strength Index Score (3 Year Range Pct): | 40.6 | 64.0 | 16.0 |
| – Strength Index Reading (3 Year Range): | Bearish | Bullish | Bearish-Extreme |
| NET POSITION MOVEMENT INDEX: | | | |
| – 6-Week Change in Strength Index: | -25.8 | 27.3 | -7.8 |
Article By InvestMacro – Receive our weekly COT Newsletter
*COT Report: The COT data, released weekly to the public each Friday, is updated through the most recent Tuesday (data is 3 days old) and shows a quick view of how large speculators or non-commercials (for-profit traders) were positioned in the futures markets.
The CFTC categorizes trader positions according to commercial hedgers (traders who use futures contracts for hedging as part of the business), non-commercials (large traders who speculate to realize trading profits) and nonreportable traders (usually small traders/speculators) as well as their open interest (contracts open in the market at time of reporting). See CFTC criteria here.


