By InvestMacro
Here are the latest charts and statistics for the Commitment of Traders (COT) data published by the Commodities Futures Trading Commission (CFTC).
The latest COT data is updated through Tuesday January 21st and shows a quick view of how large market participants (for-profit speculators and commercial traders) were positioned in the futures markets. All currency positions are in direct relation to the US dollar where, for example, a bet for the euro is a bet that the euro will rise versus the dollar while a bet against the euro will be a bet that the euro will decline versus the dollar.
Weekly Speculator Changes led by New Zealand Dollar & Brazilian Real
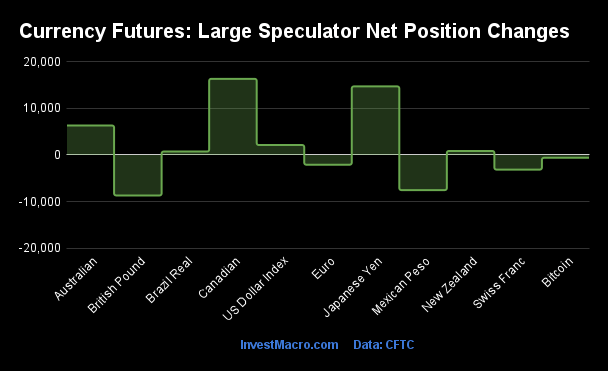
The COT currency market speculator bets were slightly higher this week as six out of the eleven currency markets we cover had higher positioning while the other five markets had lower speculator contracts.
Leading the gains for the currency markets was the Canadian Dollar (16,366 contracts), the Japanese Yen (14,738 contracts), the Australian Dollar (6,335 contracts), the US Dollar Index (2,143 contracts), the New Zealand Dollar (866 contracts) and the Brazilian Real (743 contracts) also showing positive weeks.
The currencies seeing declines in speculator bets on the week were the British Pound (-8,695 contracts), the Mexican Peso (-7,541 contracts), the Swiss Franc (-3,136 contracts), the EuroFX (-2,089 contracts) and with Bitcoin (-596 contracts) also registering lower bets on the week.
Speculators raise New Zealand Dollar bets after drop to all-time low
Highlighting the COT currency’s data this week is the recent speculator’s positioning for the New Zealand ‘Kiwi’ Dollar.
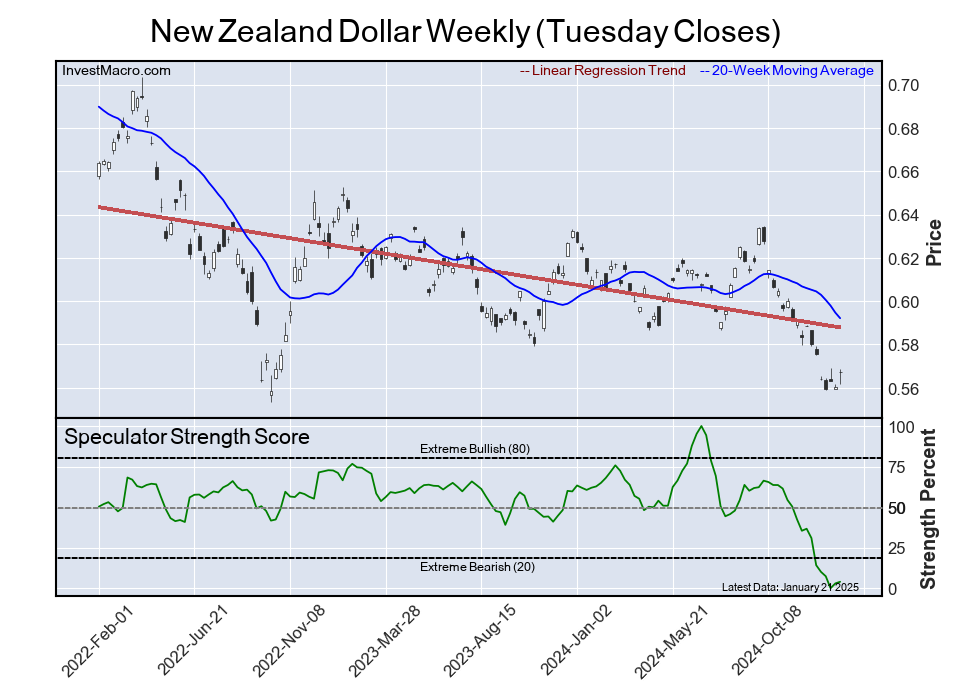
Large speculative New Zealand Dollar (NZD) currency positions rose modestly this week by +866 net contracts and have gained for two consecutive weeks. This follows significant weakness in the position over the past few months. The NZD spec position had declined for the previous five straight weeks and for thirteen out of the prior fourteen weeks for a total decline of -56,594 contracts over that period dating back to October.
This NZD weakness of the fourth quarter and into the first quarter of 2025 dropped the NZD speculator position into the lowest or most bearish level on record at -54,624 contracts on January 7th – surpassing the previous lows in 2019.
The NZD exchange rate versus the US Dollar has been on the decline in tandem with the drop in speculator bets, particularly since September. The NZDUSD started to slide in September and fell through the 0.6000 exchange level in November and continued to fall in December and into January, dropping all the way to the 0.5540 level in early January. This marked the lowest standing for the NZDUSD since October 2022.
This week, the NZD bounced higher by over 2.00 percent and managed to close above the 0.5700 exchange rate for the first time since early December.
Currencies Net Speculators Leaderboard
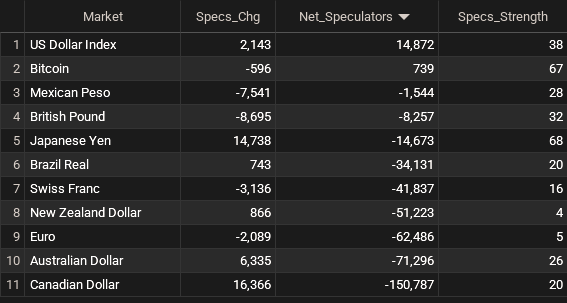
Legend: Weekly Speculators Change | Speculators Current Net Position | Speculators Strength Score compared to last 3-Years (0-100 range)
Strength Scores led by Japanese Yen & Bitcoin
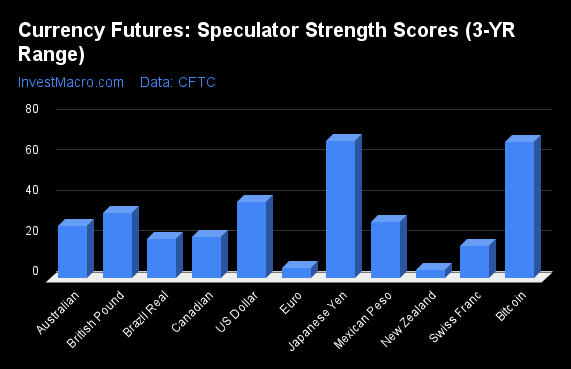
COT Strength Scores (a normalized measure of Speculator positions over a 3-Year range, from 0 to 100 where above 80 is Extreme-Bullish and below 20 is Extreme-Bearish) showed that the Japanese Yen (68 percent) and Bitcoin (67 percent) lead the currency markets this week.
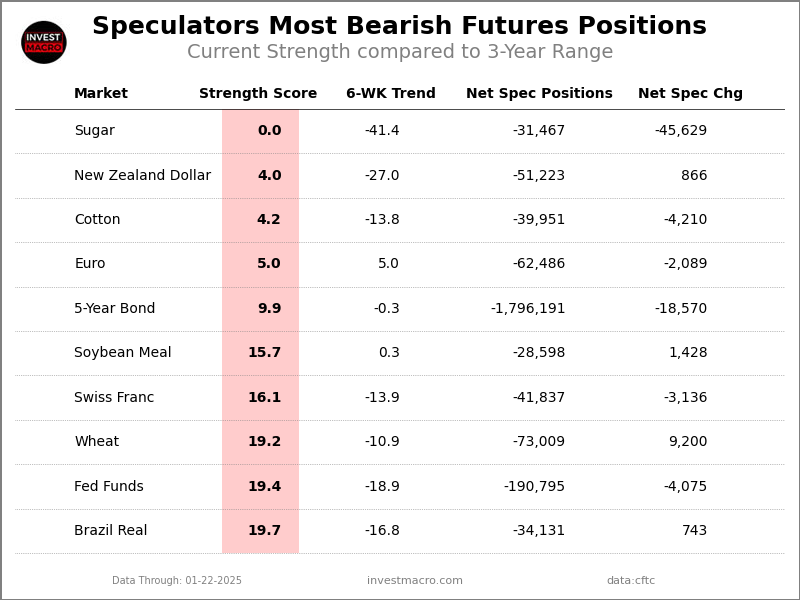
On the downside, the New Zealand Dollar (4 percent), the EuroFX (5 percent), the Swiss Franc (16 percent) and the Brazilian Real (19.7 percent) come in at the lowest strength levels currently and are in Extreme-Bearish territory (below 20 percent).
3-Year Strength Statistics:
US Dollar Index (37.5 percent) vs US Dollar Index previous week (33.1 percent)
EuroFX (5.0 percent) vs EuroFX previous week (5.8 percent)
British Pound Sterling (32.4 percent) vs British Pound Sterling previous week (36.3 percent)
Japanese Yen (67.8 percent) vs Japanese Yen previous week (61.9 percent)
Swiss Franc (16.1 percent) vs Swiss Franc previous week (22.5 percent)
Canadian Dollar (20.4 percent) vs Canadian Dollar previous week (13.0 percent)
Australian Dollar (25.7 percent) vs Australian Dollar previous week (21.2 percent)
New Zealand Dollar (4.0 percent) vs New Zealand Dollar previous week (3.0 percent)
Mexican Peso (28.0 percent) vs Mexican Peso previous week (31.8 percent)
Brazilian Real (19.7 percent) vs Brazilian Real previous week (19.0 percent)
Bitcoin (67.4 percent) vs Bitcoin previous week (80.4 percent)
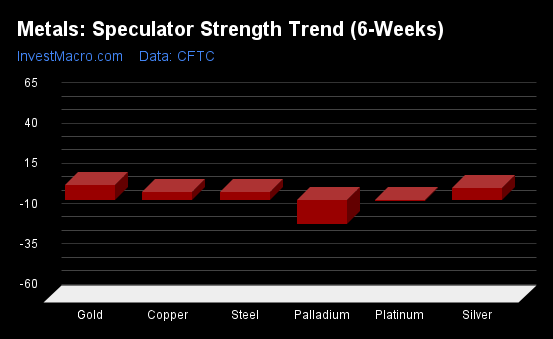
US Dollar Index & Bitcoin top the 6-Week Strength Trends
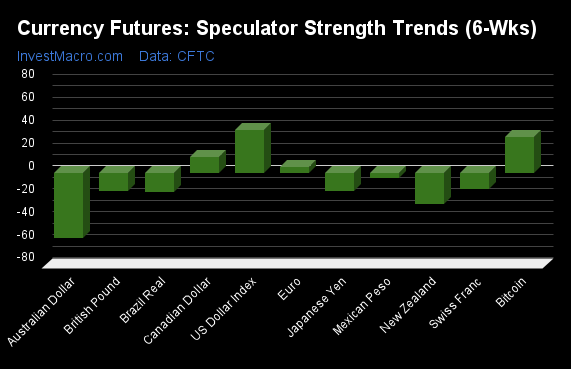
COT Strength Score Trends (or move index, calculates the 6-week changes in strength scores) showed that the US Dollar Index (38 percent) and Bitcoin (32 percent) lead the past six weeks trends for the currencies. The Canadian Dollar (14 percent) is the next highest positive movers in the 3-Year trends data.
The Australian Dollar (-57 percent) leads the downside trend scores currently with the New Zealand Dollar (-27 percent), Brazilian Real (-17 percent) and the Japanese Yen (-16 percent) following next with lower trend scores.
3-Year Strength Trends:
US Dollar Index (37.5 percent) vs US Dollar Index previous week (32.7 percent)
EuroFX (5.0 percent) vs EuroFX previous week (-1.1 percent)
British Pound Sterling (-15.9 percent) vs British Pound Sterling previous week (-8.5 percent)
Japanese Yen (-16.2 percent) vs Japanese Yen previous week (-12.7 percent)
Swiss Franc (-13.9 percent) vs Swiss Franc previous week (4.8 percent)
Canadian Dollar (13.8 percent) vs Canadian Dollar previous week (-3.5 percent)
Australian Dollar (-56.6 percent) vs Australian Dollar previous week (-70.3 percent)
New Zealand Dollar (-27.0 percent) vs New Zealand Dollar previous week (-33.7 percent)
Mexican Peso (-4.8 percent) vs Mexican Peso previous week (0.9 percent)
Brazilian Real (-16.8 percent) vs Brazilian Real previous week (-16.6 percent)
Bitcoin (31.8 percent) vs Bitcoin previous week (63.9 percent)
Individual COT Forex Markets:
US Dollar Index Futures:
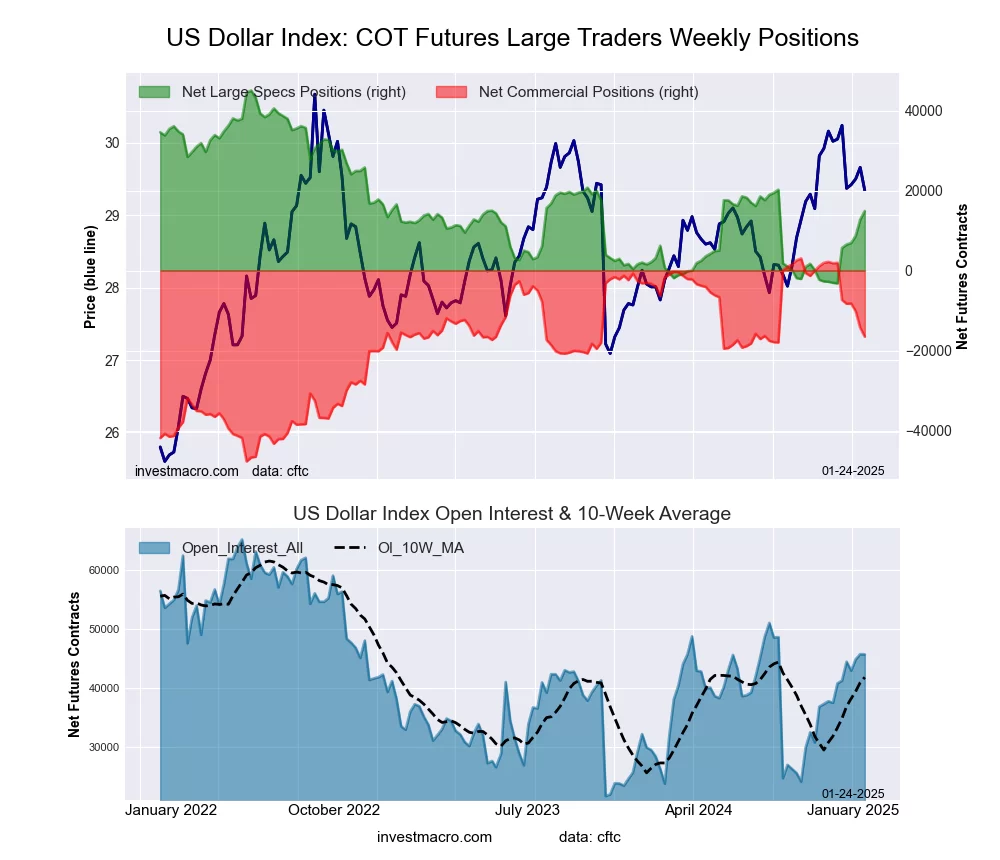 The US Dollar Index large speculator standing this week reached a net position of 14,872 contracts in the data reported through Tuesday. This was a weekly increase of 2,143 contracts from the previous week which had a total of 12,729 net contracts.
This week’s current strength score (the trader positioning range over the past three years, measured from 0 to 100) shows the speculators are currently Bearish with a score of 37.5 percent. The commercials are Bullish with a score of 61.5 percent and the small traders (not shown in chart) are Bearish with a score of 40.6 percent.
Price Trend-Following Model: Weak Uptrend
Our weekly trend-following model classifies the current market price position as: Weak Uptrend.
| US DOLLAR INDEX Statistics | SPECULATORS | COMMERCIALS | SMALL TRADERS |
| – Percent of Open Interest Longs: | 63.0 | 24.6 | 9.0 |
| – Percent of Open Interest Shorts: | 30.5 | 60.7 | 5.4 |
| – Net Position: | 14,872 | -16,520 | 1,648 |
| – Gross Longs: | 28,811 | 11,247 | 4,133 |
| – Gross Shorts: | 13,939 | 27,767 | 2,485 |
| – Long to Short Ratio: | 2.1 to 1 | 0.4 to 1 | 1.7 to 1 |
| NET POSITION TREND: | | | |
| – Strength Index Score (3 Year Range Pct): | 37.5 | 61.5 | 40.6 |
| – Strength Index Reading (3 Year Range): | Bearish | Bullish | Bearish |
| NET POSITION MOVEMENT INDEX: | | | |
| – 6-Week Change in Strength Index: | 37.5 | -36.4 | 3.8 |
Euro Currency Futures:
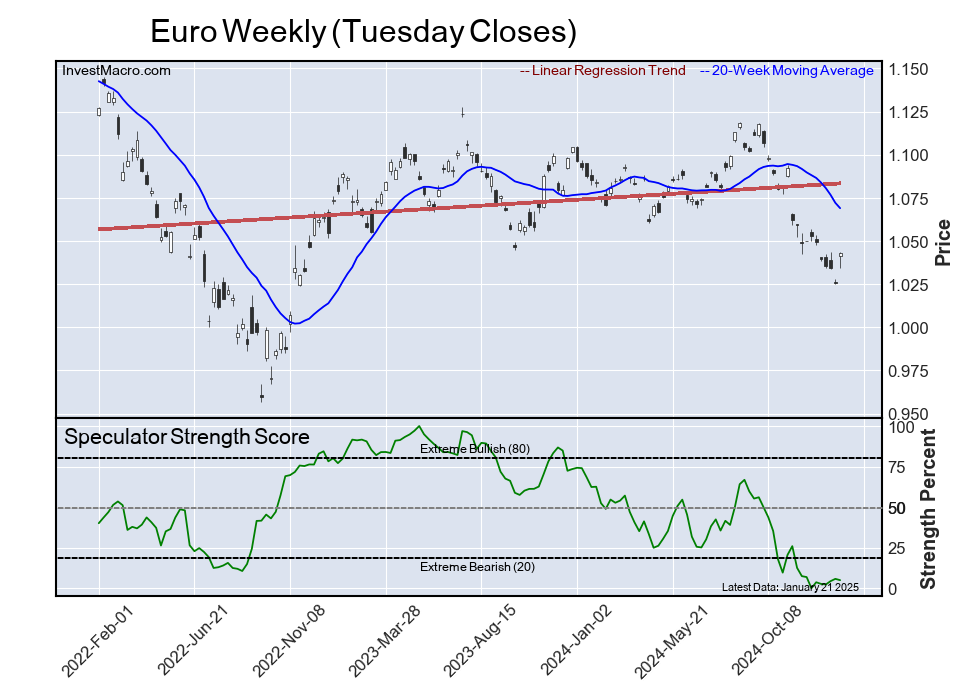
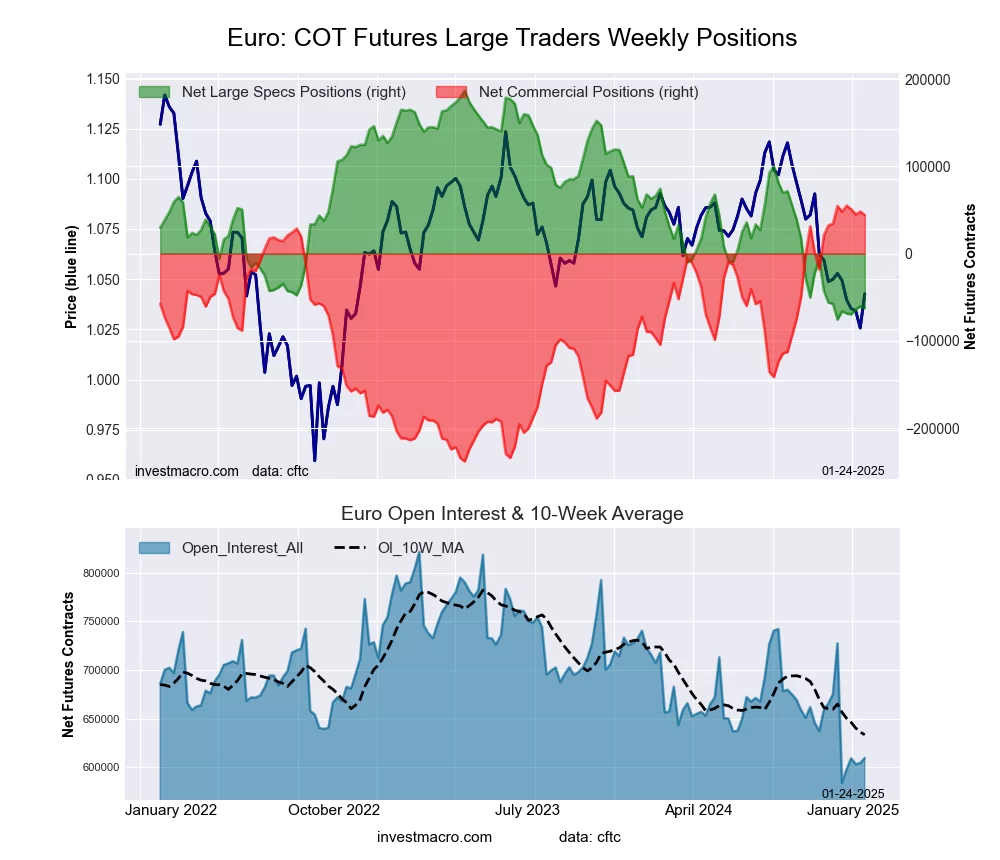 The Euro Currency large speculator standing this week reached a net position of -62,486 contracts in the data reported through Tuesday. This was a weekly reduction of -2,089 contracts from the previous week which had a total of -60,397 net contracts.
This week’s current strength score (the trader positioning range over the past three years, measured from 0 to 100) shows the speculators are currently Bearish-Extreme with a score of 5.0 percent. The commercials are Bullish-Extreme with a score of 96.3 percent and the small traders (not shown in chart) are Bearish-Extreme with a score of 13.6 percent.
Price Trend-Following Model: Downtrend
Our weekly trend-following model classifies the current market price position as: Downtrend.
| EURO Currency Statistics | SPECULATORS | COMMERCIALS | SMALL TRADERS |
| – Percent of Open Interest Longs: | 27.5 | 55.6 | 12.4 |
| – Percent of Open Interest Shorts: | 37.8 | 48.3 | 9.4 |
| – Net Position: | -62,486 | 44,295 | 18,191 |
| – Gross Longs: | 167,665 | 338,719 | 75,560 |
| – Gross Shorts: | 230,151 | 294,424 | 57,369 |
| – Long to Short Ratio: | 0.7 to 1 | 1.2 to 1 | 1.3 to 1 |
| NET POSITION TREND: | | | |
| – Strength Index Score (3 Year Range Pct): | 5.0 | 96.3 | 13.6 |
| – Strength Index Reading (3 Year Range): | Bearish-Extreme | Bullish-Extreme | Bearish-Extreme |
| NET POSITION MOVEMENT INDEX: | | | |
| – 6-Week Change in Strength Index: | 5.0 | -3.6 | -5.9 |
British Pound Sterling Futures:
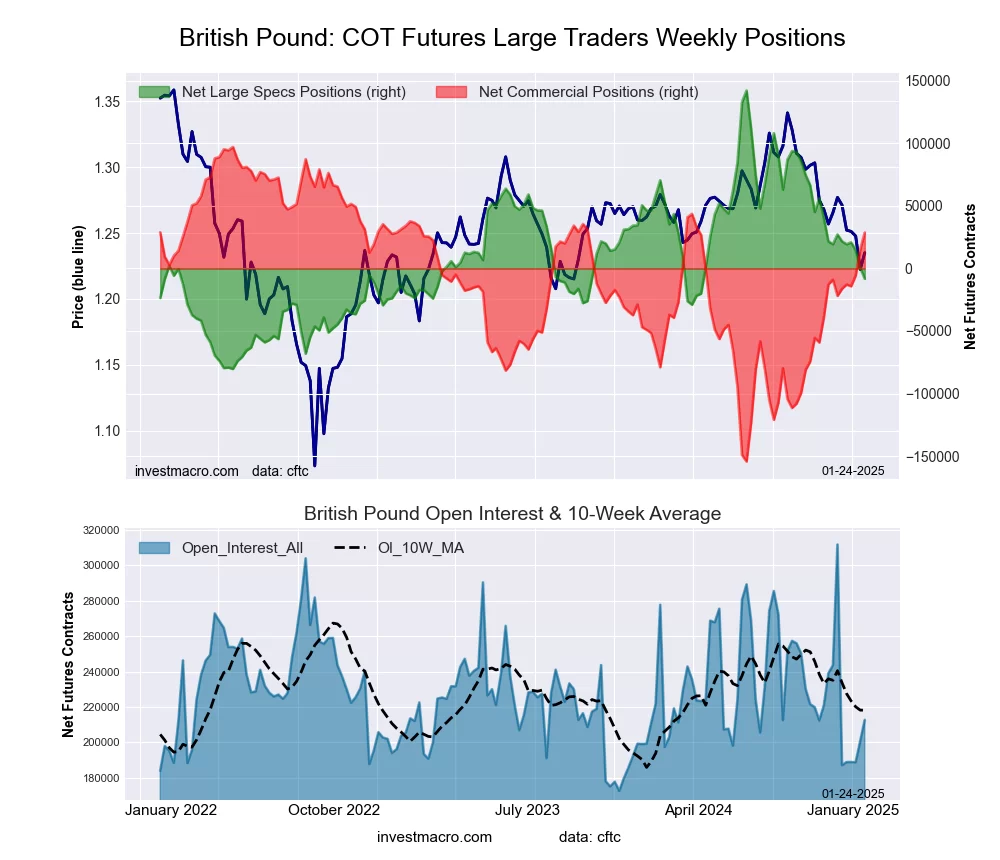 The British Pound Sterling large speculator standing this week reached a net position of -8,257 contracts in the data reported through Tuesday. This was a weekly fall of -8,695 contracts from the previous week which had a total of 438 net contracts.
This week’s current strength score (the trader positioning range over the past three years, measured from 0 to 100) shows the speculators are currently Bearish with a score of 32.4 percent. The commercials are Bullish with a score of 72.8 percent and the small traders (not shown in chart) are Bearish-Extreme with a score of 19.1 percent.
Price Trend-Following Model: Downtrend
Our weekly trend-following model classifies the current market price position as: Downtrend.
| BRITISH POUND Statistics | SPECULATORS | COMMERCIALS | SMALL TRADERS |
| – Percent of Open Interest Longs: | 35.6 | 52.6 | 10.3 |
| – Percent of Open Interest Shorts: | 39.5 | 39.1 | 19.9 |
| – Net Position: | -8,257 | 28,749 | -20,492 |
| – Gross Longs: | 75,696 | 111,968 | 21,903 |
| – Gross Shorts: | 83,953 | 83,219 | 42,395 |
| – Long to Short Ratio: | 0.9 to 1 | 1.3 to 1 | 0.5 to 1 |
| NET POSITION TREND: | | | |
| – Strength Index Score (3 Year Range Pct): | 32.4 | 72.8 | 19.1 |
| – Strength Index Reading (3 Year Range): | Bearish | Bullish | Bearish-Extreme |
| NET POSITION MOVEMENT INDEX: | | | |
| – 6-Week Change in Strength Index: | -15.9 | 20.2 | -32.1 |
Japanese Yen Futures:
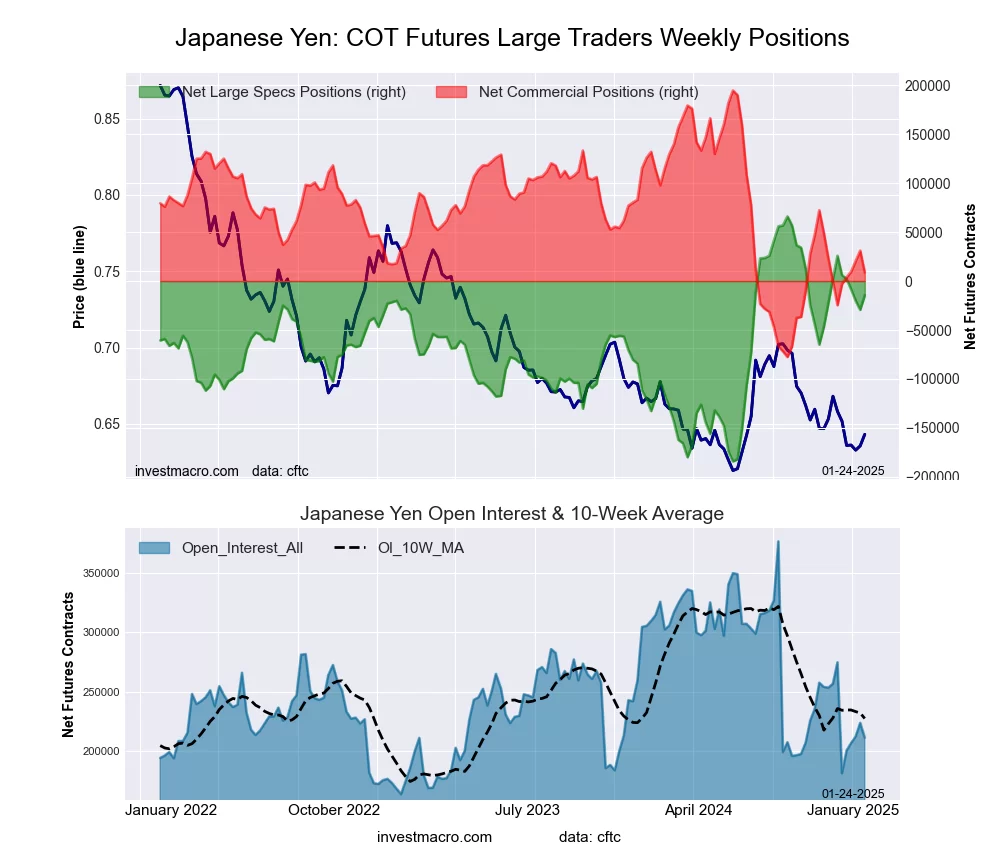 The Japanese Yen large speculator standing this week reached a net position of -14,673 contracts in the data reported through Tuesday. This was a weekly lift of 14,738 contracts from the previous week which had a total of -29,411 net contracts.
This week’s current strength score (the trader positioning range over the past three years, measured from 0 to 100) shows the speculators are currently Bullish with a score of 67.8 percent. The commercials are Bearish with a score of 31.7 percent and the small traders (not shown in chart) are Bullish with a score of 77.8 percent.
Price Trend-Following Model: Downtrend
Our weekly trend-following model classifies the current market price position as: Downtrend.
| JAPANESE YEN Statistics | SPECULATORS | COMMERCIALS | SMALL TRADERS |
| – Percent of Open Interest Longs: | 44.5 | 32.5 | 20.6 |
| – Percent of Open Interest Shorts: | 51.4 | 28.4 | 17.9 |
| – Net Position: | -14,673 | 8,829 | 5,844 |
| – Gross Longs: | 94,157 | 68,868 | 43,642 |
| – Gross Shorts: | 108,830 | 60,039 | 37,798 |
| – Long to Short Ratio: | 0.9 to 1 | 1.1 to 1 | 1.2 to 1 |
| NET POSITION TREND: | | | |
| – Strength Index Score (3 Year Range Pct): | 67.8 | 31.7 | 77.8 |
| – Strength Index Reading (3 Year Range): | Bullish | Bearish | Bullish |
| NET POSITION MOVEMENT INDEX: | | | |
| – 6-Week Change in Strength Index: | -16.2 | 12.3 | 16.9 |
Swiss Franc Futures:
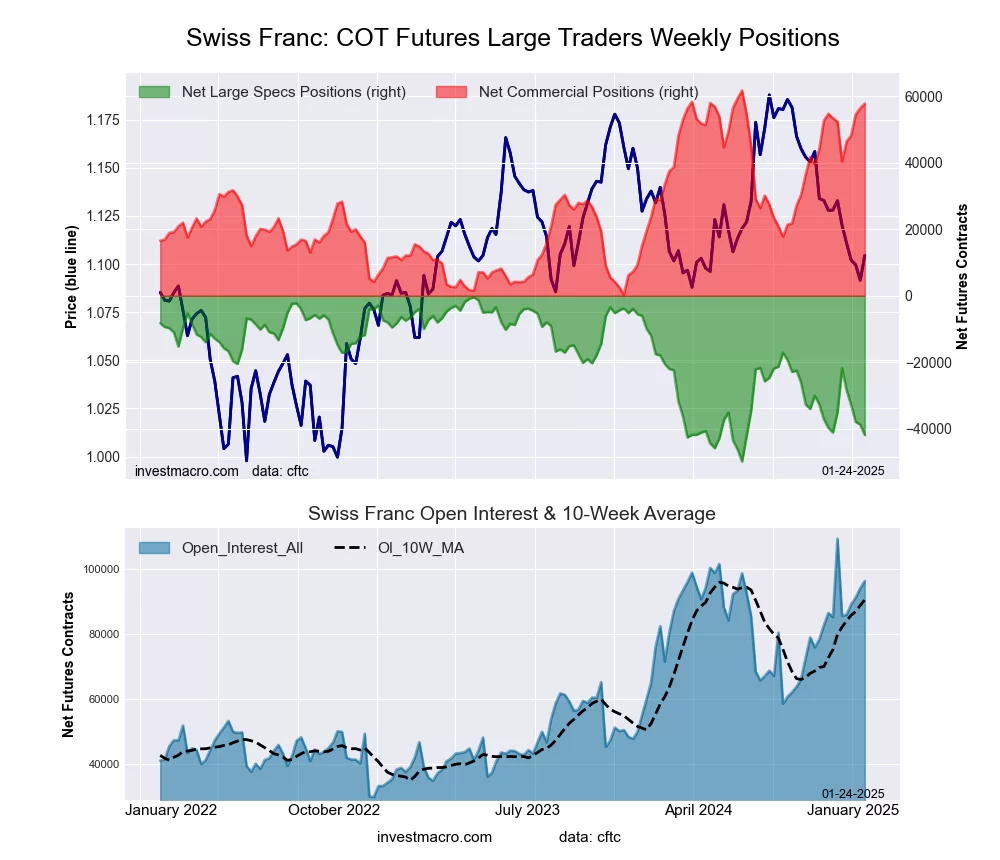 The Swiss Franc large speculator standing this week reached a net position of -41,837 contracts in the data reported through Tuesday. This was a weekly decline of -3,136 contracts from the previous week which had a total of -38,701 net contracts.
This week’s current strength score (the trader positioning range over the past three years, measured from 0 to 100) shows the speculators are currently Bearish-Extreme with a score of 16.1 percent. The commercials are Bullish-Extreme with a score of 93.6 percent and the small traders (not shown in chart) are Bearish-Extreme with a score of 11.3 percent.
Price Trend-Following Model: Downtrend
Our weekly trend-following model classifies the current market price position as: Downtrend.
| SWISS FRANC Statistics | SPECULATORS | COMMERCIALS | SMALL TRADERS |
| – Percent of Open Interest Longs: | 6.8 | 84.2 | 8.6 |
| – Percent of Open Interest Shorts: | 50.2 | 24.3 | 25.1 |
| – Net Position: | -41,837 | 57,758 | -15,921 |
| – Gross Longs: | 6,526 | 81,160 | 8,255 |
| – Gross Shorts: | 48,363 | 23,402 | 24,176 |
| – Long to Short Ratio: | 0.1 to 1 | 3.5 to 1 | 0.3 to 1 |
| NET POSITION TREND: | | | |
| – Strength Index Score (3 Year Range Pct): | 16.1 | 93.6 | 11.3 |
| – Strength Index Reading (3 Year Range): | Bearish-Extreme | Bullish-Extreme | Bearish-Extreme |
| NET POSITION MOVEMENT INDEX: | | | |
| – 6-Week Change in Strength Index: | -13.9 | 8.9 | 5.9 |
Canadian Dollar Futures:
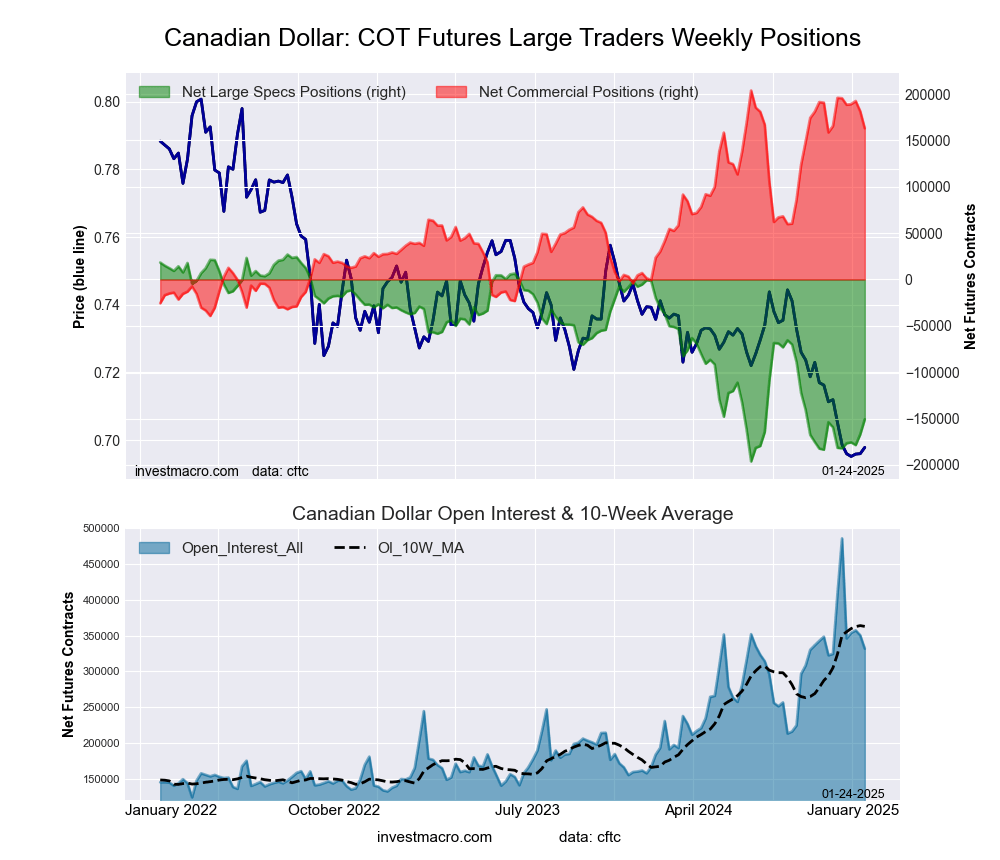 The Canadian Dollar large speculator standing this week reached a net position of -150,787 contracts in the data reported through Tuesday. This was a weekly gain of 16,366 contracts from the previous week which had a total of -167,153 net contracts.
This week’s current strength score (the trader positioning range over the past three years, measured from 0 to 100) shows the speculators are currently Bearish with a score of 20.4 percent. The commercials are Bullish-Extreme with a score of 83.3 percent and the small traders (not shown in chart) are Bearish-Extreme with a score of 5.5 percent.
Price Trend-Following Model: Downtrend
Our weekly trend-following model classifies the current market price position as: Downtrend.
| CANADIAN DOLLAR Statistics | SPECULATORS | COMMERCIALS | SMALL TRADERS |
| – Percent of Open Interest Longs: | 5.9 | 84.0 | 8.2 |
| – Percent of Open Interest Shorts: | 51.3 | 34.8 | 11.9 |
| – Net Position: | -150,787 | 163,078 | -12,291 |
| – Gross Longs: | 19,503 | 278,535 | 27,246 |
| – Gross Shorts: | 170,290 | 115,457 | 39,537 |
| – Long to Short Ratio: | 0.1 to 1 | 2.4 to 1 | 0.7 to 1 |
| NET POSITION TREND: | | | |
| – Strength Index Score (3 Year Range Pct): | 20.4 | 83.3 | 5.5 |
| – Strength Index Reading (3 Year Range): | Bearish | Bullish-Extreme | Bearish-Extreme |
| NET POSITION MOVEMENT INDEX: | | | |
| – 6-Week Change in Strength Index: | 13.8 | -13.5 | 5.5 |
Australian Dollar Futures:
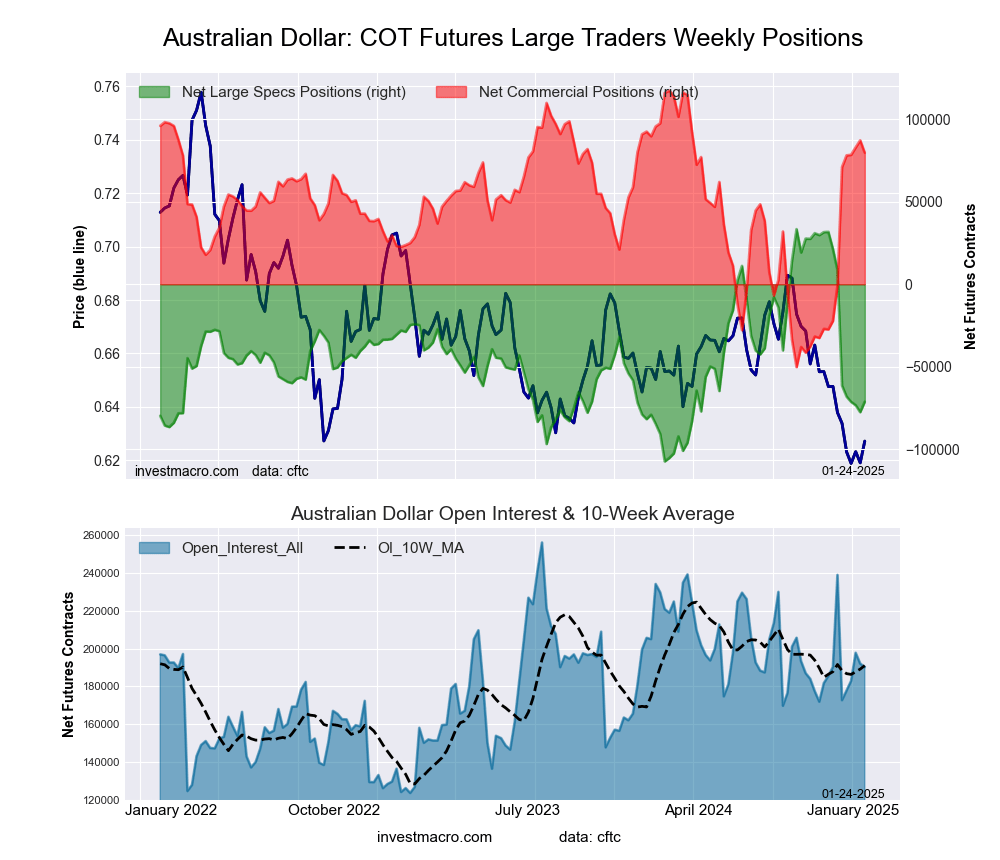 The Australian Dollar large speculator standing this week reached a net position of -71,296 contracts in the data reported through Tuesday. This was a weekly gain of 6,335 contracts from the previous week which had a total of -77,631 net contracts.
This week’s current strength score (the trader positioning range over the past three years, measured from 0 to 100) shows the speculators are currently Bearish with a score of 25.7 percent. The commercials are Bullish with a score of 77.5 percent and the small traders (not shown in chart) are Bearish with a score of 26.7 percent.
Price Trend-Following Model: Downtrend
Our weekly trend-following model classifies the current market price position as: Downtrend.
| AUSTRALIAN DOLLAR Statistics | SPECULATORS | COMMERCIALS | SMALL TRADERS |
| – Percent of Open Interest Longs: | 16.4 | 67.0 | 12.7 |
| – Percent of Open Interest Shorts: | 53.9 | 25.0 | 17.2 |
| – Net Position: | -71,296 | 79,799 | -8,503 |
| – Gross Longs: | 31,179 | 127,375 | 24,195 |
| – Gross Shorts: | 102,475 | 47,576 | 32,698 |
| – Long to Short Ratio: | 0.3 to 1 | 2.7 to 1 | 0.7 to 1 |
| NET POSITION TREND: | | | |
| – Strength Index Score (3 Year Range Pct): | 25.7 | 77.5 | 26.7 |
| – Strength Index Reading (3 Year Range): | Bearish | Bullish | Bearish |
| NET POSITION MOVEMENT INDEX: | | | |
| – 6-Week Change in Strength Index: | -56.6 | 48.0 | -2.0 |
New Zealand Dollar Futures:
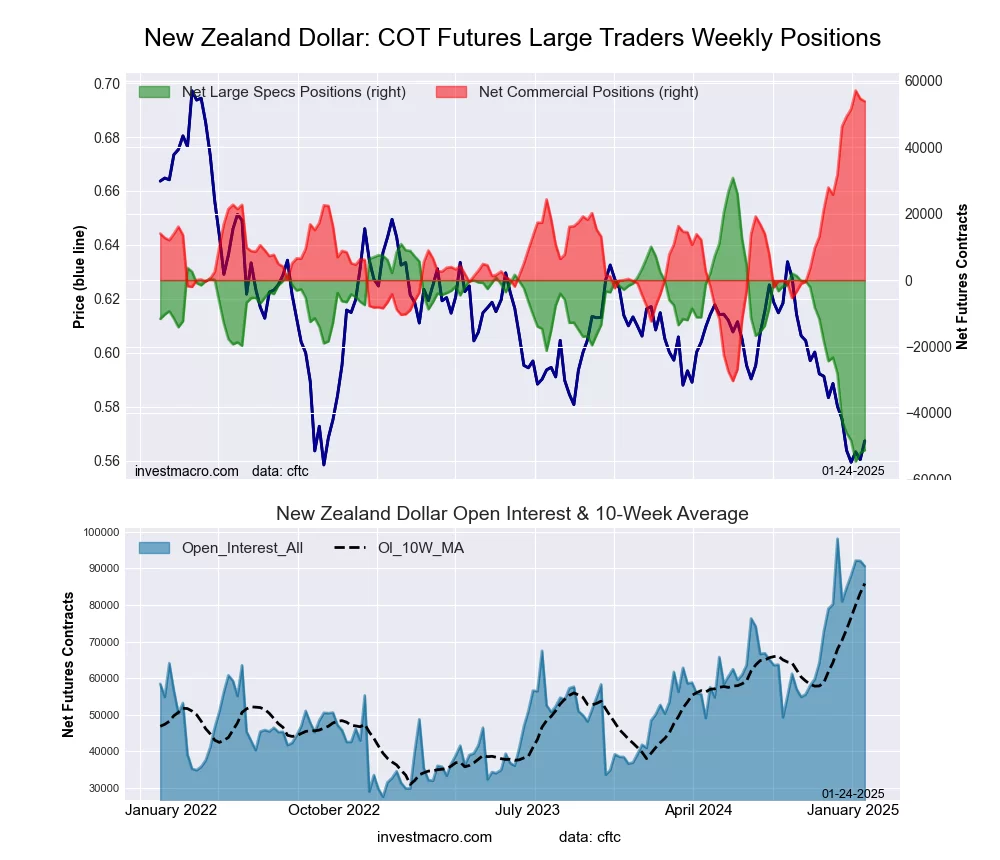 The New Zealand Dollar large speculator standing this week reached a net position of -51,223 contracts in the data reported through Tuesday. This was a weekly lift of 866 contracts from the previous week which had a total of -52,089 net contracts.
This week’s current strength score (the trader positioning range over the past three years, measured from 0 to 100) shows the speculators are currently Bearish-Extreme with a score of 4.0 percent. The commercials are Bullish-Extreme with a score of 96.3 percent and the small traders (not shown in chart) are Bearish with a score of 20.1 percent.
Price Trend-Following Model: Downtrend
Our weekly trend-following model classifies the current market price position as: Downtrend.
| NEW ZEALAND DOLLAR Statistics | SPECULATORS | COMMERCIALS | SMALL TRADERS |
| – Percent of Open Interest Longs: | 9.9 | 85.8 | 3.9 |
| – Percent of Open Interest Shorts: | 66.4 | 26.4 | 6.8 |
| – Net Position: | -51,223 | 53,841 | -2,618 |
| – Gross Longs: | 8,938 | 77,776 | 3,551 |
| – Gross Shorts: | 60,161 | 23,935 | 6,169 |
| – Long to Short Ratio: | 0.1 to 1 | 3.2 to 1 | 0.6 to 1 |
| NET POSITION TREND: | | | |
| – Strength Index Score (3 Year Range Pct): | 4.0 | 96.3 | 20.1 |
| – Strength Index Reading (3 Year Range): | Bearish-Extreme | Bullish-Extreme | Bearish |
| NET POSITION MOVEMENT INDEX: | | | |
| – 6-Week Change in Strength Index: | -27.0 | 25.1 | 13.0 |
Mexican Peso Futures:
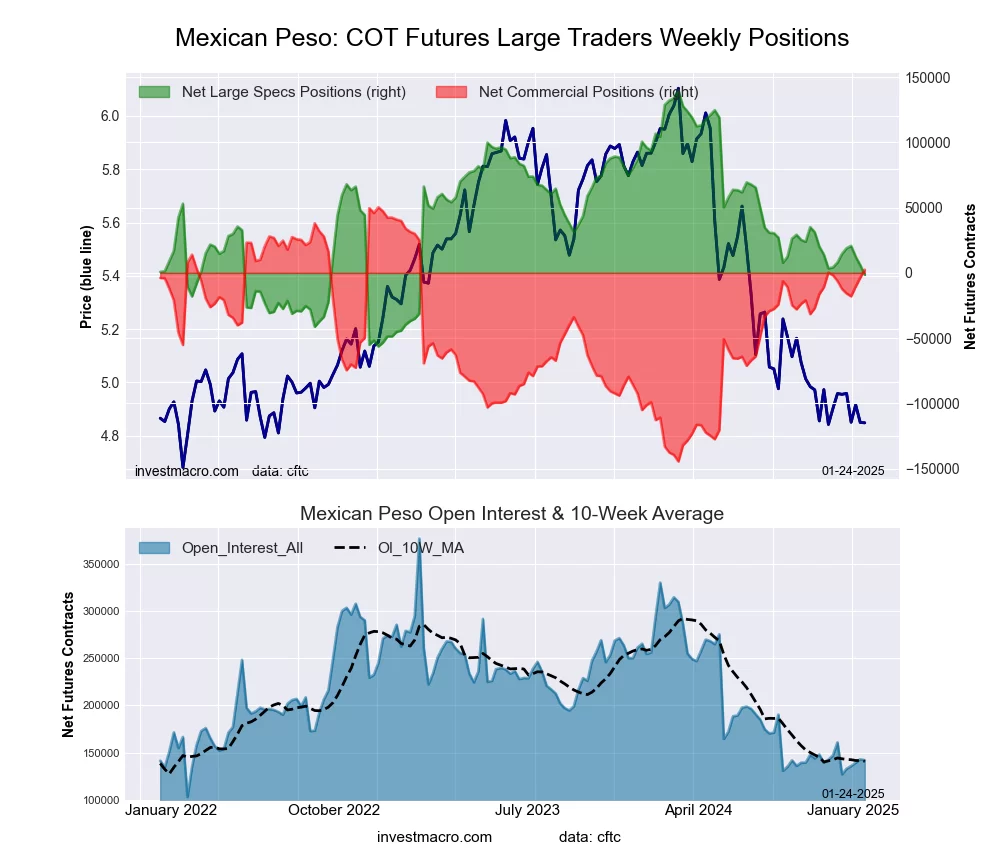 The Mexican Peso large speculator standing this week reached a net position of -1,544 contracts in the data reported through Tuesday. This was a weekly fall of -7,541 contracts from the previous week which had a total of 5,997 net contracts.
This week’s current strength score (the trader positioning range over the past three years, measured from 0 to 100) shows the speculators are currently Bearish with a score of 28.0 percent. The commercials are Bullish with a score of 75.4 percent and the small traders (not shown in chart) are Bearish-Extreme with a score of 17.9 percent.
Price Trend-Following Model: Downtrend
Our weekly trend-following model classifies the current market price position as: Downtrend.
| MEXICAN PESO Statistics | SPECULATORS | COMMERCIALS | SMALL TRADERS |
| – Percent of Open Interest Longs: | 33.9 | 60.5 | 2.7 |
| – Percent of Open Interest Shorts: | 34.9 | 58.8 | 3.4 |
| – Net Position: | -1,544 | 2,423 | -879 |
| – Gross Longs: | 47,985 | 85,763 | 3,886 |
| – Gross Shorts: | 49,529 | 83,340 | 4,765 |
| – Long to Short Ratio: | 1.0 to 1 | 1.0 to 1 | 0.8 to 1 |
| NET POSITION TREND: | | | |
| – Strength Index Score (3 Year Range Pct): | 28.0 | 75.4 | 17.9 |
| – Strength Index Reading (3 Year Range): | Bearish | Bullish | Bearish-Extreme |
| NET POSITION MOVEMENT INDEX: | | | |
| – 6-Week Change in Strength Index: | -4.8 | 4.4 | 4.9 |
Brazilian Real Futures:
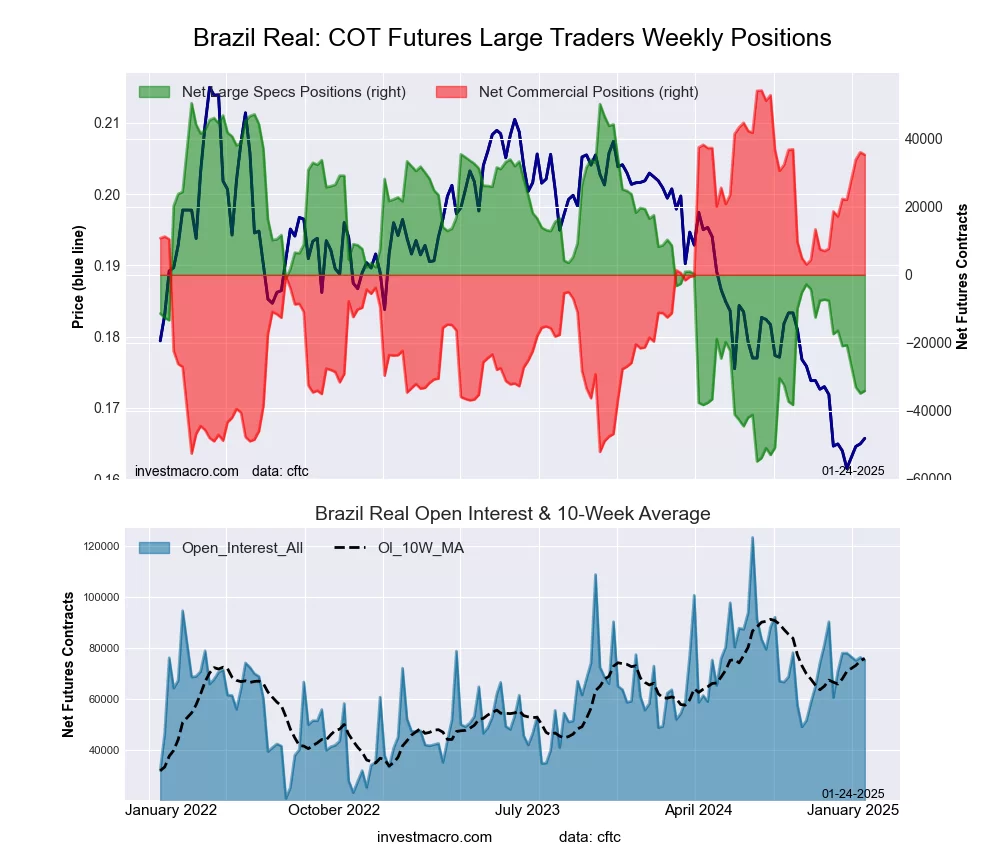 The Brazilian Real large speculator standing this week reached a net position of -34,131 contracts in the data reported through Tuesday. This was a weekly increase of 743 contracts from the previous week which had a total of -34,874 net contracts.
This week’s current strength score (the trader positioning range over the past three years, measured from 0 to 100) shows the speculators are currently Bearish-Extreme with a score of 19.7 percent. The commercials are Bullish-Extreme with a score of 82.3 percent and the small traders (not shown in chart) are Bearish-Extreme with a score of 14.3 percent.
Price Trend-Following Model: Downtrend
Our weekly trend-following model classifies the current market price position as: Downtrend.
| BRAZIL REAL Statistics | SPECULATORS | COMMERCIALS | SMALL TRADERS |
| – Percent of Open Interest Longs: | 27.4 | 69.6 | 2.7 |
| – Percent of Open Interest Shorts: | 72.8 | 22.6 | 4.3 |
| – Net Position: | -34,131 | 35,292 | -1,161 |
| – Gross Longs: | 20,605 | 52,303 | 2,046 |
| – Gross Shorts: | 54,736 | 17,011 | 3,207 |
| – Long to Short Ratio: | 0.4 to 1 | 3.1 to 1 | 0.6 to 1 |
| NET POSITION TREND: | | | |
| – Strength Index Score (3 Year Range Pct): | 19.7 | 82.3 | 14.3 |
| – Strength Index Reading (3 Year Range): | Bearish-Extreme | Bullish-Extreme | Bearish-Extreme |
| NET POSITION MOVEMENT INDEX: | | | |
| – 6-Week Change in Strength Index: | -16.8 | 17.0 | -2.1 |
Bitcoin Futures:
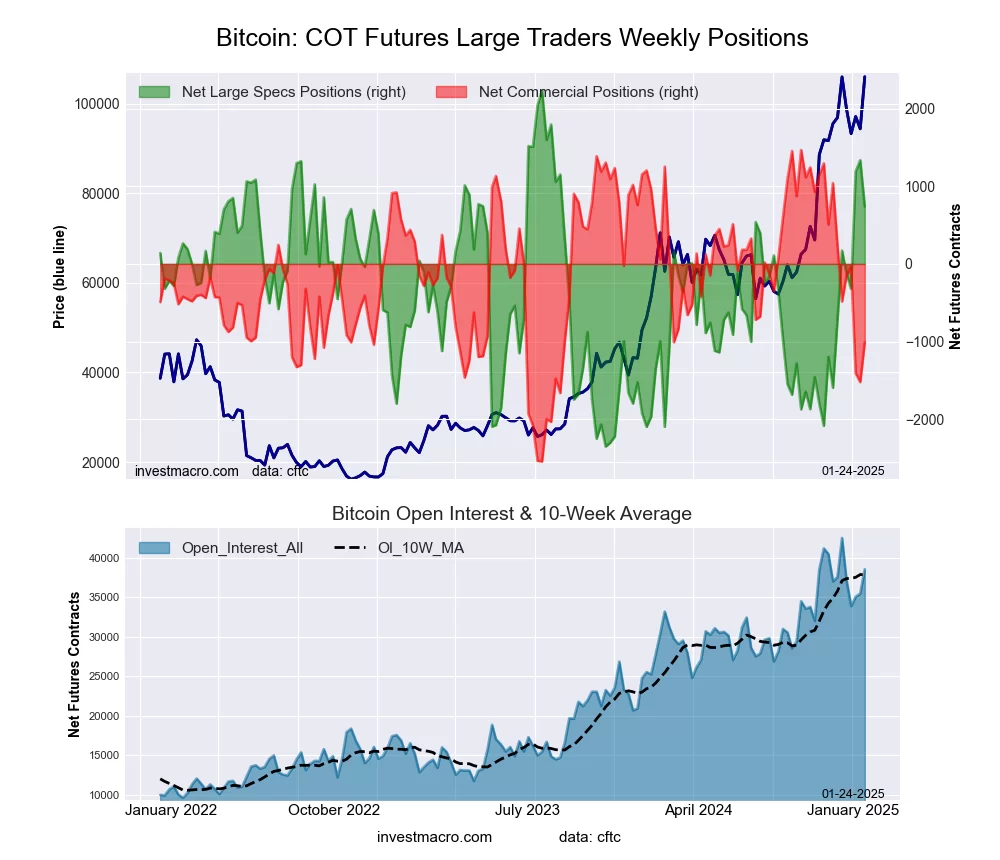 The Bitcoin large speculator standing this week reached a net position of 739 contracts in the data reported through Tuesday. This was a weekly fall of -596 contracts from the previous week which had a total of 1,335 net contracts.
This week’s current strength score (the trader positioning range over the past three years, measured from 0 to 100) shows the speculators are currently Bullish with a score of 67.4 percent. The commercials are Bearish with a score of 38.3 percent and the small traders (not shown in chart) are Bearish with a score of 30.1 percent.
Price Trend-Following Model: Uptrend
Our weekly trend-following model classifies the current market price position as: Uptrend.
| BITCOIN Statistics | SPECULATORS | COMMERCIALS | SMALL TRADERS |
| – Percent of Open Interest Longs: | 75.5 | 4.2 | 3.9 |
| – Percent of Open Interest Shorts: | 73.6 | 6.8 | 3.2 |
| – Net Position: | 739 | -1,007 | 268 |
| – Gross Longs: | 29,121 | 1,625 | 1,486 |
| – Gross Shorts: | 28,382 | 2,632 | 1,218 |
| – Long to Short Ratio: | 1.0 to 1 | 0.6 to 1 | 1.2 to 1 |
| NET POSITION TREND: | | | |
| – Strength Index Score (3 Year Range Pct): | 67.4 | 38.3 | 30.1 |
| – Strength Index Reading (3 Year Range): | Bullish | Bearish | Bearish |
| NET POSITION MOVEMENT INDEX: | | | |
| – 6-Week Change in Strength Index: | 31.8 | -31.0 | -16.0 |
Article By InvestMacro – Receive our weekly COT Newsletter
*COT Report: The COT data, released weekly to the public each Friday, is updated through the most recent Tuesday (data is 3 days old) and shows a quick view of how large speculators or non-commercials (for-profit traders) were positioned in the futures markets.
The CFTC categorizes trader positions according to commercial hedgers (traders who use futures contracts for hedging as part of the business), non-commercials (large traders who speculate to realize trading profits) and nonreportable traders (usually small traders/speculators) as well as their open interest (contracts open in the market at time of reporting). See CFTC criteria here.