
By RoboForex Analytical Department
The USD/JPY pair reached a high of 151.07 on Tuesday, marking its highest level in a week. This movement is largely attributed to ongoing uncertainty regarding the timing of the next interest rate hike by the Bank of Japan (BoJ). The market remains split on whether the BoJ will implement a rate increase in December or delay it until January.
Recent statements from BoJ Governor Kazuo Ueda highlighted that a rate hike is imminent, based on stable economic indicators aligning with expectations. Contrarily, BoJ policymaker Toyoaki Nakamura expressed concerns over the sustainability of wage growth and signs of economic weakening in Japan, adding layers of uncertainty that are influencing market dynamics.
Recent GDP data for Japan showed a growth of 0.3% quarter-on-quarter in Q3, surpassing the expected 0.2% increase. This stronger-than-anticipated economic performance supports a more aggressive stance on future monetary policy adjustments by the BoJ.
Looking ahead, the full scope of the BoJ’s monetary policy for 2025 remains unclear, but increased pressure is expected as the Federal Reserve’s fiscal adjustments set a significant pace for change.
Technical analysis of USD/JPY
Free Reports:
 Sign Up for Our Stock Market Newsletter – Get updated on News, Charts & Rankings of Public Companies when you join our Stocks Newsletter
 Get our Weekly Commitment of Traders Reports - See where the biggest traders (Hedge Funds and Commercial Hedgers) are positioned in the futures markets on a weekly basis.
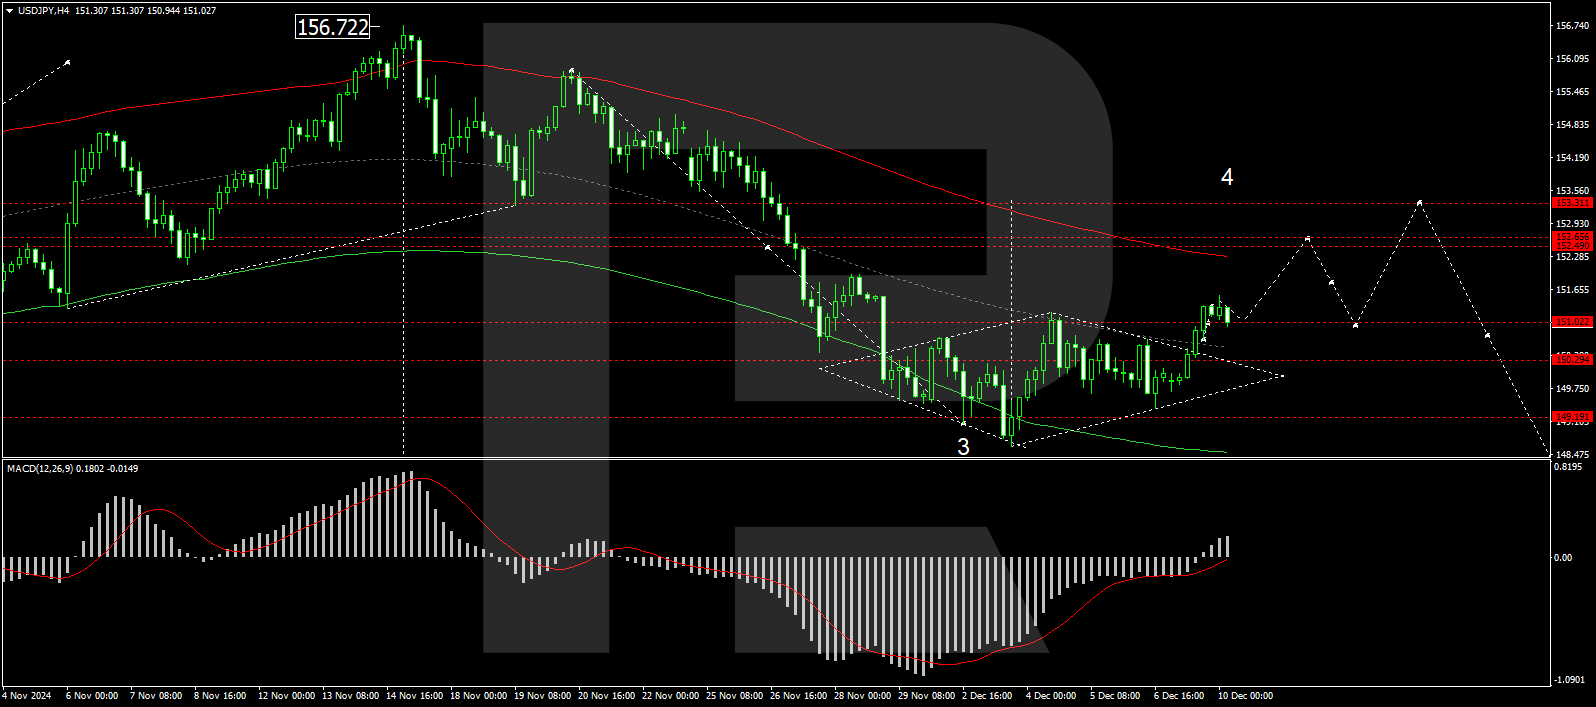
H4 chart: USD/JPY found support at 149.35 and has since been on an upward trajectory. The pair recently breached the 151.00 level, indicating potential for further gains towards 152.50. Currently, a narrow consolidation range has formed around 151.00. Should there be a downward exit from this range, a corrective move to 149.90 might follow. Conversely, an upward break could see the continuation of the upward wave to 152.50, potentially extending to 153.30. The MACD indicator supports this bullish outlook, with its signal line below zero but ascending sharply.
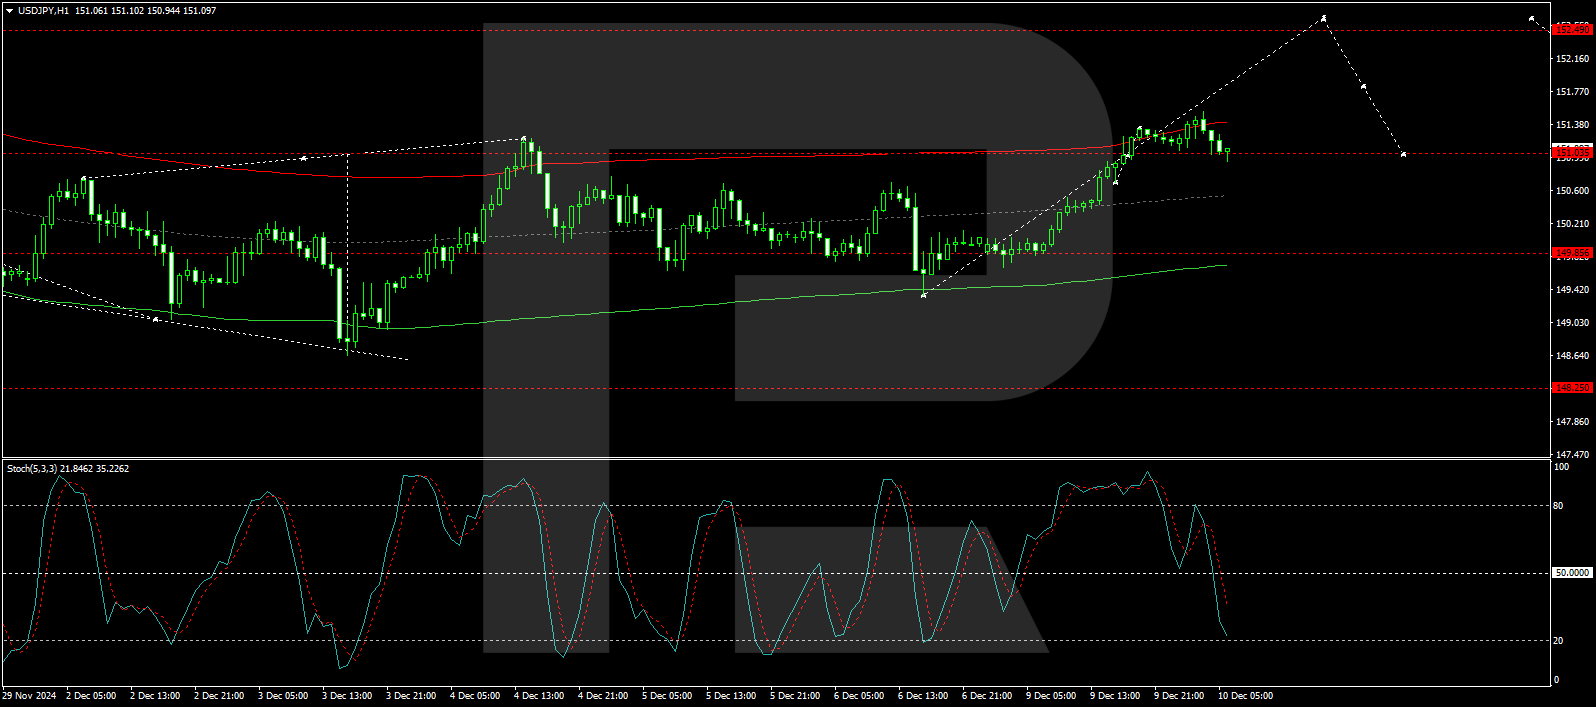
H1 chart: the market has established a consolidation range around 151.00. A downward exit from this range could lead to a correction towards 149.90. If the pair breaks upwards, it is expected to continue the upward wave towards 152.50. Upon reaching this target, a possible correction back to 149.90 may occur. The Stochastic oscillator aligns with this analysis, showing the signal line below 50 and heading towards 20, indicating potential downward movement before resuming upward momentum.
Disclaimer
Any forecasts contained herein are based on the author’s particular opinion. This analysis may not be treated as trading advice. RoboForex bears no responsibility for trading results based on trading recommendations and reviews contained herein.

- COT Metals Charts: Weekly Speculator Bets see small gains for Silver & Gold Jul 12, 2026
- COT Bonds Charts: Speculator Bets led by SOFR 3-Months & 2-Year Bonds Jul 12, 2026
- COT Energy Charts: Weekly Speculator Changes led by Brent Oil Jul 12, 2026
- COT Soft Commodities Charts: Weekly Speculator Changes led by Sugar, Corn & Soybeans Jul 12, 2026
- The US and European stock indices are rising again amid renewed investor interest in the AI industry. Jul 10, 2026
- USD/JPY Falls as Yen Recovers Weekly Losses Jul 10, 2026
- Crude oil prices surged sharply by 7% in reaction to the rapid escalation of the conflict in the Middle East Jul 9, 2026
- Middle East Tensions Weigh on Gold Jul 9, 2026
- Pound Awaits Tighter Policy from Bank of England Jul 8, 2026
- The United States carried out airstrikes on Iran after Iran’s attacked tankers in the Strait of Hormuz. The RBNZ raised the interest rate to 2.5% Jul 8, 2026