Source: Michael Ballanger (12/19/22)
Expert Michael Ballanger looks at the S&P 500, the current state of gold and silver, and some resource companies, including Getchell Gold. Ballanger also touches on Powell’s anti-inflation campaign and tells you his 2023 outlook.
Last Tuesday afternoon, there was an attempted theft of untold magnitude and unimaginable loss; the chairman of the U.S. Federal Reserve Board attempted to make off with what was shaping up to be a powerful year-end rally, commonly referred to as “The Santa Claus Rally” (SCR).
S&P 500
Citing easing financial conditions as represented by the 17.5% rally of the October 13th lows in the S&P 500, the Fed jacked rates up by another 50 basis points to 4.4%. Still, it was the hawkish rhetoric spewed out during the 2:30 presser that aged like a toxic brew overnight, with the following three sessions shaving roughly 6% from the move.
As this is being written (Friday pre-opening), futures are called another 1% lower. Investors have been snapped to attention by a particularly Grinch-like central banker that would rather see a million lost jobs over a 7% inflation rate, especially when his “legacy before charity” is the seasonal policy of choice.
Wall Street cheerleaders are still calling for a face-ripping rally to 4,500 before the next real onslaught of selling but after the events of last Tuesday, their optimism is being put to a test of immense proportion.
What Mr. Powell surely realizes is the madness behind his intention to impersonate Paul Volcker, given that the size of the U.S. national debt is trillions greater in 2022 than in 1980 and that the cost of servicing that debt has grown commensurately.
With demographics clearly, worlds apart in 2022 from the impact of Babyboomers in the 1980s, if these Fed rate hikes continue to choke off growth (and jobs), the tax receipts normally collected due to increased employment and surging stock markets will quickly and fatally reverse exerting even greater pressure on debt serviceability and financial stability.
The outlook for financial conditions is, at best uncertain as we approach 2023, and markets abhor uncertainty the same way the Grinch abhorred Christmas . . .
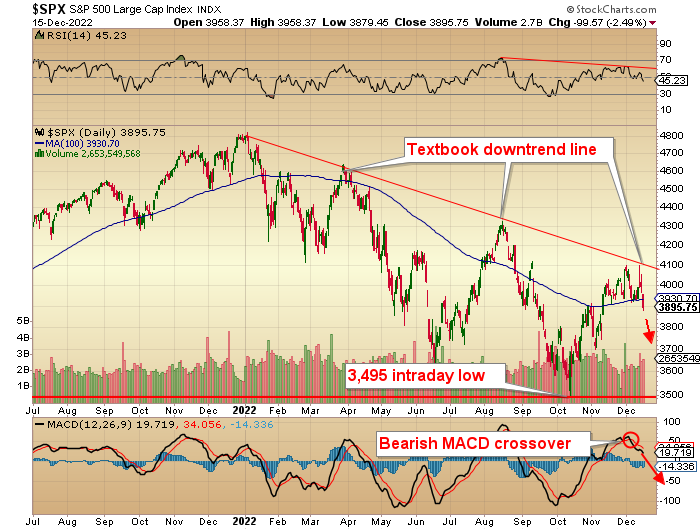
From a technical perspective, the advance stopped right where it should have, punctuated by a downtrend line connecting peaks in late 2021, April, and August of 2022, and now the December peak at 4,100.
Wall Street cheerleaders are still calling for a face-ripping rally to 4,500 before the next real onslaught of selling but after the events of last Tuesday, their optimism is being put to a test of immense proportion.
I took profits on the UPRO:US position in two tranches, the first at a predetermined US$40 and then on a protective stop at US$38.95. I currently have a small call option position on the UPRO:US on the assumption that the Santa Claus Rally, scheduled to commence on Monday, will actually materialize as seasonality wins out over Fed jawboning.
Since the first half of December typically includes selling pressure brought about by year-end distributions from the funds, I expect to see diminished selling pressure next week with the possibility of a more pronounced uptick into New Year’s Day.
Gold and Silver
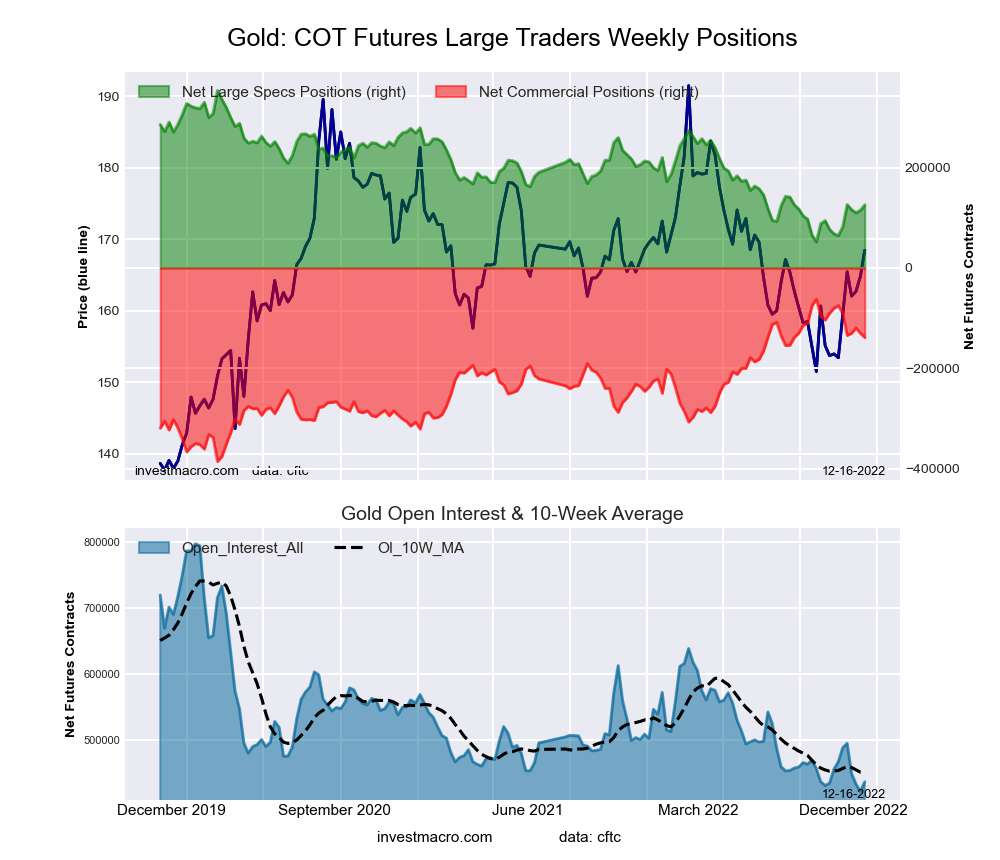
Gold for February delivery clawed its way back above US$1,800/ounce after getting bombed back to US$1,785 on Thursday. I am long a small trading position in the GLD January US$165 calls looking for US$175 by expiry, which translates into a test of the upper resistance band for February gold at US$1,875.
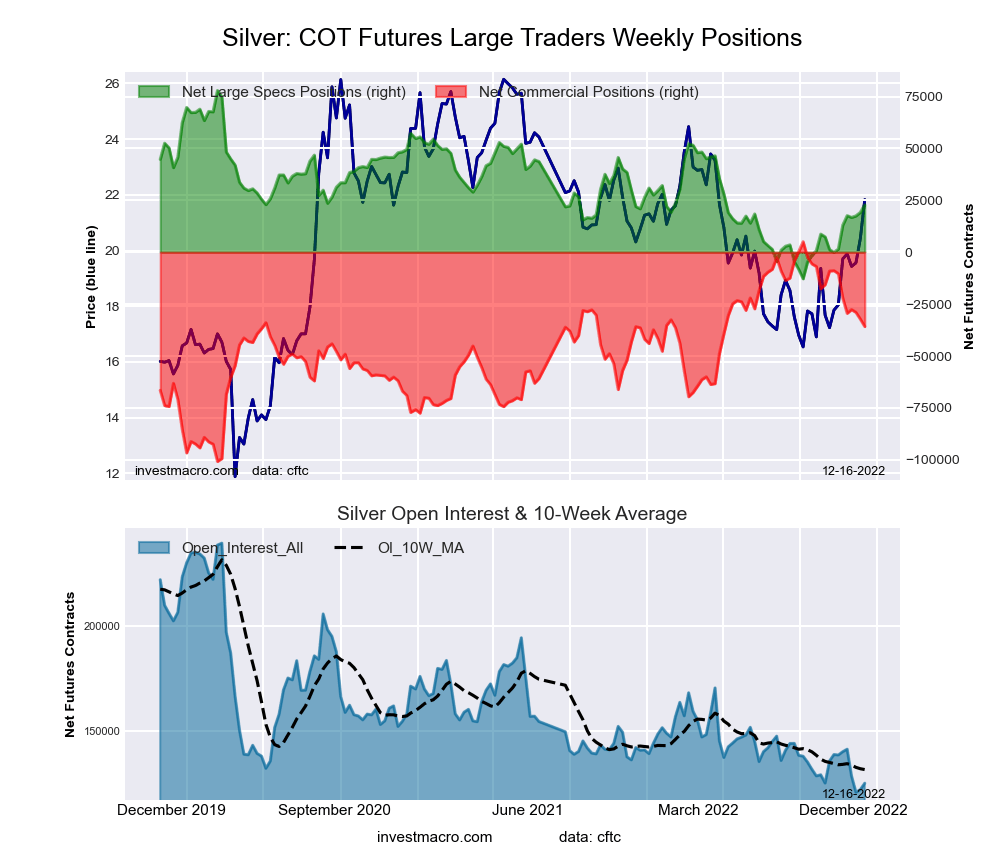
Silver is also acting well, coming off an overbought condition (RSI at 78.49) and a price peak at US$24.39 on Tuesday morning just prior to the FOMC shenanigans.
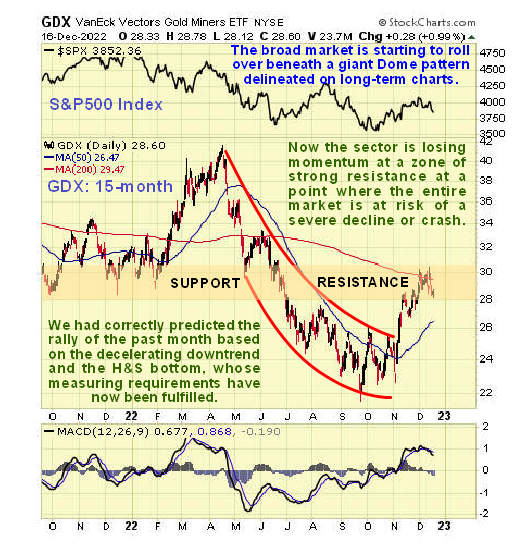
The gold mining stocks represented by the HUI have been in a downtrend since August 2020, peaking at around 373 and troughing out last summer at around 173 and currently residing at around 221. That is a big correction in any market, and to think that it has been inconsequential for the junior developers and explorers verges on the inane.
The VanEck Junior Gold Miner ETF (GDXJ:US) topped in August 2020 just shy of US$64.00 and today resides at US$35.18. The TSX Venture Exchange topped in August 2020 at a tad above 1,100 and today sits at 576.26.
Many of the high-flying juniors from the first half of the year with new, exciting discoveries have had their wings clipped, and no better example than MAX Resource Corp. (MAX:TSX.V; MXROF:OTCBB) whose Cesar project in Columbia drove its price to CA$0.90 before lethargy set in during the fourth quarter sending the stock to less than a third of that today.
Every gold bull has their personal and very private “penny dreadful” tucked away beside or beneath their physical gold and silver and Newmont and Barrick positions if for no other reason than to sprinkle some comic relief on the task of managing their precious metals portfolios.
I, too, have the bulk of my holdings in physical gold and silver held on my property (right next to my 30-odd-six and 357 Magnum), but I have an equal number of “dreadfuls” where the leverage to a rising gold price is immense (as long as you pick the right ones).
Alas, here is where the opportunity-cost “rubber” meets the risk-management “road” and where “glass-half-full” optimists like me get into trouble. The more I keep chirping about “market cap per ounce,” the more the eyes of the Millennial and Gen-X portfolio managers glaze over.
Valuation is irrelevant in a world governed by pattern-recognition technology, and if they buy shares in a junior and news is released that should carry it higher but doesn’t, “to hell with the Babyboomer metric that says Nevada in-ground ounces should be booked at US$75 or US$100 per ounce; it trades at US$18.42 per ounce and looks lower . . . ” and down she goes.
I went through a similar exercise in late 2015 with gold at the US$1,050 level and sentiment scraping the basement and as I was telling the world that gold was officially “on-sale,” most investment firm “analysts” were reciting the bullion bank party line chapter-and-verse and trying to engineer a sub-US$1,000 gold price in the same manner in which the kiddies over at TD Bank recently opened up a “tactical short” on silver in the US$18-plus range only to get stopped out for a 14% “tactical loss” on the trade.
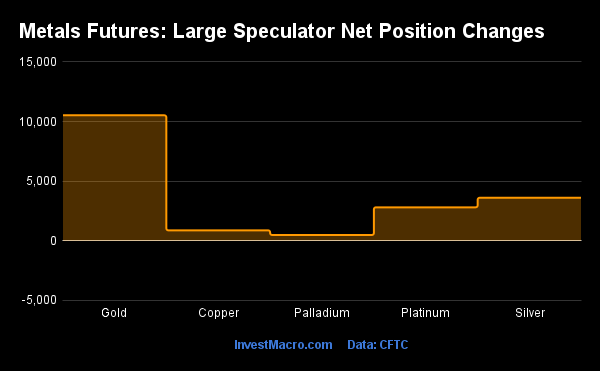
What we really want to know is the number of TD hedge book clients that covered short silver positions into sell-side volume created by that very public display of bearishness. The same thing happened in 2015 as every bank in existence was negative on gold until mid-December when the COT report showed that the Commercial traders (bullion banks) had actually gone net long gold futures for the first time in decades after being net short for the better part of the 21st Century.
You have all read my plagiarism of my newsletter hero, Richard Russell (“Dow Theory Letters”), over the years but the one thing he left me with as he departed this world in 2015 was “Follow the Money.”
You have all read my plagiarism of my newsletter hero, Richard Russell (“Dow Theory Letters”), over the years but the one thing he left me with as he departed this world in 2015 was “Follow the Money.”
Back in the day, the bucket shops that pumped juniors had their “trading desks” backed by partners’ capital that would make sure that their underwritings would go out “oversubscribed,” and how they did that was make sure that the issue was “premium bid” as the deal was being marketed to clients. It was “standard operating procedure” for Foo-Foo Mines Inc. to be a US$0.50 bid as their US$0.40 private placement was being pitched to customers and that was all thanks to “the desk.”
In today’s world, such obvious stock price manipulation would never be tolerated, but I can tell you that a lot of exploration funding was successfully closed back then thanks to the efforts of “the desk.” You see, rules designed by the “WOKE” generation may have virtue at heart but most of the time, it is simply make-work programs for rules-based, anal-retentive Millennials that need justification for their own private versions of corporate correctness.
The plight of junior gold developers is one that grates on my nerves and that is entirely understandable because the biggest passes I have had in my nigh-on seven decades on the planet have come at the helm of resource discoveries. Having lost millions of dollars due to blind optimism and misplaced loyalties, I have made an even greater amount than that due to the blessings of Mother Nature and Lady Luck, the two Devine Deities of the World of Mineral Exploration.
Getchell Gold Corp.
To wit, knowing the extreme difficulties in identifying a sound project worthy of my speculative dollars, I do not tread lightly in the catacombs of due diligence, nor do I take anything for granted. No better example of that resides in my undying faith in Getchell Gold Corp. (GTCH:CSE; GGLDF:OTCQB), whose Maiden Resource Estimate was announced Friday with a global resource of 2,059,900 ounces of gold located in arguably the best mining jurisdiction in the world.
Having invested my first centablo in 2017, Getchell’s Fondaway Canyon Property has metamorphosed into a beast of a project due in no small degree to the intuitive work of geologist and President Mike Sieb and Vice-President of Exploration Scott Frostad.
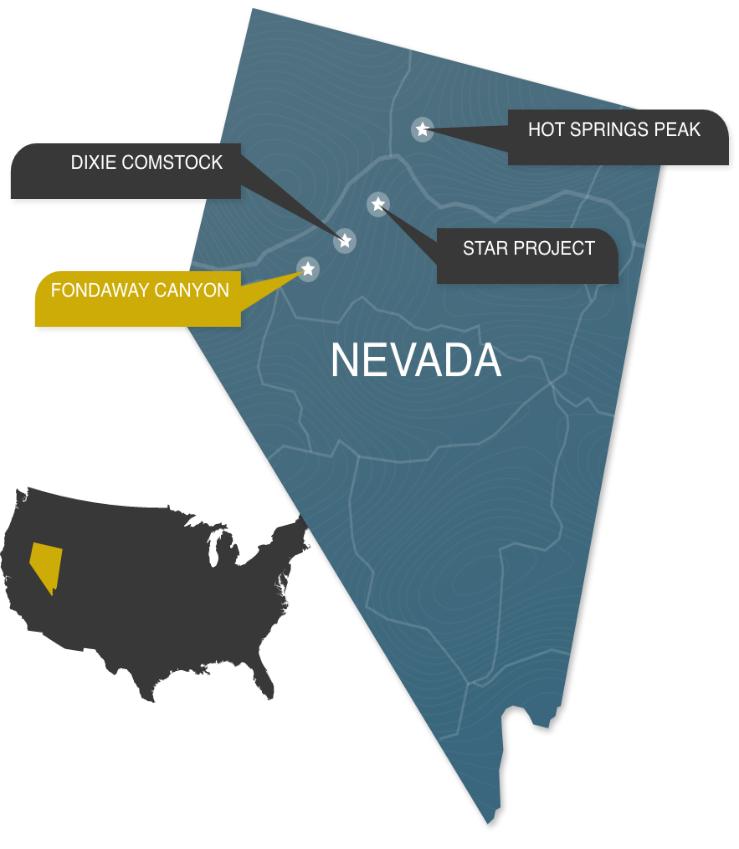
Prior to the acquisition of Fondaway Canyon by Getchell in 2019, it was seen as a “marginal project” with low-grade ore at depths prohibitive to open-pit mining and grades prohibitive to underground mining.
That narrative was exacerbated and enforced by the vendors (Canarc Resource Corp. (CCM:TSX; CRCUF:OTC) et al.) and considered the “insider’s view” by many of the newsletter writers that love to pick scabs from projects outside of their personal portfolios which explains the lack of coverage by the newsletters which affects the investment bankers because their institutional clients need to know that retail interest will provide them with adequate liquidity when they elect to sell the shares and ride the warrants usually attached to these until financings.
That was a convenient excuse to blow off inquiries into Getchell and the Fondaway asset but once Sieb and Frosted began to chip away at that flawed narrative through skillful interpretation of the myriad of data that had to be digitized (during the pandemic shutdown in 2020), the resultant drill results began to arrive with impressive widths and grades that blew away any need for the word “marginal” in referring to Fondaway.
Intercepts such as 25 meters of 10.4 g/t Au in brand new zones such as North Fork and Colorado SW started to seriously redefine the Fondaway asset. As this is being written, they are now 43101-compliant on their first Maiden Resource Estimate, which incorporates all data not included in the 2017 43101 report and doubles the resource while at the same time awaiting the results of five holes drilled after the cut-off point for the engineers’ assessment of the data.
With Fondaway now open along strike and to depth, I see this eventually morphing into a “Tier One Asset” (5 million ounces or greater), and if I am correct in my forecast of US$2,250/ounce gold in the first half of 2023, valuation per ounce could be quite easily pegged in the US$200-300 per ounce levels for in-ground ounces in favorable jurisdictions such as Nevada.
In case you are wondering if I have a “hidden agenda” in devoting so much of this week’s missive on one junior name, the answer is “Yes, I do,” but once divulged, it moves from “hidden” to “admitted” (something Kevin O’Leary might wish to practice). My “agenda” is two-fold: a) to introduce this undervalued asset to some prospective new investors and b) to attract new subscribers to my service.
As to disclosure, I also own a ton of shares, so coupled with the other reasons given, call it a “shameless book pump” if you wish, but it does not alter the opportunity that I believe resides in this name.
Powell’s Anti-Inflation Campaign
Next week is the last week before Christmas, and as it usually takes me a solid two weeks to finalize the GGMA 2023 Forecast Issue, there will be no more missives until the end of the first week of January. This is going to be a very daunting exercise in attempting to lay out a course of investment actions to be taken in 2023.
It was a veritable “walk in the park” last year because we were coming out of two years of monetary and fiscal madness and long overdue for a comeuppance of sorts, which we got in spades and continue to get as the inflation monster dominates central bank policies around the globe.
I leave you all today with the notion that if there is one glaring difference between the anti-inflation campaign of Paul Volcker in 1980-82 and the one being orchestrated by Jay Powell, it lies in the differences in the sizes of the national debt.
My suspicion is that 2023 will be a better year — how could it be any worse? — and that a resurgence in global demand will create sharp price movements in the electrification metals such as copper, lead, cobalt, and nickel while sovereign debt worries keep the precious metals “bid” well into the decade.
I leave you all today with the notion that if there is one glaring difference between the anti-inflation campaign of Paul Volcker in 1980-82 and the one being orchestrated by Jay Powell, it lies in the differences in the sizes of the national debt. In 1980, the Federal debt in the U.S. was around US$900 billion, with the U.S. the world’s largest creditor nation, while in 2022, the national debt is US$31.28 trillion, with the U.S. the world’s largest debtor nation.
Since the U.S. military is a policeman to the Western World, you cannot send the nation with the global reserve currency into fits of insolvency with escalating debt service costs crippling the economy and, with it, the war machine.
There was a superb exchange back in the election campaign of 1988 during the vice-presidential debate when Senator Lloyd Bentsen took exception to Dan Quayle’s attempt to frame himself as being “more experienced than Jack Kennedy” by saying, “Senator, I served with Jack Kennedy; I knew Jack Kennedy; Jack Kennedy was a friend of mine. YOU, Sir, are NO JACK KENNEDY.” Well, here in 2022, soon-to-be 2023, I would say to Jerome Powell: “I survived the Volcker Recession of 1981-1982 with interest rates at 16.5%. YOU, SIR, are NO PAUL VOLCKER.”
With debt levels off the charts, it is either grow or die. Powell knows this all too well . . .
Michael Ballanger Disclaimer:
This letter makes no guarantee or warranty on the accuracy or completeness of the data provided. Nothing contained herein is intended or shall be deemed to be investment advice, implied or otherwise. This letter represents my views and replicates trades that I am making but nothing more than that. Always consult your registered advisor to assist you with your investments. I accept no liability for any loss arising from the use of the data contained on this letter. Options and junior mining stocks contain a high level of risk that may result in the loss of part or all invested capital and therefore are suitable for experienced and professional investors and traders only. One should be familiar with the risks involved in junior mining and options trading and we recommend consulting a financial adviser if you feel you do not understand the risks involved.
Disclosures:
1) Michael J. Ballanger: I, or members of my immediate household or family, own securities of the following companies mentioned in this article: All. I personally am, or members of my immediate household or family are, paid by the following companies mentioned in this article: My company, Bonaventure Explorations Ltd., has a consulting relationship with: None.
2) The following companies mentioned in this article are billboard sponsors of Streetwise Reports: None. Click here for important disclosures about sponsor fees. As of the date of this article, an affiliate of Streetwise Reports has a consulting relationship with Western Uranium & Vanadium Corp. Please click here for more information.
3) Statements and opinions expressed are the opinions of the author and not of Streetwise Reports or its officers. The author is wholly responsible for the validity of the statements. The author was not paid by Streetwise Reports for this article. Streetwise Reports was not paid by the author to publish or syndicate this article. Streetwise Reports requires contributing authors to disclose any shareholdings in, or economic relationships with, companies that they write about. Streetwise Reports relies upon the authors to accurately provide this information and Streetwise Reports has no means of verifying its accuracy.
4) This article does not constitute investment advice. Each reader is encouraged to consult with his or her individual financial professional and any action a reader takes as a result of information presented here is his or her own responsibility. By opening this page, each reader accepts and agrees to Streetwise Reports’ terms of use and full legal disclaimer. This article is not a solicitation for investment. Streetwise Reports does not render general or specific investment advice and the information on Streetwise Reports should not be considered a recommendation to buy or sell any security. Streetwise Reports does not endorse or recommend the business, products, services or securities of any company mentioned on Streetwise Reports.
5) From time to time, Streetwise Reports LLC and its directors, officers, employees or members of their families, as well as persons interviewed for articles and interviews on the site, may have a long or short position in securities mentioned. Directors, officers, employees or members of their immediate families are prohibited from making purchases and/or sales of those securities in the open market or otherwise from the time of the decision to publish an article until three business days after the publication of the article. The foregoing prohibition does not apply to articles that in substance only restate previously published company releases.
As of the date of this article, officers and/or employees of Streetwise Reports LLC (including members of their household) own securities of Getchell Gold Corp., a company mentioned in this article.


