
By InvestMacro
Here are the latest charts and statistics for the Commitment of Traders (COT) reports data published by the Commodities Futures Trading Commission (CFTC).
The latest COT data is updated through Tuesday November 29th and shows a quick view of how large traders (for-profit speculators and commercial hedgers) were positioned in the futures markets.
Weekly Speculator Changes led by Eurodollar & 2-Year Bond

The COT bond market speculator bets were mixed this week as four out of the eight bond markets we cover had higher positioning this week while the other four markets had lower contracts.
Free Reports:
 Download Our Metatrader 4 Indicators – Put Our Free MetaTrader 4 Custom Indicators on your charts when you join our Weekly Newsletter
 Get our Weekly Commitment of Traders Reports - See where the biggest traders (Hedge Funds and Commercial Hedgers) are positioned in the futures markets on a weekly basis.
Leading the weekly gains for the bond markets was the Eurodollar (115,943 contracts) with the 2-Year Bond (38,817 contracts), the Ultra 10-Year (25,883 contracts) and the 10-Year Bond (24,484 contracts) also showing positive weeks.
The bond markets leading the weekly declines in speculator bets this week was the Fed Funds (-44,174 contracts) with the Long US Bond (-13,433 contracts), the Ultra US Bond (-12,393 contracts), and the 5-Year Bond (-5,695 contracts) also registering lower bets on the week.
Highlighting the COT bonds data this week is the continued decrease in speculator bearish positions for the Eurodollar market. The large speculator position in Eurodollar futures fell this week for the third straight week and for the eighth time out of the past eleven weeks. This recent trimming of the bearish position has shaved off a total of 1,167,970 contracts – going from a total of -2,877,322 contracts on September 13th to this week’s total of -1,709,352 contracts.
Eurodollar contracts are a bet on short-term interest rates where more bullish bets equal a bet on lower interest rates while more bearish bets means speculators are looking for higher interest rates. The Eurodollar speculator contracts hit a bearish peak on August 9th at a total of -2,885,979 contracts and since then speculators have reduced their bearish bets in eleven out of those sixteen weeks.
| Nov-29-2022 | OI | OI-Index | Spec-Net | Spec-Index | Com-Net | COM-Index | Smalls-Net | Smalls-Index |
|---|---|---|---|---|---|---|---|---|
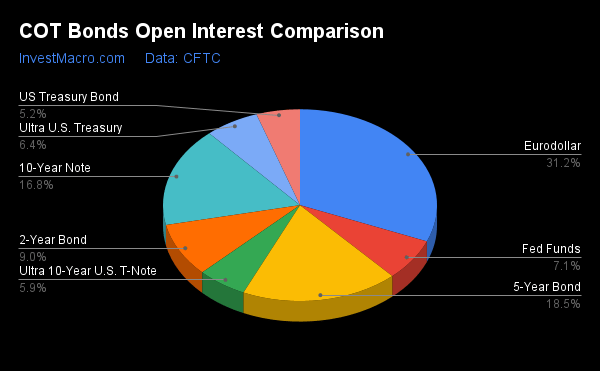
| Eurodollar | 7,234,801 | 0 | -1,709,352 | 22 | 1,952,152 | 76 | -242,800 | 51 |
| FedFunds | 1,641,595 | 58 | -32,618 | 36 | 42,973 | 65 | -10,355 | 33 |
| 2-Year | 2,099,117 | 15 | -528,178 | 9 | 519,516 | 89 | 8,662 | 56 |
| Long T-Bond | 1,197,681 | 42 | -103,917 | 51 | 66,851 | 34 | 37,066 | 82 |
| 10-Year | 3,897,383 | 58 | -296,772 | 27 | 359,620 | 65 | -62,848 | 65 |
| 5-Year | 4,303,419 | 69 | -529,349 | 5 | 618,522 | 89 | -89,173 | 57 |
US Treasury Bond tops Strength Scores
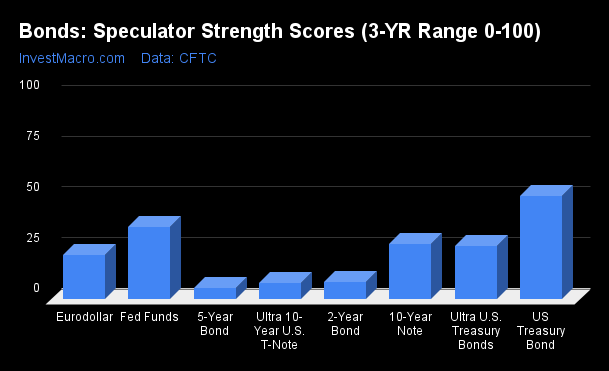
Strength Scores (a normalized measure of Speculator positions over a 3-Year range, from 0 to 100 where above 80 is extreme bullish and below 20 is extreme bearish) show that the US Treasury Bond (50.8 percent) leads the bonds category and is the only market above its three-year midpoint (above 50 percent).
On the downside, the 5-Year Bond (5.5 percent), the Ultra 10-Year Bond (8.2 percent) and the 2-Year Bond (8.6 percent) come in at the lowest strength levels currently and are all in bearish extreme positions (below 20 percent).
Strength Statistics:
Fed Funds (35.6 percent) vs Fed Funds previous week (41.0 percent)
2-Year Bond (8.6 percent) vs 2-Year Bond previous week (2.9 percent)
5-Year Bond (5.5 percent) vs 5-Year Bond previous week (6.3 percent)
10-Year Bond (27.3 percent) vs 10-Year Bond previous week (23.6 percent)
Ultra 10-Year Bond (8.2 percent) vs Ultra 10-Year Bond previous week (1.5 percent)
US Treasury Bond (50.8 percent) vs US Treasury Bond previous week (55.1 percent)
Ultra US Treasury Bond (26.3 percent) vs Ultra US Treasury Bond previous week (31.4 percent)
Eurodollar (21.7 percent) vs Eurodollar previous week (19.5 percent)
Strength Trends led by Eurodollar & 10-Year Treasury Bond
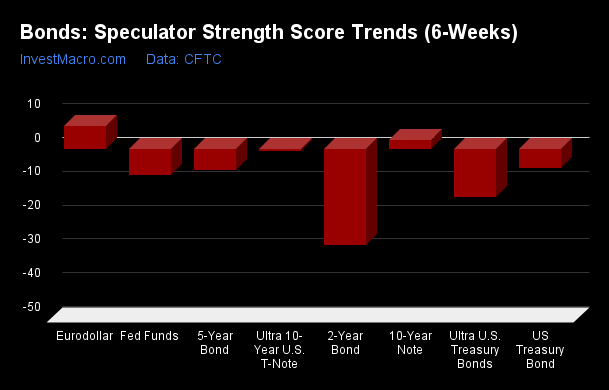
Strength Score Trends (or move index, calculates the 6-week changes in strength scores) showed that the Eurodollar (6.8 percent) leads the past six weeks trends for bonds this week. The 10-Year Bond (2.5 percent) is the only other positive mover in the latest trends data.
The 2-Year Bond (-28.6 percent) leads the downside trend scores currently while the next markets with lower trend scores were the Ultra US Treasury Bond (-14.2 percent) and the Fed Funds (-7.7 percent).
Strength Trend Statistics:
Fed Funds (-7.7 percent) vs Fed Funds previous week (1.3 percent)
2-Year Bond (-28.6 percent) vs 2-Year Bond previous week (-31.6 percent)
5-Year Bond (-6.3 percent) vs 5-Year Bond previous week (-6.0 percent)
10-Year Bond (2.5 percent) vs 10-Year Bond previous week (2.9 percent)
Ultra 10-Year Bond (-0.7 percent) vs Ultra 10-Year Bond previous week (-7.6 percent)
US Treasury Bond (-5.7 percent) vs US Treasury Bond previous week (-2.2 percent)
Ultra US Treasury Bond (-14.2 percent) vs Ultra US Treasury Bond previous week (-10.9 percent)
Eurodollar (6.8 percent) vs Eurodollar previous week (5.9 percent)
Individual Bond Markets:
3-Month Eurodollars Futures:
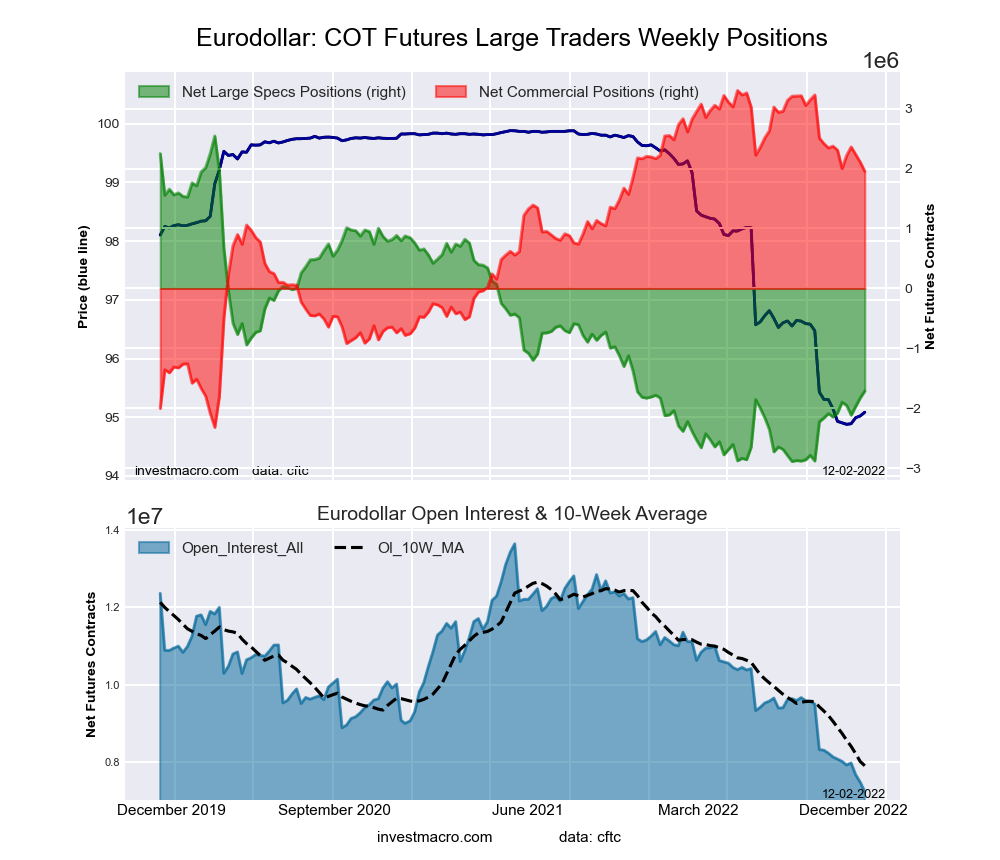 The 3-Month Eurodollars large speculator standing this week came in at a net position of -1,709,352 contracts in the data reported through Tuesday. This was a weekly rise of 115,943 contracts from the previous week which had a total of -1,825,295 net contracts.
This week’s current strength score (the trader positioning range over the past three years, measured from 0 to 100) shows the speculators are currently Bearish with a score of 21.7 percent. The commercials are Bullish with a score of 76.0 percent and the small traders (not shown in chart) are Bullish with a score of 51.0 percent.
| 3-Month Eurodollars Statistics | SPECULATORS | COMMERCIALS | SMALL TRADERS |
| – Percent of Open Interest Longs: | 7.2 | 68.6 | 5.0 |
| – Percent of Open Interest Shorts: | 30.8 | 41.6 | 8.3 |
| – Net Position: | -1,709,352 | 1,952,152 | -242,800 |
| – Gross Longs: | 520,547 | 4,964,242 | 360,091 |
| – Gross Shorts: | 2,229,899 | 3,012,090 | 602,891 |
| – Long to Short Ratio: | 0.2 to 1 | 1.6 to 1 | 0.6 to 1 |
| NET POSITION TREND: | |||
| – Strength Index Score (3 Year Range Pct): | 21.7 | 76.0 | 51.0 |
| – Strength Index Reading (3 Year Range): | Bearish | Bullish | Bullish |
| NET POSITION MOVEMENT INDEX: | |||
| – 6-Week Change in Strength Index: | 6.8 | -6.3 | -3.1 |
30-Day Federal Funds Futures:
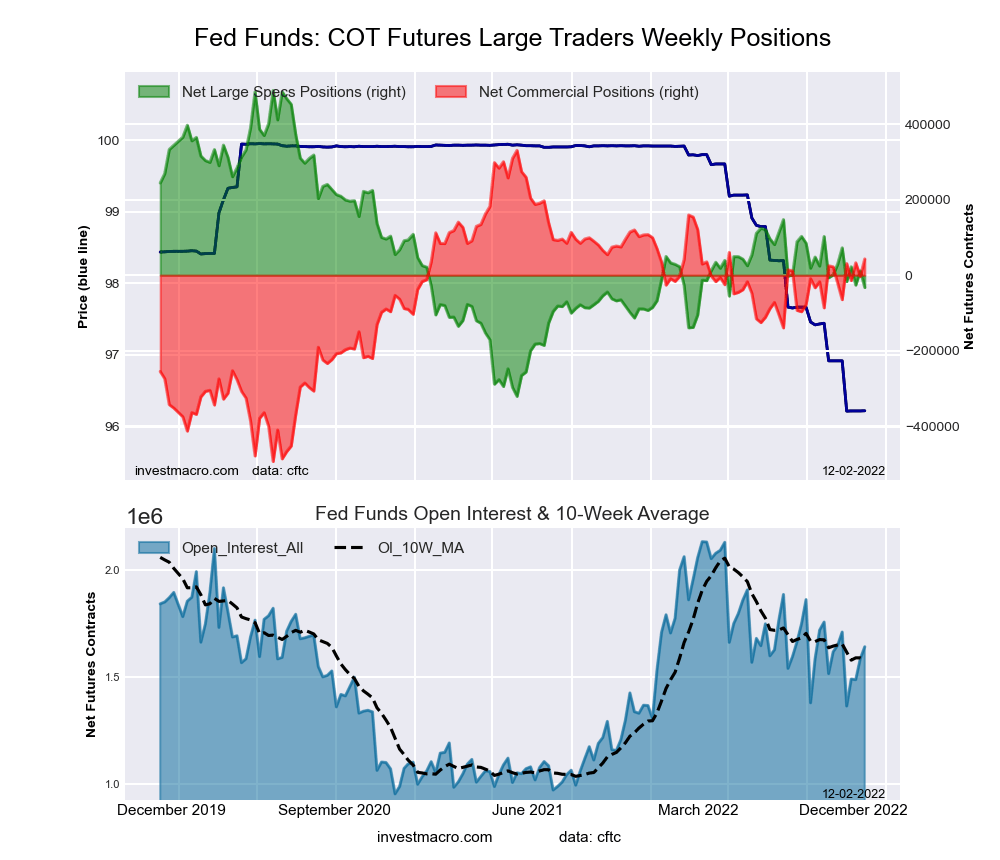 The 30-Day Federal Funds large speculator standing this week came in at a net position of -32,618 contracts in the data reported through Tuesday. This was a weekly reduction of -44,174 contracts from the previous week which had a total of 11,556 net contracts.
This week’s current strength score (the trader positioning range over the past three years, measured from 0 to 100) shows the speculators are currently Bearish with a score of 35.6 percent. The commercials are Bullish with a score of 65.1 percent and the small traders (not shown in chart) are Bearish with a score of 33.3 percent.
| 30-Day Federal Funds Statistics | SPECULATORS | COMMERCIALS | SMALL TRADERS |
| – Percent of Open Interest Longs: | 11.2 | 75.0 | 1.9 |
| – Percent of Open Interest Shorts: | 13.2 | 72.3 | 2.5 |
| – Net Position: | -32,618 | 42,973 | -10,355 |
| – Gross Longs: | 184,273 | 1,230,567 | 30,497 |
| – Gross Shorts: | 216,891 | 1,187,594 | 40,852 |
| – Long to Short Ratio: | 0.8 to 1 | 1.0 to 1 | 0.7 to 1 |
| NET POSITION TREND: | |||
| – Strength Index Score (3 Year Range Pct): | 35.6 | 65.1 | 33.3 |
| – Strength Index Reading (3 Year Range): | Bearish | Bullish | Bearish |
| NET POSITION MOVEMENT INDEX: | |||
| – 6-Week Change in Strength Index: | -7.7 | 7.7 | -4.2 |
2-Year Treasury Note Futures:
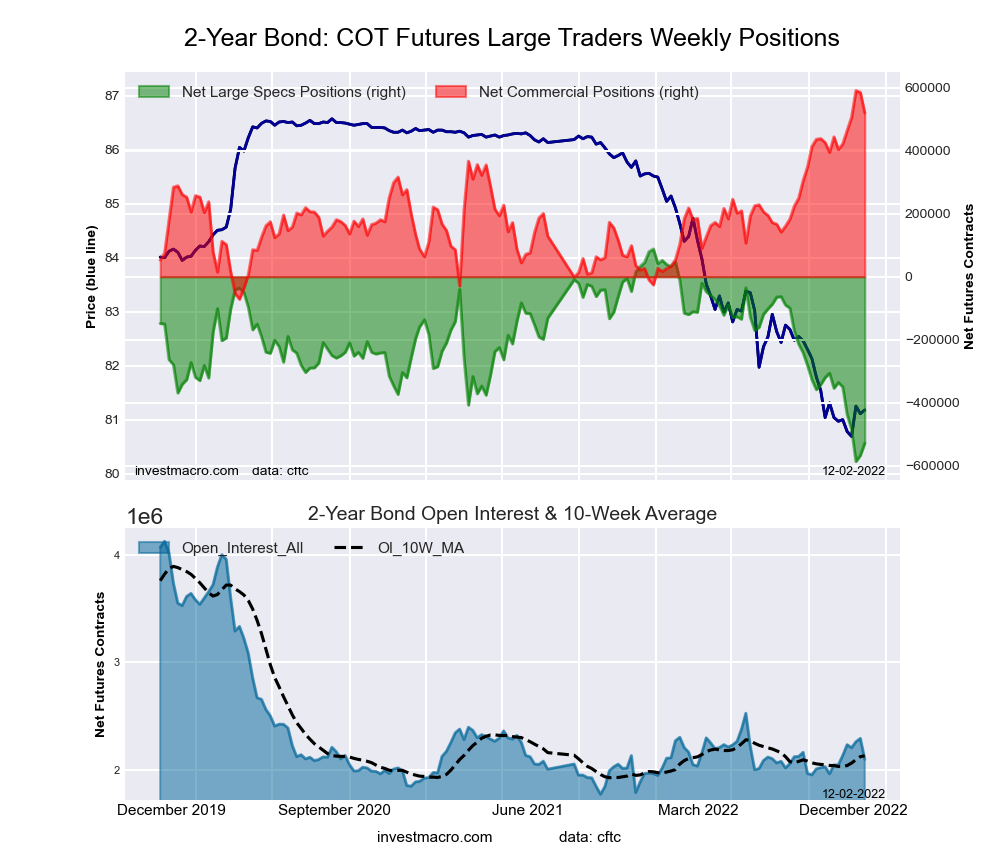 The 2-Year Treasury Note large speculator standing this week came in at a net position of -528,178 contracts in the data reported through Tuesday. This was a weekly gain of 38,817 contracts from the previous week which had a total of -566,995 net contracts.
This week’s current strength score (the trader positioning range over the past three years, measured from 0 to 100) shows the speculators are currently Bearish-Extreme with a score of 8.6 percent. The commercials are Bullish-Extreme with a score of 89.2 percent and the small traders (not shown in chart) are Bullish with a score of 55.9 percent.
| 2-Year Treasury Note Statistics | SPECULATORS | COMMERCIALS | SMALL TRADERS |
| – Percent of Open Interest Longs: | 7.4 | 81.0 | 8.9 |
| – Percent of Open Interest Shorts: | 32.6 | 56.3 | 8.5 |
| – Net Position: | -528,178 | 519,516 | 8,662 |
| – Gross Longs: | 156,249 | 1,700,306 | 186,732 |
| – Gross Shorts: | 684,427 | 1,180,790 | 178,070 |
| – Long to Short Ratio: | 0.2 to 1 | 1.4 to 1 | 1.0 to 1 |
| NET POSITION TREND: | |||
| – Strength Index Score (3 Year Range Pct): | 8.6 | 89.2 | 55.9 |
| – Strength Index Reading (3 Year Range): | Bearish-Extreme | Bullish-Extreme | Bullish |
| NET POSITION MOVEMENT INDEX: | |||
| – 6-Week Change in Strength Index: | -28.6 | 17.4 | 34.5 |
5-Year Treasury Note Futures:
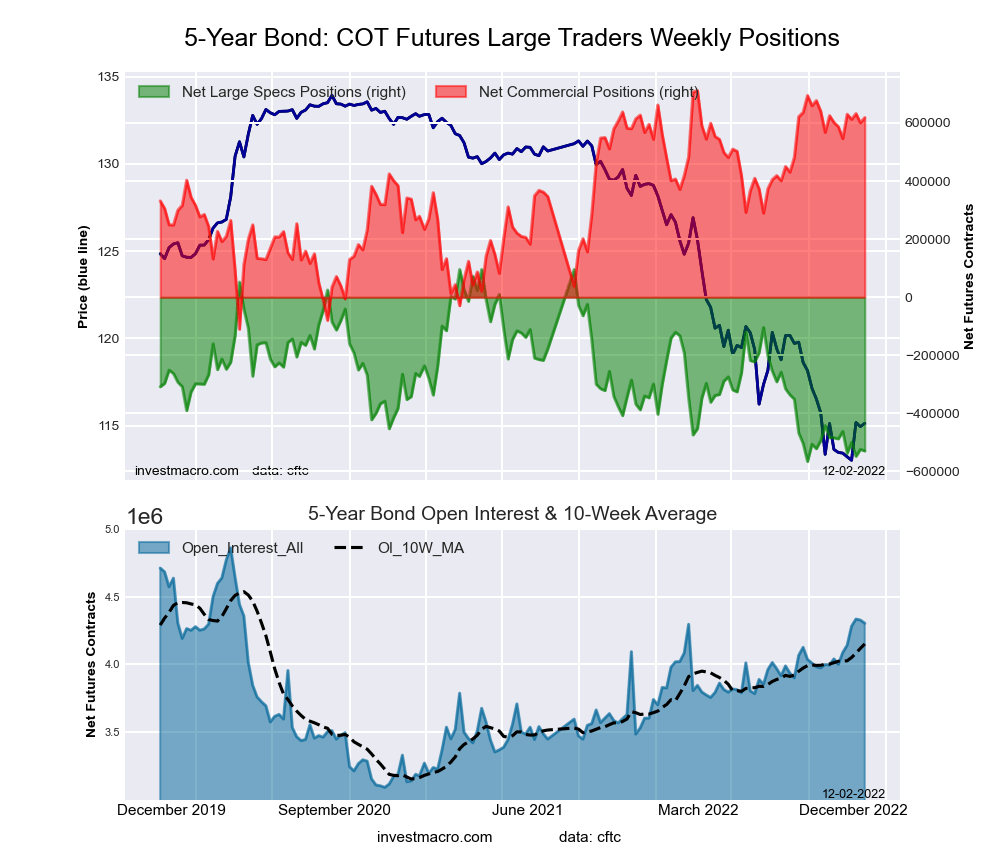 The 5-Year Treasury Note large speculator standing this week came in at a net position of -529,349 contracts in the data reported through Tuesday. This was a weekly fall of -5,695 contracts from the previous week which had a total of -523,654 net contracts.
This week’s current strength score (the trader positioning range over the past three years, measured from 0 to 100) shows the speculators are currently Bearish-Extreme with a score of 5.5 percent. The commercials are Bullish-Extreme with a score of 88.7 percent and the small traders (not shown in chart) are Bullish with a score of 56.6 percent.
| 5-Year Treasury Note Statistics | SPECULATORS | COMMERCIALS | SMALL TRADERS |
| – Percent of Open Interest Longs: | 7.4 | 82.4 | 7.2 |
| – Percent of Open Interest Shorts: | 19.7 | 68.0 | 9.3 |
| – Net Position: | -529,349 | 618,522 | -89,173 |
| – Gross Longs: | 316,986 | 3,544,108 | 309,862 |
| – Gross Shorts: | 846,335 | 2,925,586 | 399,035 |
| – Long to Short Ratio: | 0.4 to 1 | 1.2 to 1 | 0.8 to 1 |
| NET POSITION TREND: | |||
| – Strength Index Score (3 Year Range Pct): | 5.5 | 88.7 | 56.6 |
| – Strength Index Reading (3 Year Range): | Bearish-Extreme | Bullish-Extreme | Bullish |
| NET POSITION MOVEMENT INDEX: | |||
| – 6-Week Change in Strength Index: | -6.3 | 3.9 | 2.8 |
10-Year Treasury Note Futures:
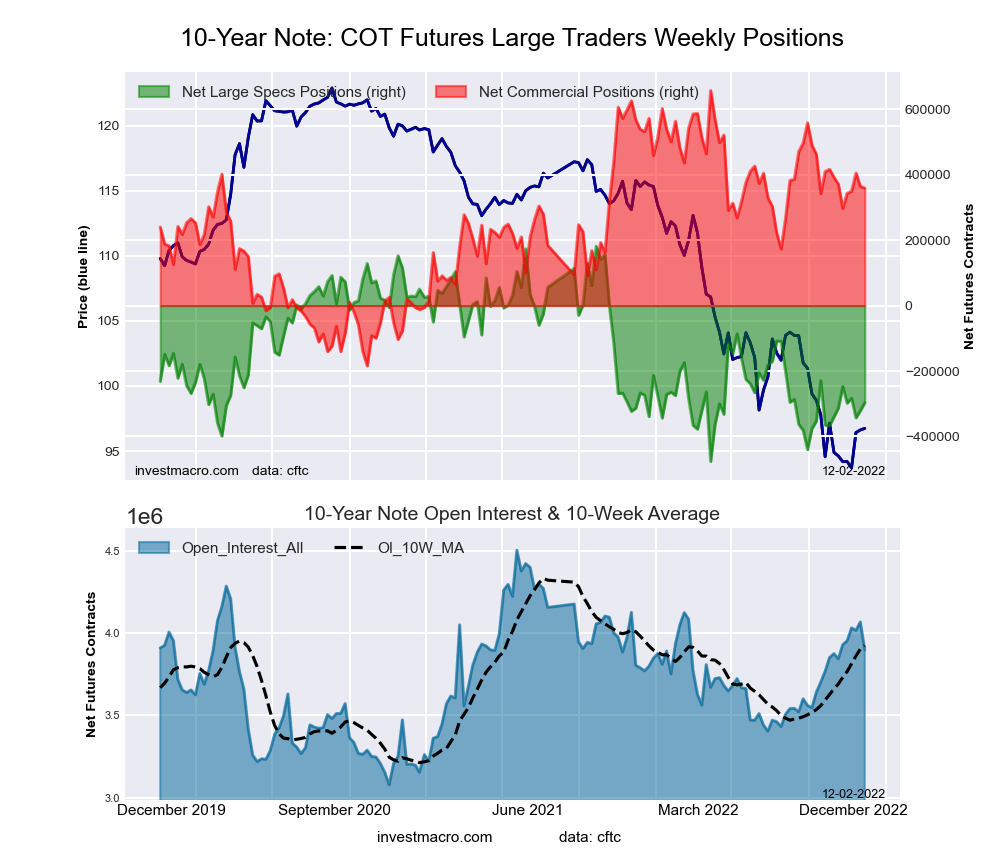 The 10-Year Treasury Note large speculator standing this week came in at a net position of -296,772 contracts in the data reported through Tuesday. This was a weekly rise of 24,484 contracts from the previous week which had a total of -321,256 net contracts.
This week’s current strength score (the trader positioning range over the past three years, measured from 0 to 100) shows the speculators are currently Bearish with a score of 27.3 percent. The commercials are Bullish with a score of 64.6 percent and the small traders (not shown in chart) are Bullish with a score of 65.1 percent.
| 10-Year Treasury Note Statistics | SPECULATORS | COMMERCIALS | SMALL TRADERS |
| – Percent of Open Interest Longs: | 12.0 | 75.4 | 9.0 |
| – Percent of Open Interest Shorts: | 19.7 | 66.2 | 10.6 |
| – Net Position: | -296,772 | 359,620 | -62,848 |
| – Gross Longs: | 469,072 | 2,939,872 | 351,940 |
| – Gross Shorts: | 765,844 | 2,580,252 | 414,788 |
| – Long to Short Ratio: | 0.6 to 1 | 1.1 to 1 | 0.8 to 1 |
| NET POSITION TREND: | |||
| – Strength Index Score (3 Year Range Pct): | 27.3 | 64.6 | 65.1 |
| – Strength Index Reading (3 Year Range): | Bearish | Bullish | Bullish |
| NET POSITION MOVEMENT INDEX: | |||
| – 6-Week Change in Strength Index: | 2.5 | -1.4 | -1.1 |
Ultra 10-Year Notes Futures:
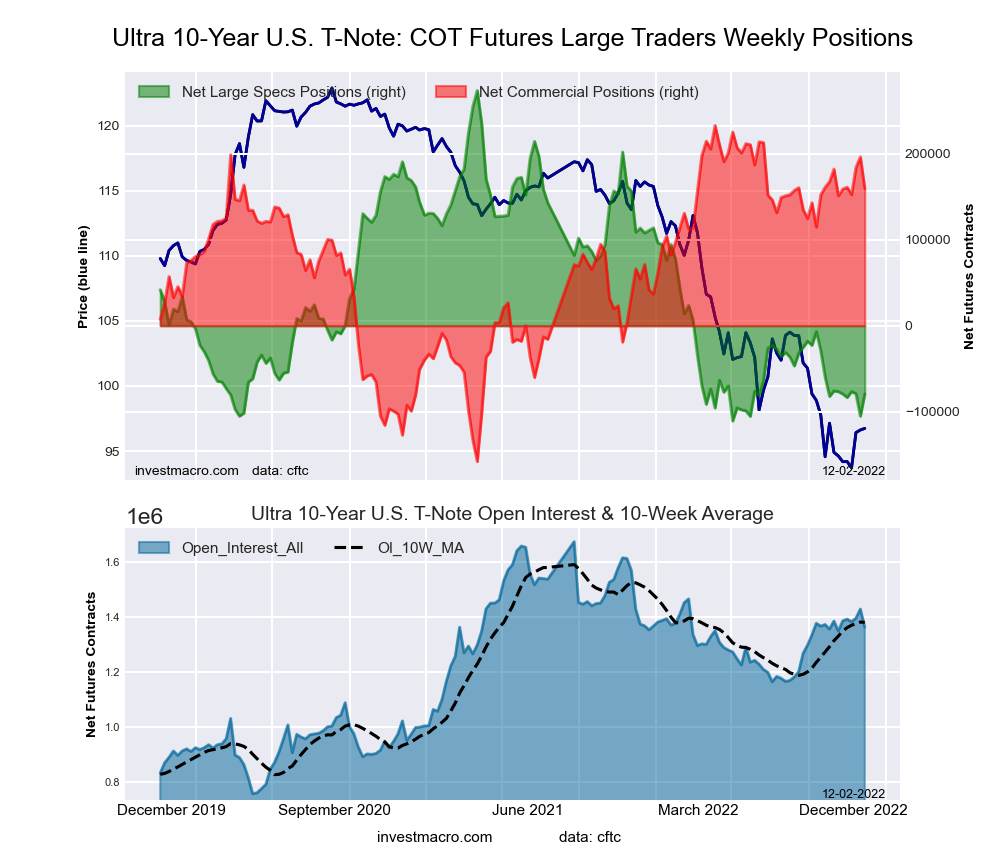 The Ultra 10-Year Notes large speculator standing this week came in at a net position of -79,249 contracts in the data reported through Tuesday. This was a weekly gain of 25,883 contracts from the previous week which had a total of -105,132 net contracts.
This week’s current strength score (the trader positioning range over the past three years, measured from 0 to 100) shows the speculators are currently Bearish-Extreme with a score of 8.2 percent. The commercials are Bullish-Extreme with a score of 81.2 percent and the small traders (not shown in chart) are Bullish with a score of 73.7 percent.
| Ultra 10-Year Notes Statistics | SPECULATORS | COMMERCIALS | SMALL TRADERS |
| – Percent of Open Interest Longs: | 10.5 | 77.0 | 11.7 |
| – Percent of Open Interest Shorts: | 16.3 | 65.3 | 17.6 |
| – Net Position: | -79,249 | 159,553 | -80,304 |
| – Gross Longs: | 142,588 | 1,050,386 | 159,395 |
| – Gross Shorts: | 221,837 | 890,833 | 239,699 |
| – Long to Short Ratio: | 0.6 to 1 | 1.2 to 1 | 0.7 to 1 |
| NET POSITION TREND: | |||
| – Strength Index Score (3 Year Range Pct): | 8.2 | 81.2 | 73.7 |
| – Strength Index Reading (3 Year Range): | Bearish-Extreme | Bullish-Extreme | Bullish |
| NET POSITION MOVEMENT INDEX: | |||
| – 6-Week Change in Strength Index: | -0.7 | 2.1 | -3.7 |
US Treasury Bonds Futures:
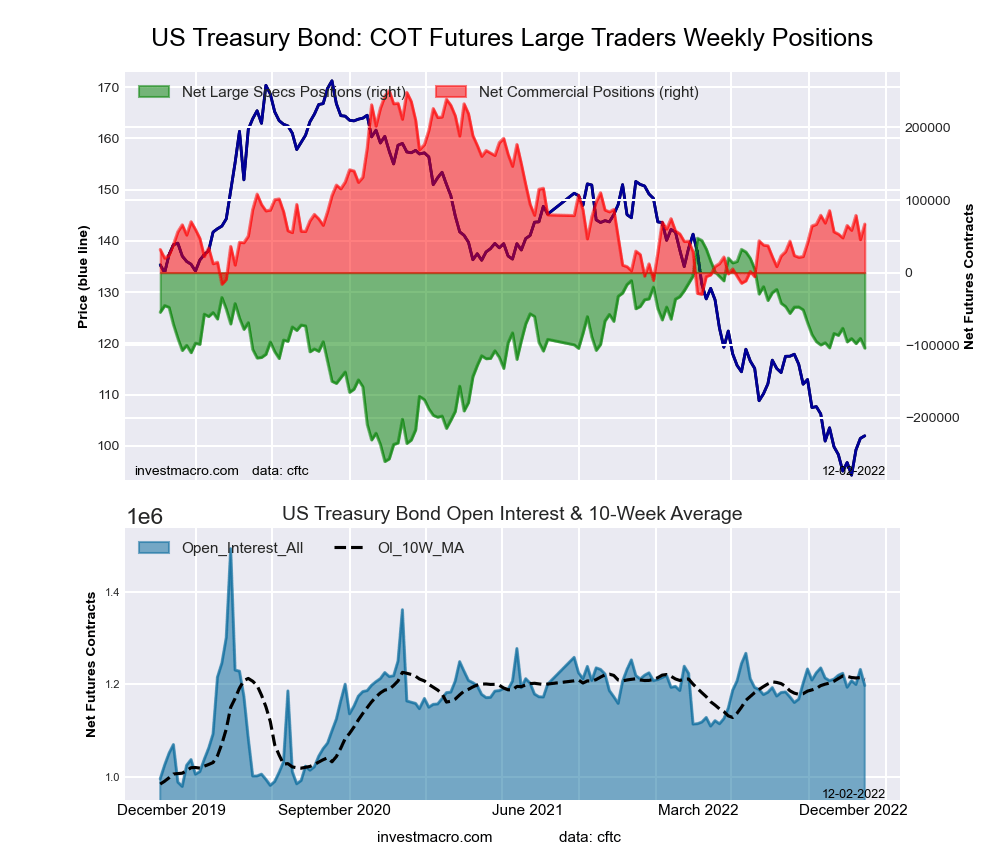 The US Treasury Bonds large speculator standing this week came in at a net position of -103,917 contracts in the data reported through Tuesday. This was a weekly decrease of -13,433 contracts from the previous week which had a total of -90,484 net contracts.
This week’s current strength score (the trader positioning range over the past three years, measured from 0 to 100) shows the speculators are currently Bullish with a score of 50.8 percent. The commercials are Bearish with a score of 34.4 percent and the small traders (not shown in chart) are Bullish-Extreme with a score of 82.0 percent.
| US Treasury Bonds Statistics | SPECULATORS | COMMERCIALS | SMALL TRADERS |
| – Percent of Open Interest Longs: | 4.0 | 78.8 | 15.2 |
| – Percent of Open Interest Shorts: | 12.6 | 73.2 | 12.1 |
| – Net Position: | -103,917 | 66,851 | 37,066 |
| – Gross Longs: | 47,371 | 943,291 | 182,448 |
| – Gross Shorts: | 151,288 | 876,440 | 145,382 |
| – Long to Short Ratio: | 0.3 to 1 | 1.1 to 1 | 1.3 to 1 |
| NET POSITION TREND: | |||
| – Strength Index Score (3 Year Range Pct): | 50.8 | 34.4 | 82.0 |
| – Strength Index Reading (3 Year Range): | Bullish | Bearish | Bullish-Extreme |
| NET POSITION MOVEMENT INDEX: | |||
| – 6-Week Change in Strength Index: | -5.7 | 4.9 | 3.1 |
Ultra US Treasury Bonds Futures:
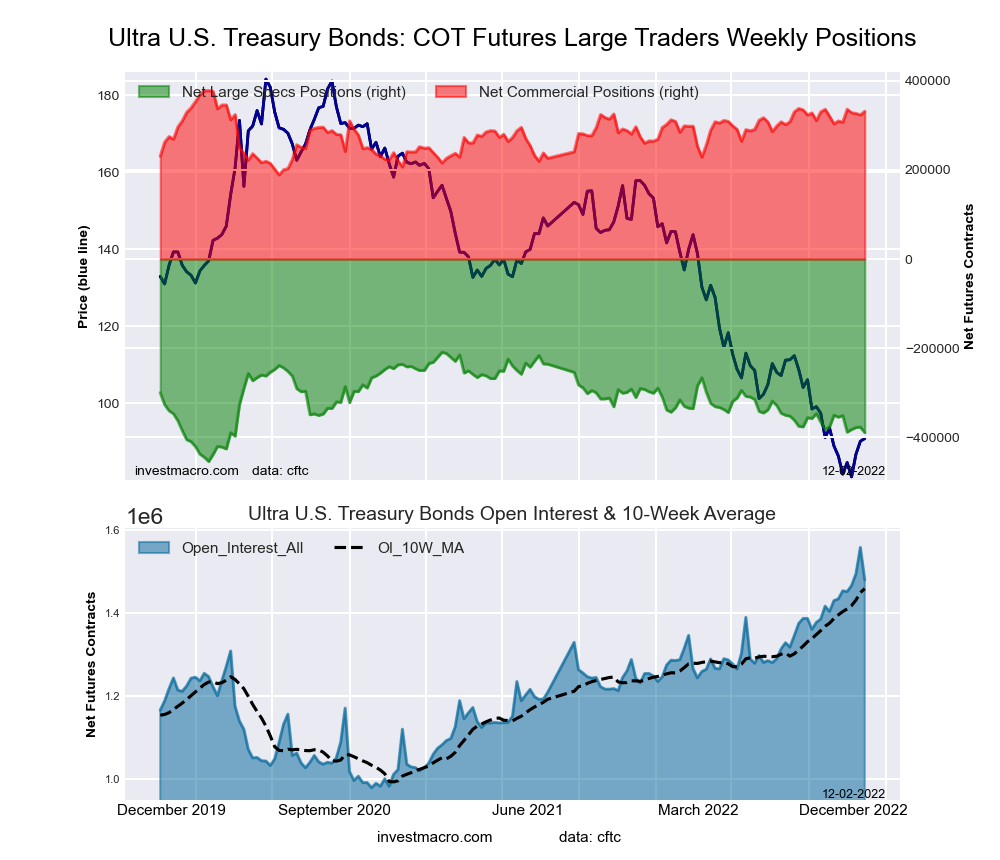 The Ultra US Treasury Bonds large speculator standing this week came in at a net position of -389,404 contracts in the data reported through Tuesday. This was a weekly lowering of -12,393 contracts from the previous week which had a total of -377,011 net contracts.
This week’s current strength score (the trader positioning range over the past three years, measured from 0 to 100) shows the speculators are currently Bearish with a score of 26.3 percent. The commercials are Bullish with a score of 75.4 percent and the small traders (not shown in chart) are Bullish with a score of 79.4 percent.
| Ultra US Treasury Bonds Statistics | SPECULATORS | COMMERCIALS | SMALL TRADERS |
| – Percent of Open Interest Longs: | 4.1 | 82.7 | 11.9 |
| – Percent of Open Interest Shorts: | 30.4 | 60.3 | 8.0 |
| – Net Position: | -389,404 | 331,412 | 57,992 |
| – Gross Longs: | 60,228 | 1,222,893 | 175,631 |
| – Gross Shorts: | 449,632 | 891,481 | 117,639 |
| – Long to Short Ratio: | 0.1 to 1 | 1.4 to 1 | 1.5 to 1 |
| NET POSITION TREND: | |||
| – Strength Index Score (3 Year Range Pct): | 26.3 | 75.4 | 79.4 |
| – Strength Index Reading (3 Year Range): | Bearish | Bullish | Bullish |
| NET POSITION MOVEMENT INDEX: | |||
| – 6-Week Change in Strength Index: | -14.2 | 11.5 | 10.7 |
Article By InvestMacro – Receive our weekly COT Newsletter
*COT Report: The COT data, released weekly to the public each Friday, is updated through the most recent Tuesday (data is 3 days old) and shows a quick view of how large speculators or non-commercials (for-profit traders) were positioned in the futures markets.
The CFTC categorizes trader positions according to commercial hedgers (traders who use futures contracts for hedging as part of the business), non-commercials (large traders who speculate to realize trading profits) and nonreportable traders (usually small traders/speculators) as well as their open interest (contracts open in the market at time of reporting). See CFTC criteria here.

- Geopolitical and macroeconomic conditions continue to pressure market sentiment Jul 20, 2026
- USD/JPY Poised to Continue Gains as Expensive Oil and Lack of Support Weigh on Yen Jul 20, 2026
- COT Metals Charts: Weekly Speculator Bets led by Copper & Steel Jul 18, 2026
- COT Bonds Charts: Weekly Speculator Bets led by 2-Year, SOFR 3M & 5-Year Bonds Jul 18, 2026
- COT Energy Charts: Weekly Speculator Bets led by Brent Oil & Heating Oil Jul 18, 2026
- COT Soft Commodities Charts: Weekly Speculator Bets led by Wheat, Corn & Soybean Meal Jul 18, 2026
- The Bank of Canada kept its interest rate unchanged. Platinum prices reached a three‑week high Jul 16, 2026
- Stock indices rose after the release of US inflation data. China’s GDP slowed sharply Jul 15, 2026
- GBP/USD Awaits Political News: What Will Happen Next Jul 15, 2026
- USD/JPY Holds at Highs: Pressure Lingers on Yen Jul 14, 2026