
By InvestMacro
Here are the latest charts and statistics for the Commitment of Traders (COT) reports data published by the Commodities Futures Trading Commission (CFTC).
The latest COT data is updated through Tuesday November 29th and shows a quick view of how large traders (for-profit speculators and commercial entities) were positioned in the futures markets.
Weekly Speculator Changes led by Corn & Soybeans
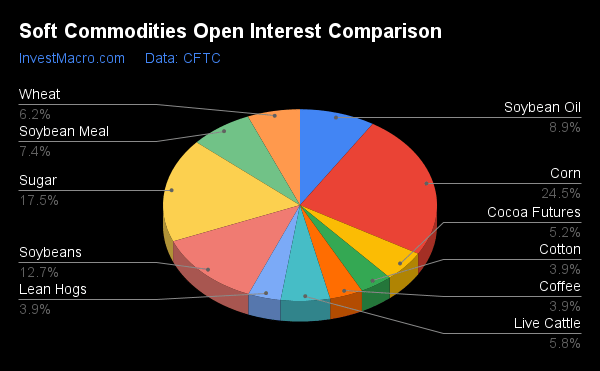
The COT soft commodities speculator bets were slightly lower this week as five out of the eleven soft commodities markets we cover had higher positioning this week while the other six markets had decreases in contracts.
Free Reports:
 Get our Weekly Commitment of Traders Reports - See where the biggest traders (Hedge Funds and Commercial Hedgers) are positioned in the futures markets on a weekly basis.
 Download Our Metatrader 4 Indicators – Put Our Free MetaTrader 4 Custom Indicators on your charts when you join our Weekly Newsletter
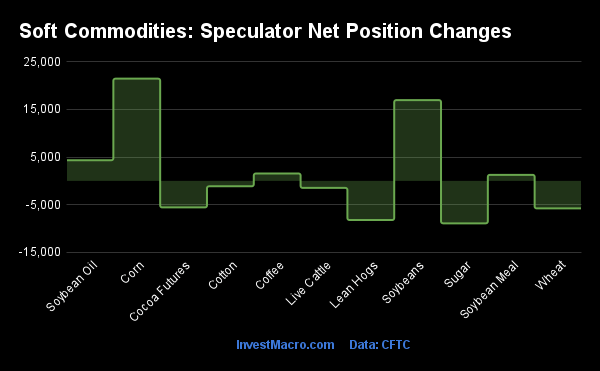
Leading the gains for soft commodities markets was Corn (21,477 contracts) with Soybeans (16,969 contracts), Soybean Oil (4,333 contracts), Coffee (1,550 contracts) and Soybean Meal (1,269 contracts) also showing positive weeks.
The softs market leading the declines in speculator bets this week was Sugar (-8,927 contracts) with Lean Hogs (-8,233 contracts), Wheat (-5,787 contracts), Cocoa (-5,586 contracts), Live Cattle (-1,481 contracts) and Cotton (-1,143 contracts) also registering lower bets on the week.
Highlighting the COT soft commodities data this week is the continued decline in Cotton‘s speculator positioning. The large speculator bets for Cotton have declined for three straight weeks and in twelve out of the past thirteen weeks. Overall, Cotton bets have dropped by a total of -35,187 contracts in the past thirteen weeks going from a standing of +51,767 total net contracts on August 30th to just +16,580 total net contracts this week.
Cotton futures prices have been in sharp retreat since late-August as well. The front-month futures price settled on Friday at just over $83.00 which is down almost 30 percent from August 30th. Cotton prices are also down by approximately 47 percent from the 2022 high-point reached in early May at over $155.95.
| Nov-29-2022 | OI | OI-Index | Spec-Net | Spec-Index | Com-Net | COM-Index | Smalls-Net | Smalls-Index |
|---|---|---|---|---|---|---|---|---|
| WTI Crude | 1,412,121 | 1 | 239,739 | 8 | -262,654 | 93 | 22,915 | 37 |
| Gold | 433,661 | 1 | 110,003 | 19 | -119,233 | 82 | 9,230 | 3 |
| Silver | 121,258 | 0 | 17,483 | 33 | -28,997 | 68 | 11,514 | 26 |
| Copper | 146,760 | 0 | 1,984 | 38 | -3,362 | 64 | 1,378 | 33 |
| Palladium | 7,537 | 8 | -1,631 | 14 | 1,687 | 84 | -56 | 38 |
| Platinum | 66,468 | 33 | 24,259 | 42 | -28,762 | 60 | 4,503 | 28 |
| Natural Gas | 985,010 | 7 | -163,429 | 30 | 136,191 | 74 | 27,238 | 45 |
| Brent | 155,500 | 15 | -32,087 | 57 | 29,424 | 42 | 2,663 | 45 |
| Heating Oil | 266,829 | 23 | 30,733 | 88 | -48,255 | 20 | 17,522 | 59 |
| Soybeans | 634,754 | 13 | 87,208 | 40 | -61,551 | 68 | -25,657 | 28 |
| Corn | 1,226,410 | 0 | 270,242 | 65 | -231,169 | 39 | -39,073 | 21 |
| Coffee | 196,365 | 9 | -14,636 | 2 | 13,695 | 99 | 941 | 12 |
| Sugar | 876,309 | 34 | 179,035 | 56 | -222,607 | 39 | 43,572 | 62 |
| Wheat | 310,667 | 10 | -33,305 | 0 | 37,024 | 100 | -3,719 | 91 |
Soybean Meal tops Strength Scores
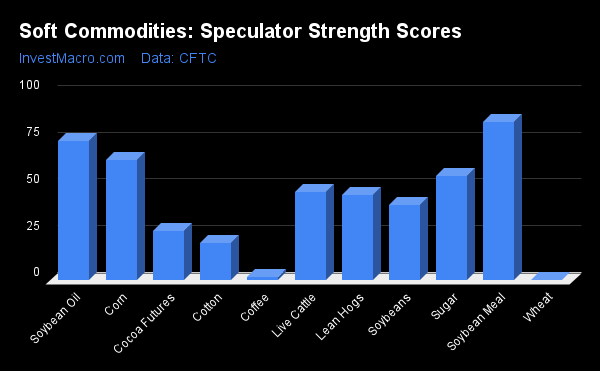
Strength Scores (a normalized measure of Speculator positions over a 3-Year range, from 0 to 100 where above 80 is extreme bullish and below 20 is extreme bearish) showed that Soybean Meal (84.5 percent) and Soybean Oil (74.3 percent) lead the soft commodity markets with Soybean Meal residing in a bullish extreme position (above 80 percent). Corn (64.6 percent) and Sugar (55.6 percent) come in as the next highest soft commodity markets in strength scores.
On the downside, Wheat (0.0 percent), Coffee (1.8 percent) and Cotton (19.9 percent) come in at the lowest strength level currently and are all in bearish extreme levels (below 20 percent).
Strength Statistics:
Corn (64.6 percent) vs Corn previous week (61.8 percent)
Sugar (55.6 percent) vs Sugar previous week (58.6 percent)
Coffee (1.8 percent) vs Coffee previous week (0.0 percent)
Soybeans (40.1 percent) vs Soybeans previous week (34.9 percent)
Soybean Oil (74.3 percent) vs Soybean Oil previous week (71.4 percent)
Soybean Meal (84.5 percent) vs Soybean Meal previous week (83.7 percent)
Live Cattle (47.1 percent) vs Live Cattle previous week (49.0 percent)
Lean Hogs (45.4 percent) vs Lean Hogs previous week (54.4 percent)
Cotton (19.9 percent) vs Cotton previous week (20.8 percent)
Cocoa (26.4 percent) vs Cocoa previous week (32.0 percent)
Wheat (0.0 percent) vs Wheat previous week (6.1 percent)
Strength Trends led Soybean Oil & Sugar
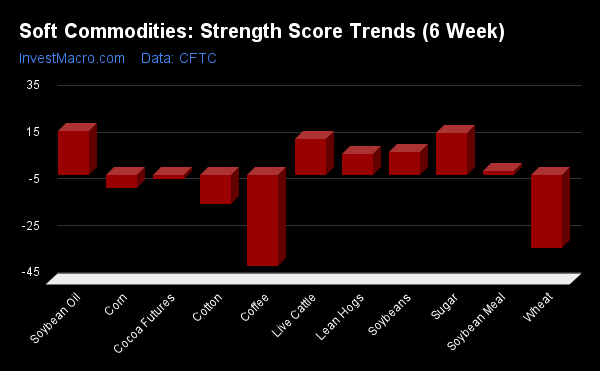
Strength Score Trends (or move index, calculates the 6-week changes in strength scores) showed that Soybean Oil (18.9 percent) and Sugar (18.1 percent) lead the past six weeks trends for soft commodity markets this week. Live Cattle (15.5 percent), Soybeans (10.0 percent) and Lean Hogs (9.2 percent) fill out the top movers in the latest trends data.
Coffee (-38.9 percent), Wheat (-31.2 percent) and Cotton (-12.2 percent) lead the downside trend scores currently.
Strength Trend Statistics:
Corn (-5.4 percent) vs Corn previous week (-9.8 percent)
Sugar (18.1 percent) vs Sugar previous week (29.8 percent)
Coffee (-38.9 percent) vs Coffee previous week (-65.2 percent)
Soybeans (10.0 percent) vs Soybeans previous week (4.4 percent)
Soybean Oil (18.9 percent) vs Soybean Oil previous week (28.6 percent)
Soybean Meal (1.8 percent) vs Soybean Meal previous week (2.5 percent)
Live Cattle (15.5 percent) vs Live Cattle previous week (19.9 percent)
Lean Hogs (9.2 percent) vs Lean Hogs previous week (26.8 percent)
Cotton (-12.2 percent) vs Cotton previous week (-13.9 percent)
Cocoa (-1.5 percent) vs Cocoa previous week (1.6 percent)
Wheat (-31.2 percent) vs Wheat previous week (-26.7 percent)
Individual Soft Commodities Markets:
CORN Futures:
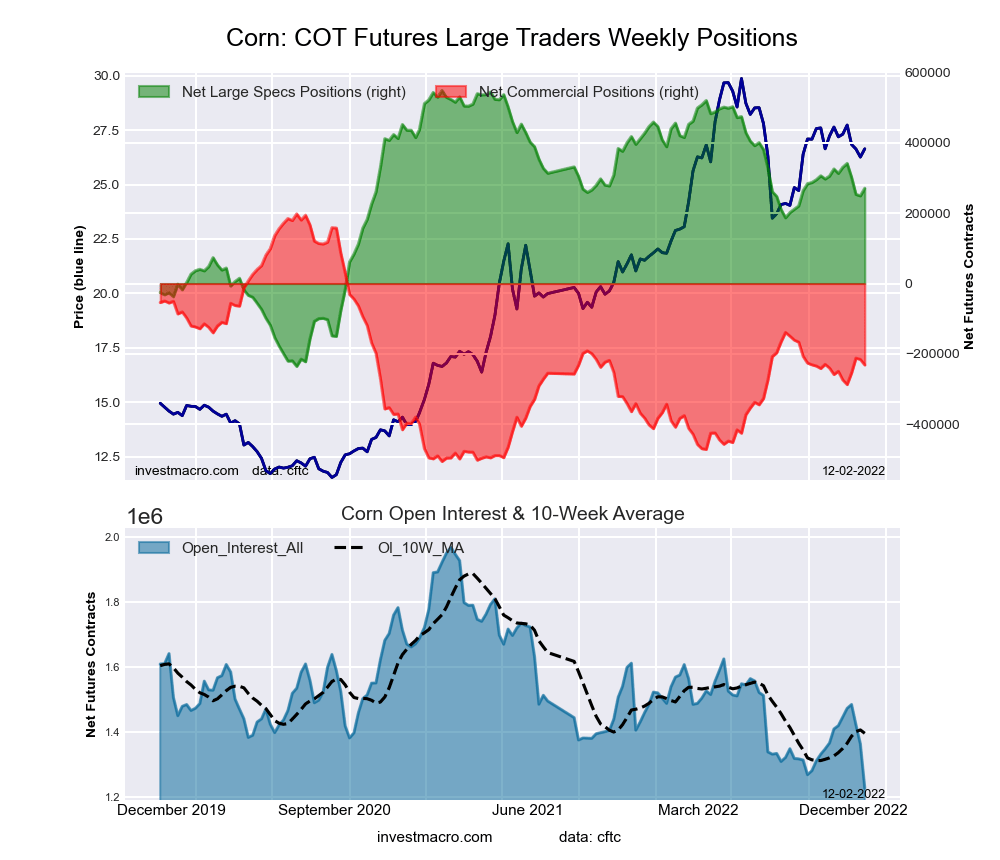 The CORN large speculator standing this week totaled a net position of 270,242 contracts in the data reported through Tuesday. This was a weekly increase of 21,477 contracts from the previous week which had a total of 248,765 net contracts.
This week’s current strength score (the trader positioning range over the past three years, measured from 0 to 100) shows the speculators are currently Bullish with a score of 64.6 percent. The commercials are Bearish with a score of 39.0 percent and the small traders (not shown in chart) are Bearish with a score of 20.6 percent.
| CORN Futures Statistics | SPECULATORS | COMMERCIALS | SMALL TRADERS |
| – Percent of Open Interest Longs: | 29.4 | 45.1 | 10.0 |
| – Percent of Open Interest Shorts: | 7.3 | 63.9 | 13.2 |
| – Net Position: | 270,242 | -231,169 | -39,073 |
| – Gross Longs: | 360,350 | 552,816 | 122,723 |
| – Gross Shorts: | 90,108 | 783,985 | 161,796 |
| – Long to Short Ratio: | 4.0 to 1 | 0.7 to 1 | 0.8 to 1 |
| NET POSITION TREND: | |||
| – Strength Index Score (3 Year Range Pct): | 64.6 | 39.0 | 20.6 |
| – Strength Index Reading (3 Year Range): | Bullish | Bearish | Bearish |
| NET POSITION MOVEMENT INDEX: | |||
| – 6-Week Change in Strength Index: | -5.4 | 2.6 | 13.9 |
SUGAR Futures:
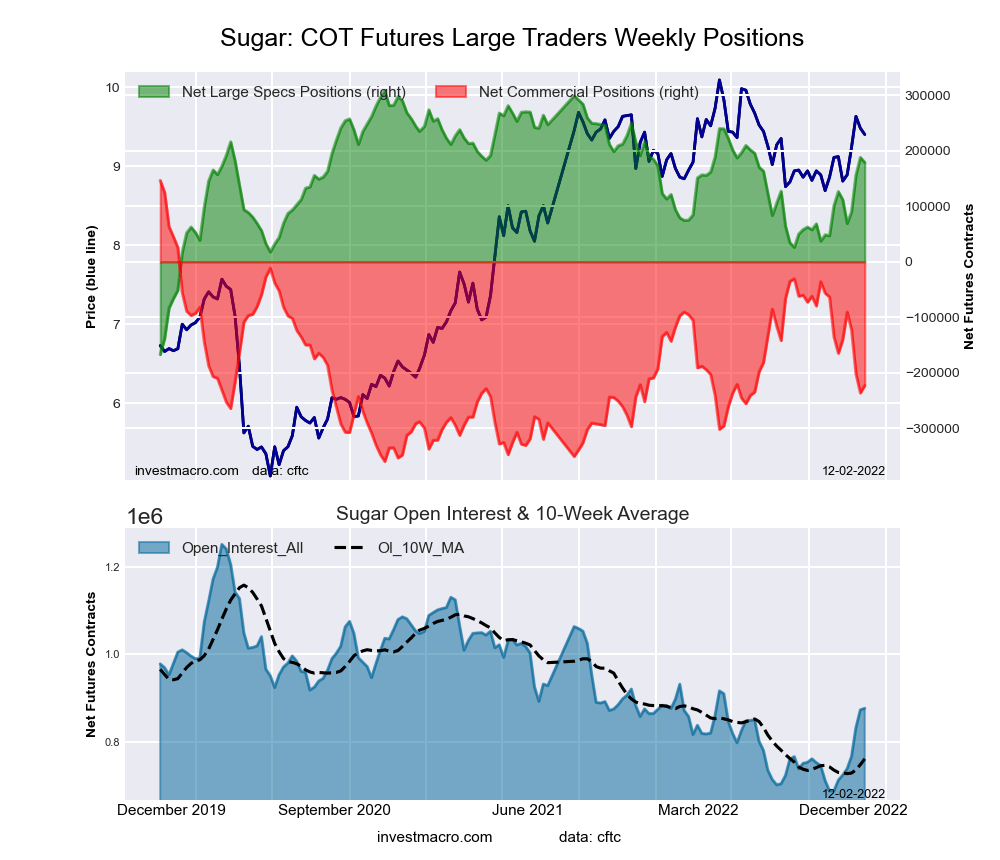 The SUGAR large speculator standing this week totaled a net position of 179,035 contracts in the data reported through Tuesday. This was a weekly reduction of -8,927 contracts from the previous week which had a total of 187,962 net contracts.
This week’s current strength score (the trader positioning range over the past three years, measured from 0 to 100) shows the speculators are currently Bullish with a score of 55.6 percent. The commercials are Bearish with a score of 39.3 percent and the small traders (not shown in chart) are Bullish with a score of 61.7 percent.
| SUGAR Futures Statistics | SPECULATORS | COMMERCIALS | SMALL TRADERS |
| – Percent of Open Interest Longs: | 32.3 | 45.2 | 10.7 |
| – Percent of Open Interest Shorts: | 11.8 | 70.6 | 5.8 |
| – Net Position: | 179,035 | -222,607 | 43,572 |
| – Gross Longs: | 282,793 | 396,433 | 94,194 |
| – Gross Shorts: | 103,758 | 619,040 | 50,622 |
| – Long to Short Ratio: | 2.7 to 1 | 0.6 to 1 | 1.9 to 1 |
| NET POSITION TREND: | |||
| – Strength Index Score (3 Year Range Pct): | 55.6 | 39.3 | 61.7 |
| – Strength Index Reading (3 Year Range): | Bullish | Bearish | Bullish |
| NET POSITION MOVEMENT INDEX: | |||
| – 6-Week Change in Strength Index: | 18.1 | -16.6 | 6.6 |
COFFEE Futures:
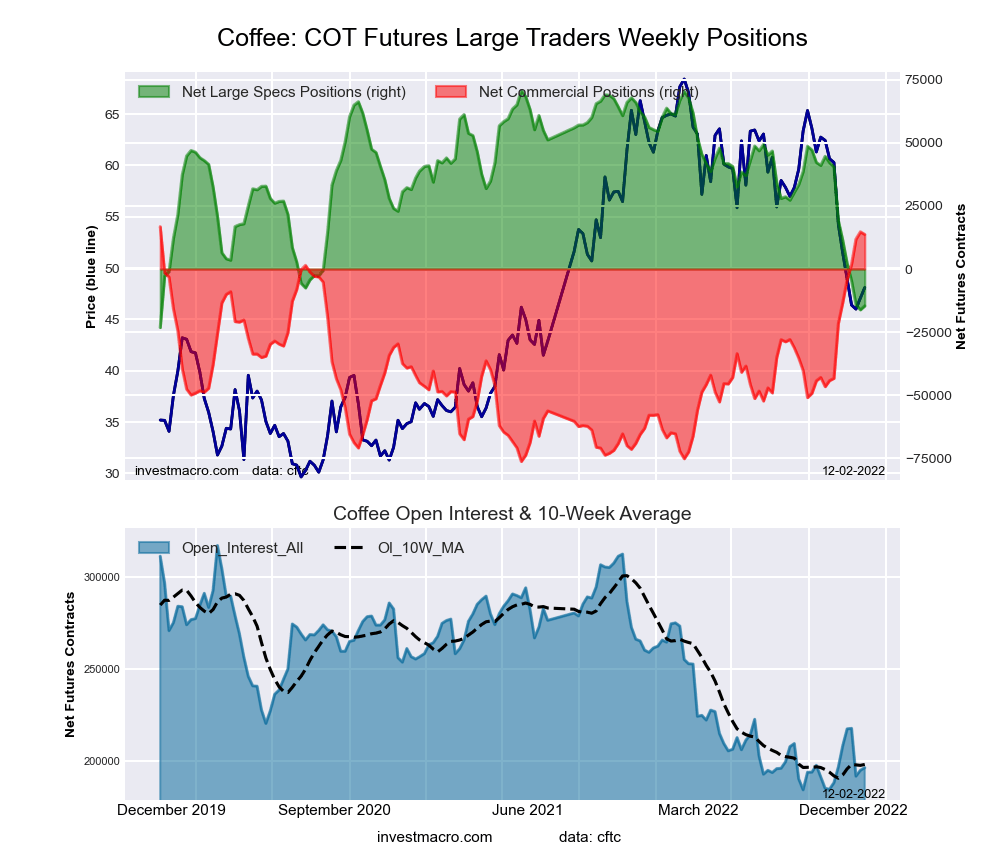 The COFFEE large speculator standing this week totaled a net position of -14,636 contracts in the data reported through Tuesday. This was a weekly advance of 1,550 contracts from the previous week which had a total of -16,186 net contracts.
This week’s current strength score (the trader positioning range over the past three years, measured from 0 to 100) shows the speculators are currently Bearish-Extreme with a score of 1.8 percent. The commercials are Bullish-Extreme with a score of 98.8 percent and the small traders (not shown in chart) are Bearish-Extreme with a score of 12.5 percent.
| COFFEE Futures Statistics | SPECULATORS | COMMERCIALS | SMALL TRADERS |
| – Percent of Open Interest Longs: | 18.2 | 56.0 | 4.6 |
| – Percent of Open Interest Shorts: | 25.7 | 49.1 | 4.1 |
| – Net Position: | -14,636 | 13,695 | 941 |
| – Gross Longs: | 35,834 | 110,025 | 9,075 |
| – Gross Shorts: | 50,470 | 96,330 | 8,134 |
| – Long to Short Ratio: | 0.7 to 1 | 1.1 to 1 | 1.1 to 1 |
| NET POSITION TREND: | |||
| – Strength Index Score (3 Year Range Pct): | 1.8 | 98.8 | 12.5 |
| – Strength Index Reading (3 Year Range): | Bearish-Extreme | Bullish-Extreme | Bearish-Extreme |
| NET POSITION MOVEMENT INDEX: | |||
| – 6-Week Change in Strength Index: | -38.9 | 38.8 | -20.1 |
SOYBEANS Futures:
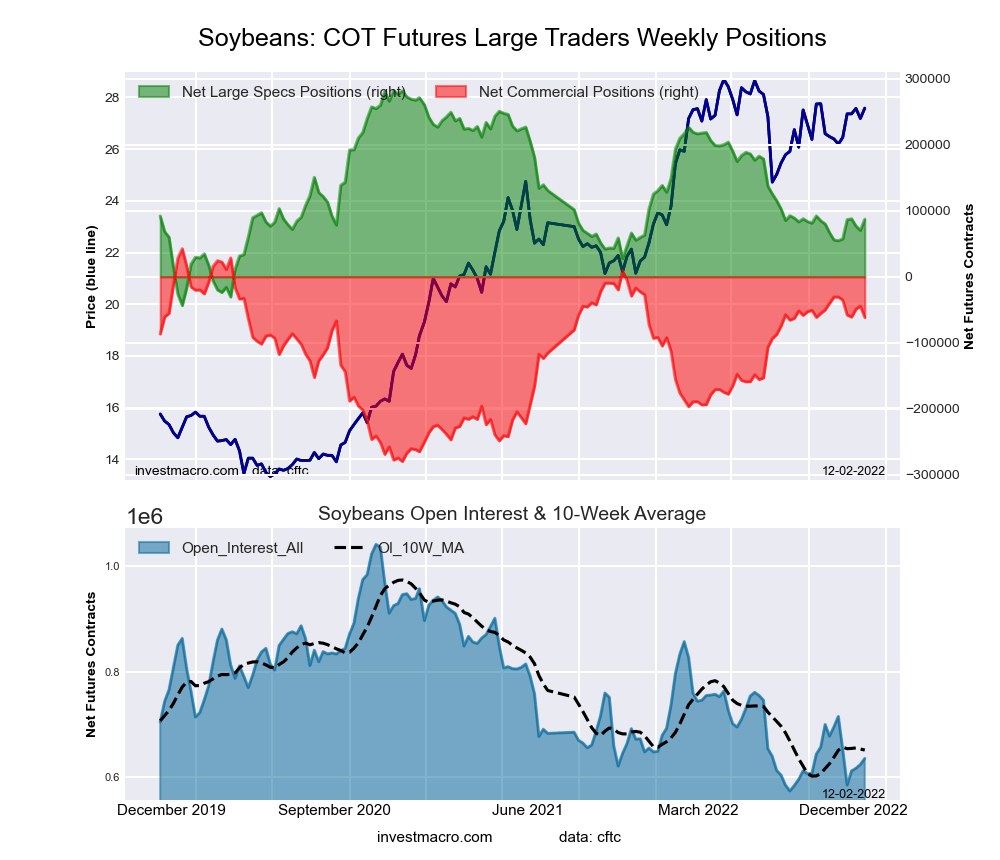 The SOYBEANS large speculator standing this week totaled a net position of 87,208 contracts in the data reported through Tuesday. This was a weekly increase of 16,969 contracts from the previous week which had a total of 70,239 net contracts.
This week’s current strength score (the trader positioning range over the past three years, measured from 0 to 100) shows the speculators are currently Bearish with a score of 40.1 percent. The commercials are Bullish with a score of 67.7 percent and the small traders (not shown in chart) are Bearish with a score of 27.7 percent.
| SOYBEANS Futures Statistics | SPECULATORS | COMMERCIALS | SMALL TRADERS |
| – Percent of Open Interest Longs: | 23.8 | 50.8 | 7.8 |
| – Percent of Open Interest Shorts: | 10.1 | 60.5 | 11.9 |
| – Net Position: | 87,208 | -61,551 | -25,657 |
| – Gross Longs: | 151,317 | 322,231 | 49,683 |
| – Gross Shorts: | 64,109 | 383,782 | 75,340 |
| – Long to Short Ratio: | 2.4 to 1 | 0.8 to 1 | 0.7 to 1 |
| NET POSITION TREND: | |||
| – Strength Index Score (3 Year Range Pct): | 40.1 | 67.7 | 27.7 |
| – Strength Index Reading (3 Year Range): | Bearish | Bullish | Bearish |
| NET POSITION MOVEMENT INDEX: | |||
| – 6-Week Change in Strength Index: | 10.0 | -9.6 | -2.7 |
SOYBEAN OIL Futures:
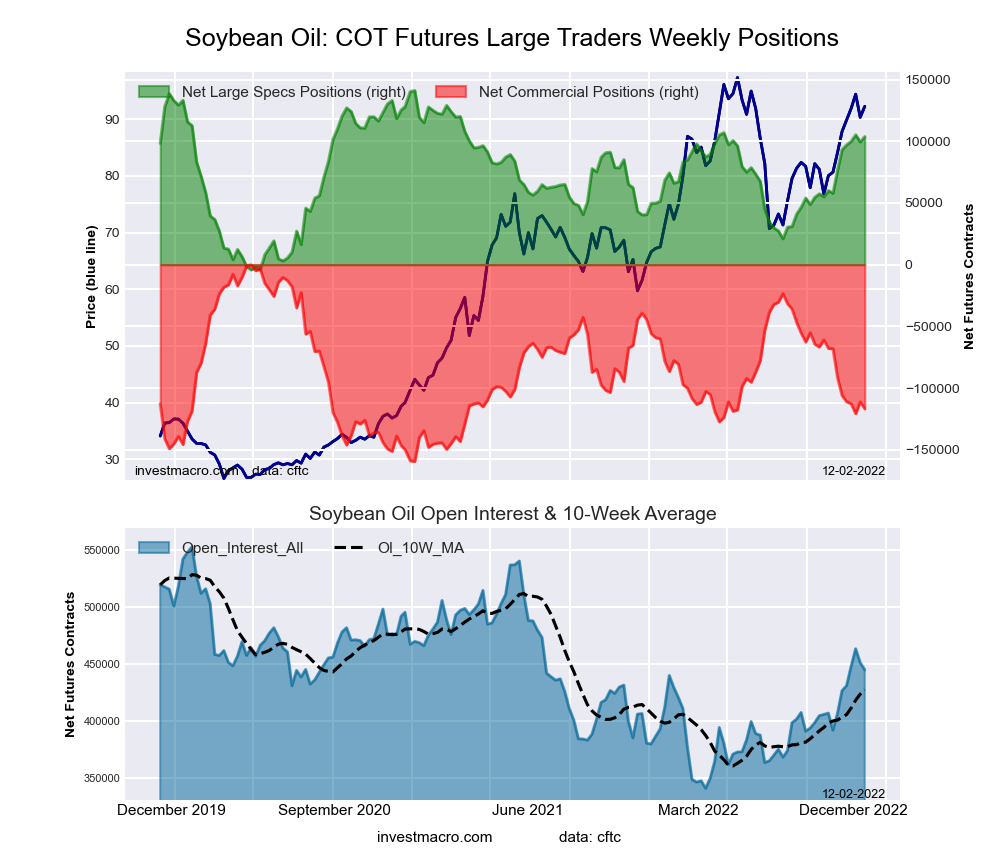 The SOYBEAN OIL large speculator standing this week totaled a net position of 103,854 contracts in the data reported through Tuesday. This was a weekly increase of 4,333 contracts from the previous week which had a total of 99,521 net contracts.
This week’s current strength score (the trader positioning range over the past three years, measured from 0 to 100) shows the speculators are currently Bullish with a score of 74.3 percent. The commercials are Bearish with a score of 26.8 percent and the small traders (not shown in chart) are Bullish with a score of 62.1 percent.
| SOYBEAN OIL Futures Statistics | SPECULATORS | COMMERCIALS | SMALL TRADERS |
| – Percent of Open Interest Longs: | 30.8 | 41.2 | 7.5 |
| – Percent of Open Interest Shorts: | 7.4 | 67.5 | 4.6 |
| – Net Position: | 103,854 | -116,889 | 13,035 |
| – Gross Longs: | 136,812 | 183,315 | 33,560 |
| – Gross Shorts: | 32,958 | 300,204 | 20,525 |
| – Long to Short Ratio: | 4.2 to 1 | 0.6 to 1 | 1.6 to 1 |
| NET POSITION TREND: | |||
| – Strength Index Score (3 Year Range Pct): | 74.3 | 26.8 | 62.1 |
| – Strength Index Reading (3 Year Range): | Bullish | Bearish | Bullish |
| NET POSITION MOVEMENT INDEX: | |||
| – 6-Week Change in Strength Index: | 18.9 | -15.9 | -8.1 |
SOYBEAN MEAL Futures:
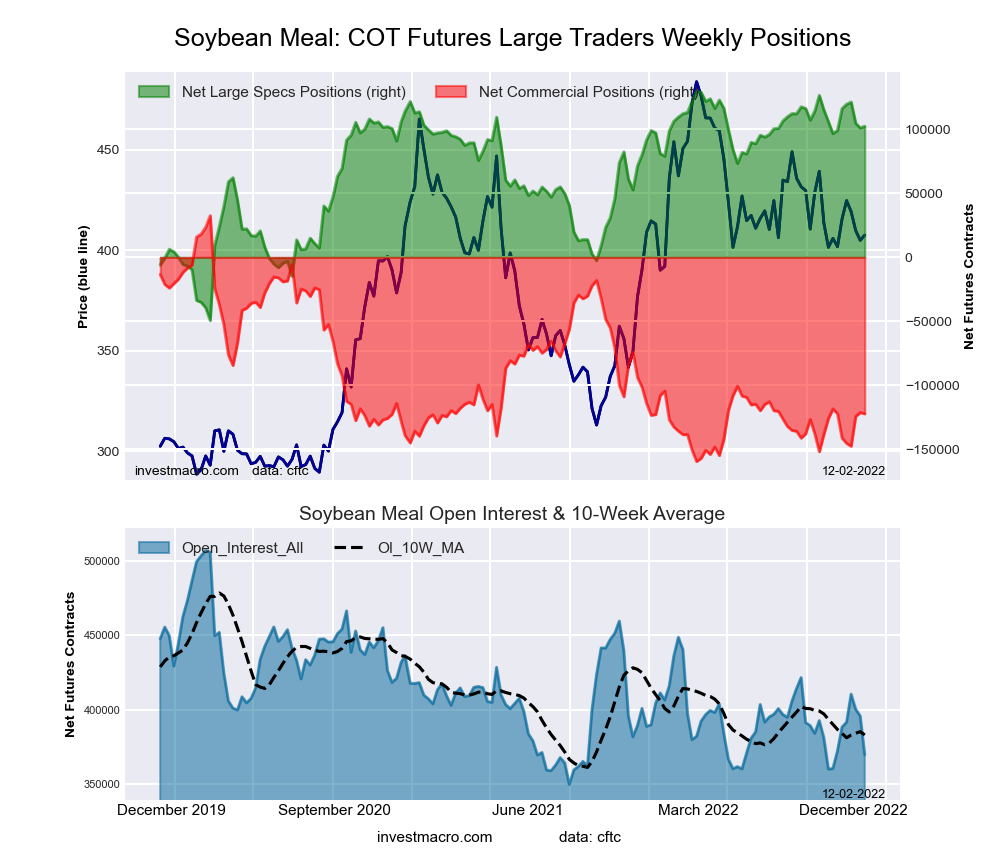 The SOYBEAN MEAL large speculator standing this week totaled a net position of 102,339 contracts in the data reported through Tuesday. This was a weekly advance of 1,269 contracts from the previous week which had a total of 101,070 net contracts.
This week’s current strength score (the trader positioning range over the past three years, measured from 0 to 100) shows the speculators are currently Bullish-Extreme with a score of 84.5 percent. The commercials are Bearish-Extreme with a score of 19.4 percent and the small traders (not shown in chart) are Bearish with a score of 36.1 percent.
| SOYBEAN MEAL Futures Statistics | SPECULATORS | COMMERCIALS | SMALL TRADERS |
| – Percent of Open Interest Longs: | 33.1 | 40.4 | 11.9 |
| – Percent of Open Interest Shorts: | 5.4 | 73.4 | 6.5 |
| – Net Position: | 102,339 | -122,247 | 19,908 |
| – Gross Longs: | 122,479 | 149,139 | 43,937 |
| – Gross Shorts: | 20,140 | 271,386 | 24,029 |
| – Long to Short Ratio: | 6.1 to 1 | 0.5 to 1 | 1.8 to 1 |
| NET POSITION TREND: | |||
| – Strength Index Score (3 Year Range Pct): | 84.5 | 19.4 | 36.1 |
| – Strength Index Reading (3 Year Range): | Bullish-Extreme | Bearish-Extreme | Bearish |
| NET POSITION MOVEMENT INDEX: | |||
| – 6-Week Change in Strength Index: | 1.8 | -0.1 | -15.8 |
LIVE CATTLE Futures:
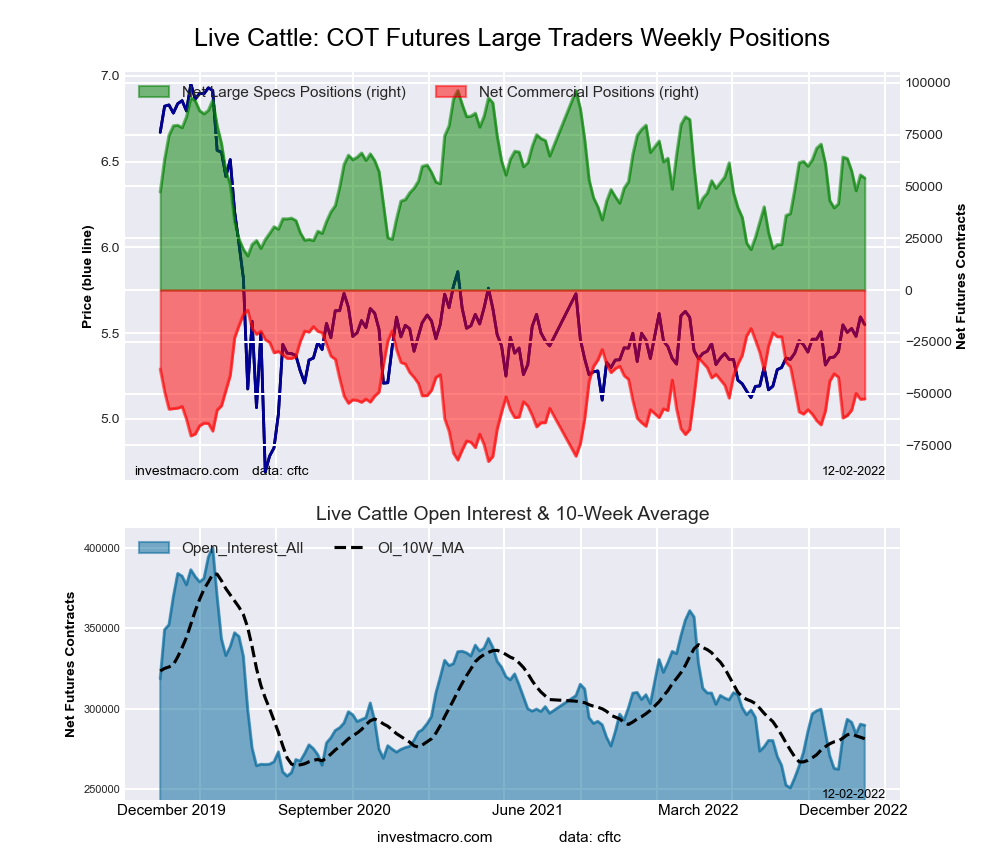 The LIVE CATTLE large speculator standing this week totaled a net position of 54,034 contracts in the data reported through Tuesday. This was a weekly lowering of -1,481 contracts from the previous week which had a total of 55,515 net contracts.
This week’s current strength score (the trader positioning range over the past three years, measured from 0 to 100) shows the speculators are currently Bearish with a score of 47.1 percent. The commercials are Bearish with a score of 41.4 percent and the small traders (not shown in chart) are Bullish-Extreme with a score of 86.5 percent.
| LIVE CATTLE Futures Statistics | SPECULATORS | COMMERCIALS | SMALL TRADERS |
| – Percent of Open Interest Longs: | 36.7 | 33.1 | 11.5 |
| – Percent of Open Interest Shorts: | 18.0 | 51.2 | 12.0 |
| – Net Position: | 54,034 | -52,522 | -1,512 |
| – Gross Longs: | 106,265 | 95,838 | 33,215 |
| – Gross Shorts: | 52,231 | 148,360 | 34,727 |
| – Long to Short Ratio: | 2.0 to 1 | 0.6 to 1 | 1.0 to 1 |
| NET POSITION TREND: | |||
| – Strength Index Score (3 Year Range Pct): | 47.1 | 41.4 | 86.5 |
| – Strength Index Reading (3 Year Range): | Bearish | Bearish | Bullish-Extreme |
| NET POSITION MOVEMENT INDEX: | |||
| – 6-Week Change in Strength Index: | 15.5 | -14.3 | -7.7 |
LEAN HOGS Futures:
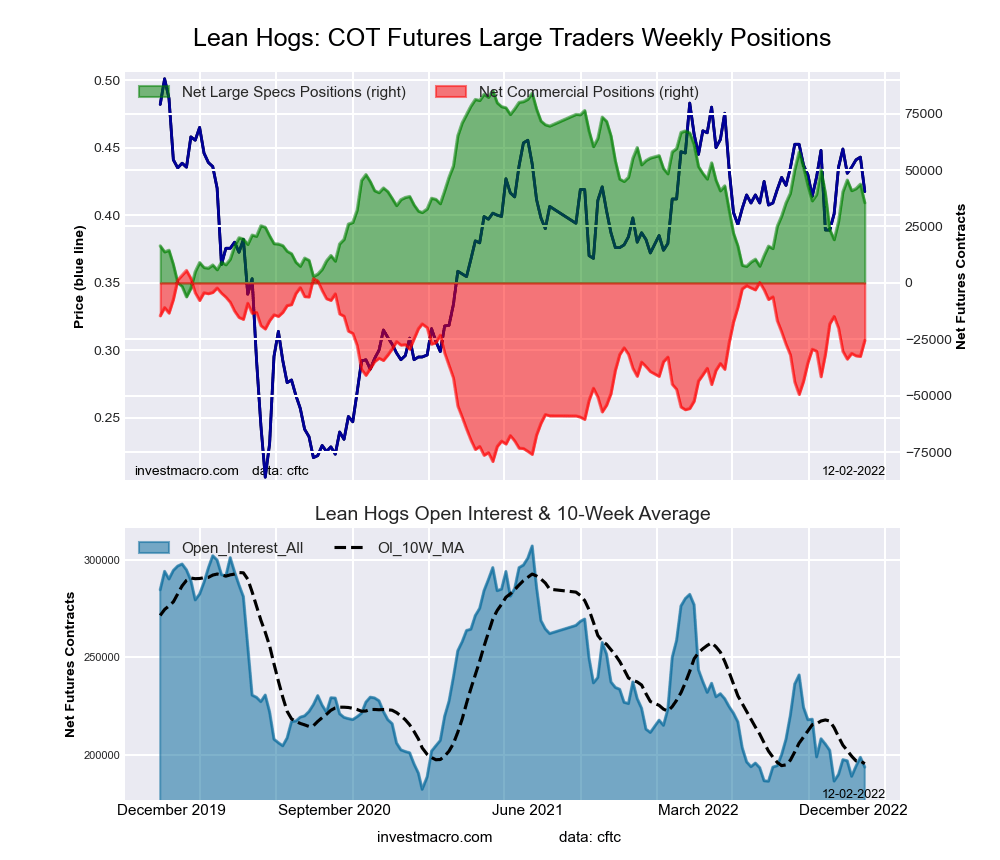 The LEAN HOGS large speculator standing this week totaled a net position of 35,499 contracts in the data reported through Tuesday. This was a weekly decrease of -8,233 contracts from the previous week which had a total of 43,732 net contracts.
This week’s current strength score (the trader positioning range over the past three years, measured from 0 to 100) shows the speculators are currently Bearish with a score of 45.4 percent. The commercials are Bullish with a score of 63.4 percent and the small traders (not shown in chart) are Bearish with a score of 44.5 percent.
| LEAN HOGS Futures Statistics | SPECULATORS | COMMERCIALS | SMALL TRADERS |
| – Percent of Open Interest Longs: | 38.0 | 35.4 | 7.9 |
| – Percent of Open Interest Shorts: | 19.7 | 48.6 | 13.1 |
| – Net Position: | 35,499 | -25,480 | -10,019 |
| – Gross Longs: | 73,573 | 68,586 | 15,357 |
| – Gross Shorts: | 38,074 | 94,066 | 25,376 |
| – Long to Short Ratio: | 1.9 to 1 | 0.7 to 1 | 0.6 to 1 |
| NET POSITION TREND: | |||
| – Strength Index Score (3 Year Range Pct): | 45.4 | 63.4 | 44.5 |
| – Strength Index Reading (3 Year Range): | Bearish | Bullish | Bearish |
| NET POSITION MOVEMENT INDEX: | |||
| – 6-Week Change in Strength Index: | 9.2 | -6.5 | -15.2 |
COTTON Futures:
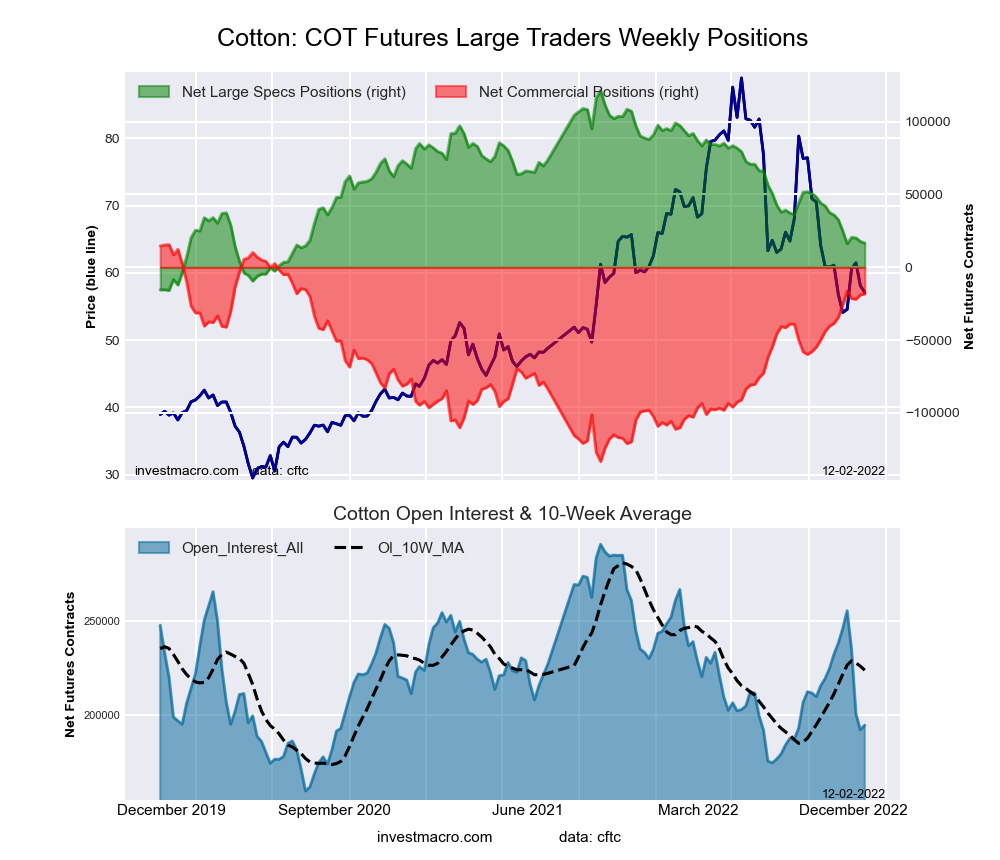 The COTTON large speculator standing this week totaled a net position of 16,580 contracts in the data reported through Tuesday. This was a weekly fall of -1,143 contracts from the previous week which had a total of 17,723 net contracts.
This week’s current strength score (the trader positioning range over the past three years, measured from 0 to 100) shows the speculators are currently Bearish-Extreme with a score of 19.9 percent. The commercials are Bullish-Extreme with a score of 80.3 percent and the small traders (not shown in chart) are Bearish with a score of 20.6 percent.
| COTTON Futures Statistics | SPECULATORS | COMMERCIALS | SMALL TRADERS |
| – Percent of Open Interest Longs: | 32.6 | 47.8 | 6.6 |
| – Percent of Open Interest Shorts: | 24.1 | 57.1 | 5.7 |
| – Net Position: | 16,580 | -18,172 | 1,592 |
| – Gross Longs: | 63,352 | 92,854 | 12,743 |
| – Gross Shorts: | 46,772 | 111,026 | 11,151 |
| – Long to Short Ratio: | 1.4 to 1 | 0.8 to 1 | 1.1 to 1 |
| NET POSITION TREND: | |||
| – Strength Index Score (3 Year Range Pct): | 19.9 | 80.3 | 20.6 |
| – Strength Index Reading (3 Year Range): | Bearish-Extreme | Bullish-Extreme | Bearish |
| NET POSITION MOVEMENT INDEX: | |||
| – 6-Week Change in Strength Index: | -12.2 | 11.2 | -0.5 |
COCOA Futures:
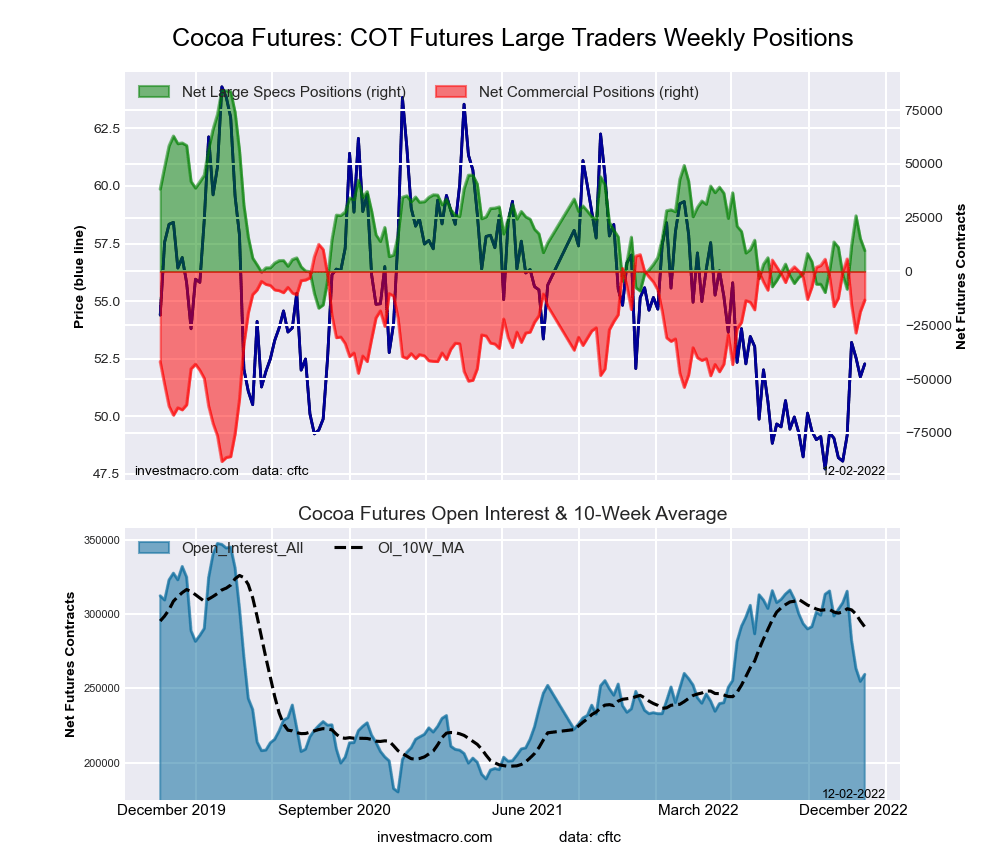 The COCOA large speculator standing this week totaled a net position of 9,698 contracts in the data reported through Tuesday. This was a weekly fall of -5,586 contracts from the previous week which had a total of 15,284 net contracts.
This week’s current strength score (the trader positioning range over the past three years, measured from 0 to 100) shows the speculators are currently Bearish with a score of 26.4 percent. The commercials are Bullish with a score of 74.3 percent and the small traders (not shown in chart) are Bearish with a score of 32.8 percent.
| COCOA Futures Statistics | SPECULATORS | COMMERCIALS | SMALL TRADERS |
| – Percent of Open Interest Longs: | 31.1 | 47.7 | 4.4 |
| – Percent of Open Interest Shorts: | 27.4 | 52.8 | 3.0 |
| – Net Position: | 9,698 | -13,322 | 3,624 |
| – Gross Longs: | 80,762 | 123,639 | 11,404 |
| – Gross Shorts: | 71,064 | 136,961 | 7,780 |
| – Long to Short Ratio: | 1.1 to 1 | 0.9 to 1 | 1.5 to 1 |
| NET POSITION TREND: | |||
| – Strength Index Score (3 Year Range Pct): | 26.4 | 74.3 | 32.8 |
| – Strength Index Reading (3 Year Range): | Bearish | Bullish | Bearish |
| NET POSITION MOVEMENT INDEX: | |||
| – 6-Week Change in Strength Index: | -1.5 | -0.9 | 24.0 |
WHEAT Futures:
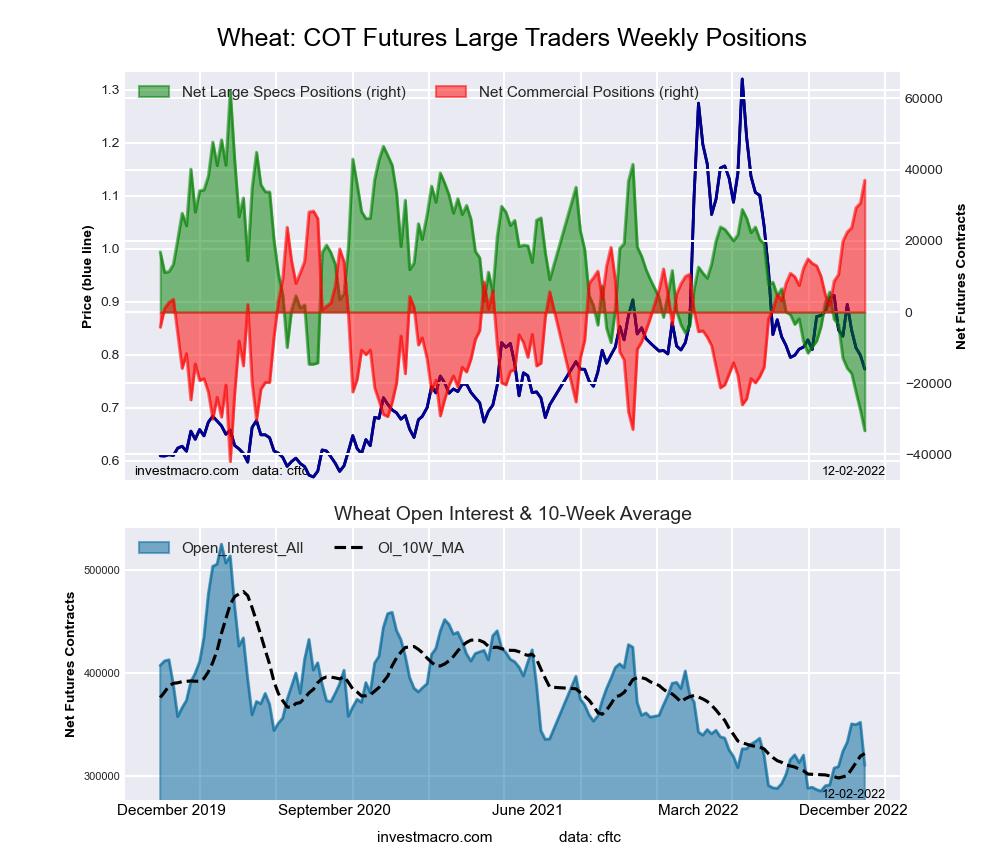 The WHEAT large speculator standing this week totaled a net position of -33,305 contracts in the data reported through Tuesday. This was a weekly lowering of -5,787 contracts from the previous week which had a total of -27,518 net contracts.
This week’s current strength score (the trader positioning range over the past three years, measured from 0 to 100) shows the speculators are currently Bearish-Extreme with a score of 0.0 percent. The commercials are Bullish-Extreme with a score of 100.0 percent and the small traders (not shown in chart) are Bullish-Extreme with a score of 91.1 percent.
| WHEAT Futures Statistics | SPECULATORS | COMMERCIALS | SMALL TRADERS |
| – Percent of Open Interest Longs: | 28.3 | 42.1 | 10.2 |
| – Percent of Open Interest Shorts: | 39.0 | 30.2 | 11.4 |
| – Net Position: | -33,305 | 37,024 | -3,719 |
| – Gross Longs: | 87,807 | 130,938 | 31,815 |
| – Gross Shorts: | 121,112 | 93,914 | 35,534 |
| – Long to Short Ratio: | 0.7 to 1 | 1.4 to 1 | 0.9 to 1 |
| NET POSITION TREND: | |||
| – Strength Index Score (3 Year Range Pct): | 0.0 | 100.0 | 91.1 |
| – Strength Index Reading (3 Year Range): | Bearish-Extreme | Bullish-Extreme | Bullish-Extreme |
| NET POSITION MOVEMENT INDEX: | |||
| – 6-Week Change in Strength Index: | -31.2 | 33.5 | 17.0 |
Article By InvestMacro – Receive our weekly COT Newsletter
*COT Report: The COT data, released weekly to the public each Friday, is updated through the most recent Tuesday (data is 3 days old) and shows a quick view of how large speculators or non-commercials (for-profit traders) were positioned in the futures markets.
The CFTC categorizes trader positions according to commercial hedgers (traders who use futures contracts for hedging as part of the business), non-commercials (large traders who speculate to realize trading profits) and nonreportable traders (usually small traders/speculators) as well as their open interest (contracts open in the market at time of reporting). See CFTC criteria here.

- COT Metals Charts: Weekly Speculator Bets led by Copper & Steel Jul 18, 2026
- COT Bonds Charts: Weekly Speculator Bets led by 2-Year, SOFR 3M & 5-Year Bonds Jul 18, 2026
- COT Energy Charts: Weekly Speculator Bets led by Brent Oil & Heating Oil Jul 18, 2026
- COT Soft Commodities Charts: Weekly Speculator Bets led by Wheat, Corn & Soybean Meal Jul 18, 2026
- The Bank of Canada kept its interest rate unchanged. Platinum prices reached a three‑week high Jul 16, 2026
- Stock indices rose after the release of US inflation data. China’s GDP slowed sharply Jul 15, 2026
- GBP/USD Awaits Political News: What Will Happen Next Jul 15, 2026
- USD/JPY Holds at Highs: Pressure Lingers on Yen Jul 14, 2026
- Oil prices jumped 4% amid a new wave of escalation between the US and Iran Jul 13, 2026
- EUR/USD: US Inflation Will Determine Everything Jul 13, 2026