
Expert Adrian Day takes a look at gold and discusses why he thinks a turn is very close. Day also recommends his top stocks to buy if you do not already own.
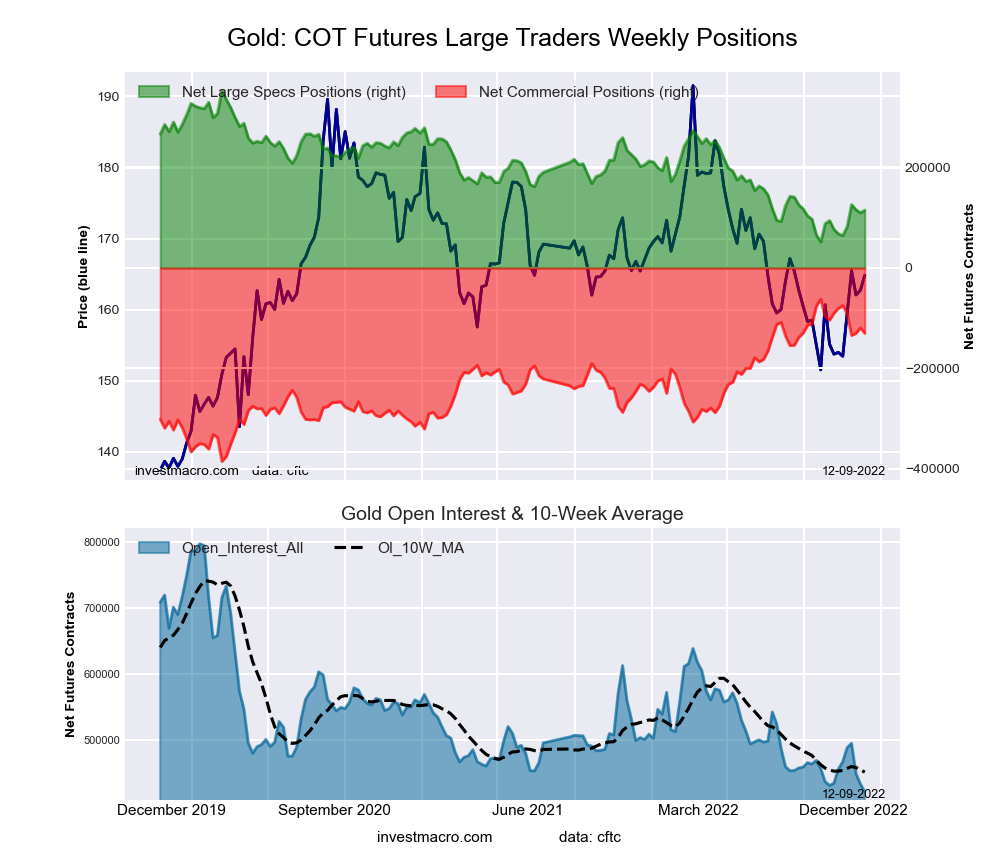
Gold is flirting with US$1,800, and it’s only a matter of time before it breaks through.
Gold shines when the market senses that the central banks will be unable to contain inflation.
Many gold fans believed that this year, with a war in Europe, rising inflation, and a shaky stock market, should have been gold’s year to shine, leaving many disappointed, frustrated, and worse. Gold’s performance should be put in context, however.
Now, as I write, gold is within kissing distance of breaking even (in U.S. dollar terms) for the year, down less than 2% year, while the dollar (per the DXY index) remains up almost 10%.
In addition, in a period of deflating asset prices, gold has held up far better than U.S. and foreign stocks and bonds, as well as other assets such as crypto. This is quite amazing comparative strength for bullion.
Should Investors Be Disappointed in Gold’s Performance This Year?
There are some misunderstandings in the simple narrative that gold “should” be higher.
• Wars or other geopolitical events tend to have only a short-lived effect on the price unless there is concern about it spreading; the Russia-Ukraine conflict has
been contained.
• High inflation in itself is not in fact the main driver of gold, as we shall discuss below.
• And although weak stocks can be positive for gold, much depends on the reasons for the weakness.
Offsetting those ostensibly bullish factors for gold have been two critical negatives: rising interest rates and a strong dollar. For much of the year, a relentlessly strong dollar was a significant headwind for gold, but all along, gold’s decline was meaningfully less than the dollar’s strength.
Inflation Alone Is Not Good for Gold
Inflation itself is not necessarily the optimum environment for gold. Markets, being forward-looking, fear central bank tightening in an inflationary environment. If the market believes that central banks will be able to contain inflation, even as it rages, that is negative for gold.
Gold shines when the market senses that the central banks will be unable to contain inflation.
One only has to look to the inflationary decade of the 1970s to see this. The market did not have confidence that Arthur Burns, as Fed Chairman, would succeed in bringing down inflation.
But far higher inflation under Volker resulted in gold falling because the market believed he would control inflation. The market was correct in both cases.
When Will Gold Move Up?
Since gold’s drop in March, my response to repeated questions about when gold will “finally” respond to inflation has been the same: gold will turn when more investors realize that the Federal Reserve will be unlikely to achieve its 2% inflation goal. Its current policies — the most rapid interest rate appreciation ever — will likely provoke a serious recession, and at that point, it will not follow through and quash inflation.
In short, the market is beginning to sense that the Fed will not be able to bring inflation down towards its target any time soon and certainly will be unable to do so without provoking a recession that could be quite serious.
For most of this year, investors swallowed the Fed narrative; all indicators of inflation expectations, from surveys to markets such as the TIPs, were for inflation to drop significantly next year towards the Fed’s target and for it to happen without a recession. If you believe that, then you do not need gold.
Now, though, expectations are starting to shift. Although inflation expectations two and more years out are still in line with the Fed’s own targets, for next year, investors are forecasting a higher inflation rate than the Fed. And concerns about a recession have increased.
In short, the market is beginning to sense that the Fed will not be able to bring inflation down towards its target any time soon and certainly will be unable to do so without provoking a recession that could be quite serious (though FedHead Jerome Powell still believes a soft landing is possible).
Why a Recession Can Be Good for Gold
Again, since markets are forward-looking, a recession would be positive for gold if the market sees a shift in Fed policy towards easing. The Fed does not have to “pivot” — a misunderstood phenomenon in any event — for gold to move.
The market simply has to believe that the Fed will have to because it will be unable to achieve its inflation goals without a recession. Tough talk from Powell following this week’s final Fed meeting for the year might see gold pullback; that might be our last, best opportunity to load up.
The Economic Pain Is Only Beginning
The signs of an imminent recession are becoming more and more clear if, indeed, the U.S. is not already in one. The Fed recently noted Milton Friedman’s dictum that monetary policy acts with long and variable lags. Indeed, the effects of what the Fed has already done have barely registered so far in the headline numbers.
Even if the Fed were to pause right now, more economic harm is already baked in. Interest rate-sensitive sectors such as housing and automobiles are the first to feel the impact of rising (or indeed declining) rates.
For other sectors, the impact can be delayed, and it can be nine or 18 months before it is clear; meanwhile, everything looks rosy on the surface.
The Fed will likely try to tame optimism in the stock market — it doesn’t really care about gold — but that will also have the effect of dampening the gold price. That may well be a great opportunity to buy.
Retail sales are a good example. Since March, retail sales have been mostly flat or moderately higher. On the surface, there appears to be no problem. Dig deeper, and some things become apparent.
First, if consumer prices are increasing at a nearly 10% rate, then if sales remain flat, that means that people are, in effect, buying nearly 10% fewer goods.
Second, look at other indicators: the savings rate has collapsed to a 17-year low, while credit card debt has shot up at its fastest rate in over 20 years. (Vanguard reported last week that it had experienced record “emergency” withdrawals from 401k plans, another sign of consumer stress.)
Consumers are not buying from income; depleting savings and running up debt can last only so long. It is only a matter of time before the stress shows up in declining retail sales. As it becomes obvious that the U.S. is in a recession without the inflation goal being achieved — a stagflationary environment — then the focus becomes when the Fed will ease.
Gold and Gold Stocks Are Inexpensive
We are, then, entering the sweet spot for gold. A recession will result in a lower dollar and falling stock prices–the result of a weak economy — while gold looks to the eventual Fed reaction. The outlook is positive, and while gold has moved convincingly off its lows, it remains low relative to its price for most of the past two years. With gold almost $200 off the October lows, there has been very little response by investors in the gold ETFs, another indication of the lack of interest among investors in general for gold.
Last week’s action was perhaps a little aggressive for gold, particularly ahead of the last Fed meeting of the year. The Fed will likely try to tame optimism in the stock market — it doesn’t really care about gold — but that will also have the effect of dampening the gold price. That may well be a great opportunity to buy.
It is an anomaly for gold miners to be less expensive, have better balance sheets, and pay higher dividends than the broad market, and investors should take advantage of the opportunities in bullion and in the stocks before the crowd starts buying.
The gold stocks (per the XAU index), meanwhile, though up over 30% in the last two months, are trading, for the most part, well below their average historical valuations. The stocks are near their lows relative to bullion itself. While gold is up around 550% since 2000, gold stocks are up a little more than 100% and are still well below their levels from 2009 to 2013.
Let’s not forget that with the gold price at almost US$1800 and all-in-sustaining costs (AISC) below US$1,200 an ounce, while cash costs are far lower, margins are very strong. The sector in aggregate is net cash positive, while valuations are low: price-to-cash flow of fewer than nine times against 13.7 times for the S&P; price-to-NAV of 0.65 times against a seven-year average 50% higher; and with a yield 25% above that of the broad market.
It is an anomaly for gold miners to be less expensive, have better balance sheets, and pay higher dividends than the broad market, and investors should take advantage of the opportunities in bullion and in the stocks before the crowd starts buying.
From our list, the top stocks to buy if you do not own them would be Barrick Gold Corp. (ABX:TSX; GOLD:NYSE); Midland Exploration Inc. (MD:TSX.V); Lara Exploration Ltd. (LRA:TSX.V); and Orogen Royalties Inc. (OGN:TSX.V). Some of these I suspect we shall be able to buy at a somewhat lower price over the next week or two, but you should be alert if you do not currently own positions.
Adrian Day Disclosures:
Adrian Day’s Global Analyst is distributed for $990 per year by Investment Consultants International, Ltd., P.O. Box 6644, Annapolis, MD 21401. (410) 224-8885. www.AdrianDayGlobalAnalyst.com. Publisher: Adrian Day. Owner: Investment Consultants International, Ltd. Staff may have positions in securities discussed herein. Adrian Day is also President of Global Strategic Management (GSM), a registered investment advisor, and a separate company from this service. In his capacity as GSM president, Adrian Day may be buying or selling for clients securities recommended herein concurrently, before or after recommendations herein, and may be acting for clients in a manner contrary to recommendations herein. This is not a solicitation for GSM. Views herein are the editor’s opinion and not fact. All information is believed to be correct, but its accuracy cannot be guaranteed. The owner and editor are not responsible for errors and omissions. © 2022. Adrian Day’s Global Analyst. Information and advice herein are intended purely for the subscriber’s own account. Under no circumstances may any part of a Global Analyst e-mail be copied or distributed without prior written permission of the editor. Given the nature of this service, we will pursue any violations aggressively.
Disclosures:
1) Adrian Day: I, or members of my immediate household or family, own securities of the following companies mentioned in this article: All. I personally am, or members of my immediate household or family are, paid by the following companies mentioned in this article: None. My company has a financial relationship with the following companies mentioned in this article: None. Funds controlled by Adrian Day Asset Management, which is unaffiliated with Adrian Day’s newsletter, hold shares of the following companies mentioned in this article: All. I determined which companies would be included in this article based on my research and understanding of the sector.
2) The following companies mentioned in this article are billboard sponsors of Streetwise Reports: None. Click here for important disclosures about sponsor fees. The information provided above is for informational purposes only and is not a recommendation to buy or sell any security.
3) Statements and opinions expressed are the opinions of the author and not of Streetwise Reports or its officers. The author is wholly responsible for the validity of the statements. The author was not paid by Streetwise Reports for this article. Streetwise Reports was not paid by the author to publish or syndicate this article. Streetwise Reports requires contributing authors to disclose any shareholdings in, or economic relationships with, companies that they write about. Streetwise Reports relies upon the authors to accurately provide this information and Streetwise Reports has no means of verifying its accuracy.
4) This article does not constitute investment advice. Each reader is encouraged to consult with his or her individual financial professional and any action a reader takes as a result of information presented here is his or her own responsibility. By opening this page, each reader accepts and agrees to Streetwise Reports’ terms of use and full legal disclaimer. This article is not a solicitation for investment. Streetwise Reports does not render general or specific investment advice and the information on Streetwise Reports should not be considered a recommendation to buy or sell any security. Streetwise Reports does not endorse or recommend the business, products, services, or securities of any company mentioned on Streetwise Reports.
5) From time to time, Streetwise Reports LLC and its directors, officers, employees, or members of their families, as well as persons interviewed for articles and interviews on the site, may have a long or short position in the securities mentioned. Directors, officers, employees, or members of their immediate families are prohibited from making purchases and/or sales of those securities in the open market or otherwise from the time of the decision to publish an article until three business days after the publication of the article. The foregoing prohibition does not apply to articles that in substance only restate previously published company release.


 Ada King, Countess of Lovelace, was more than just another mathematician.
