
By InvestMacro
Here are the latest charts and statistics for the Commitment of Traders (COT) data published by the Commodities Futures Trading Commission (CFTC).
The latest COT data is updated through Tuesday November 29th and shows a quick view of how large traders (for-profit speculators and commercial entities) were positioned in the futures markets.
Weekly Speculator Changes led by Platinum
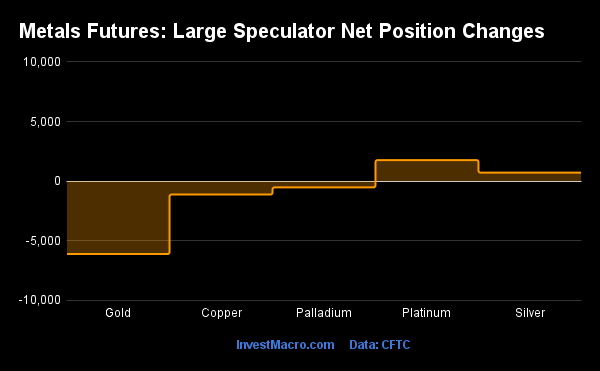
The COT precious metals speculator bets were a little lower this week as two out of the five metals markets we cover had higher positioning this week while three markets had lower contracts.
Free Reports:
 Get our Weekly Commitment of Traders Reports - See where the biggest traders (Hedge Funds and Commercial Hedgers) are positioned in the futures markets on a weekly basis.
 Sign Up for Our Stock Market Newsletter – Get updated on News, Charts & Rankings of Public Companies when you join our Stocks Newsletter
Leading the gains for the precious metals markets was Platinum (1,769 contracts) with Silver (717 contracts) also showing a positive week.
The metals markets leading the declines in speculator bets this week were Gold (-6,110 contracts) with Copper (-1,120 contracts) and Palladium (-523 contracts) also registering lower bets on the week.
Highlighting the COT metals data this week is the continued bullishness of Platinum positions. The large speculator standing in Platinum futures rose this week by +1,769 contracts. Speculator bets have now gained in eight out of the past nine weeks with a total rise of +24,098 contracts over that period. This has pushed the overall speculator’s bullish level for Platinum to its highest level in the past thirty-eight weeks, dating back to March 8th when the net position totaled +25,833 contracts.
Platinum futures prices have also been on the rise since hitting a September low near the $800.00 level. Platinum futures closed out this week right around the $1,026.60 level for an approximate gain by 28 percent since the September 1st low.
| Nov-29-2022 | OI | OI-Index | Spec-Net | Spec-Index | Com-Net | COM-Index | Smalls-Net | Smalls-Index |
|---|---|---|---|---|---|---|---|---|
| WTI Crude | 1,412,121 | 1 | 239,739 | 8 | -262,654 | 93 | 22,915 | 37 |
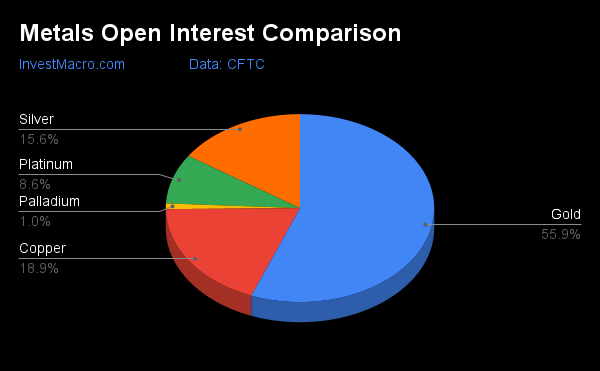
| Gold | 433,661 | 1 | 110,003 | 19 | -119,233 | 82 | 9,230 | 3 |
| Silver | 121,258 | 0 | 17,483 | 33 | -28,997 | 68 | 11,514 | 26 |
| Copper | 146,760 | 0 | 1,984 | 38 | -3,362 | 64 | 1,378 | 33 |
| Palladium | 7,537 | 8 | -1,631 | 14 | 1,687 | 84 | -56 | 38 |
| Platinum | 66,468 | 33 | 24,259 | 42 | -28,762 | 60 | 4,503 | 28 |
| Natural Gas | 985,010 | 7 | -163,429 | 30 | 136,191 | 74 | 27,238 | 45 |
| Brent | 155,500 | 15 | -32,087 | 57 | 29,424 | 42 | 2,663 | 45 |
| Heating Oil | 266,829 | 23 | 30,733 | 88 | -48,255 | 20 | 17,522 | 59 |
| Soybeans | 634,754 | 13 | 87,208 | 40 | -61,551 | 68 | -25,657 | 28 |
| Corn | 1,226,410 | 0 | 270,242 | 65 | -231,169 | 39 | -39,073 | 21 |
| Coffee | 196,365 | 9 | -14,636 | 2 | 13,695 | 99 | 941 | 12 |
| Sugar | 876,309 | 34 | 179,035 | 56 | -222,607 | 39 | 43,572 | 62 |
| Wheat | 310,667 | 10 | -33,305 | 0 | 37,024 | 100 | -3,719 | 91 |
Strength Scores led by Platinum & Copper
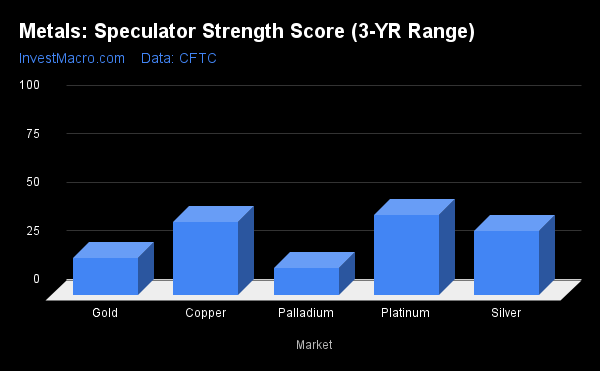
Strength scores (a measure of the 3-Year range of Speculator positions, from 0 to 100 where above 80 is extreme bullish and below 20 is extreme bearish) show that Platinum (41.7 percent) and Copper (37.9 percent) lead the metals category at the moment. Silver (33.4 percent) comes in as the next highest metals market in strength scores.
On the downside, Palladium (14.2 percent) and Gold (19.2 percent) are at the lowest strength levels currently and are both in extreme bearish levels.
Strength Statistics:
Gold (19.2 percent) vs Gold previous week (21.2 percent)
Silver (33.4 percent) vs Silver previous week (32.6 percent)
Copper (37.9 percent) vs Copper previous week (38.8 percent)
Platinum (41.7 percent) vs Platinum previous week (39.3 percent)
Palladium (14.2 percent) vs Palladium previous week (17.3 percent)
Platinum tops Strength Trends
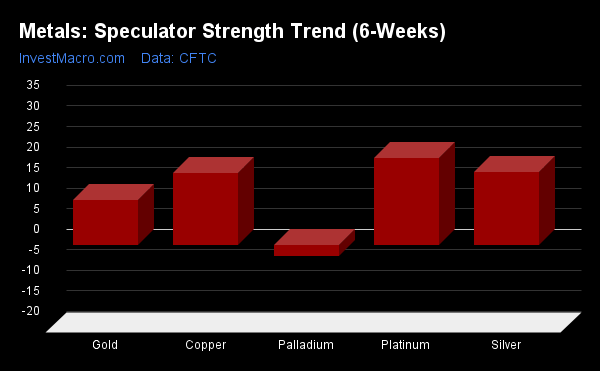
Strength Score Trends (or move index, calculates the 6-week changes in strength scores) show that Platinum (21.2 percent) leads the past six weeks trends for metals this week. Silver (17.9 percent), Copper (17.7 percent) and Gold (11.0 percent) are also positive movers in the latest trends data.
Palladium (-2.5 percent) leads the downside trend scores currently.
Move Statistics:
Gold (11.0 percent) vs Gold previous week (7.2 percent)
Silver (17.9 percent) vs Silver previous week (10.3 percent)
Copper (17.7 percent) vs Copper previous week (15.1 percent)
Platinum (21.2 percent) vs Platinum previous week (22.3 percent)
Palladium (-2.5 percent) vs Palladium previous week (-2.1 percent)
Individual Markets:
Gold Comex Futures:
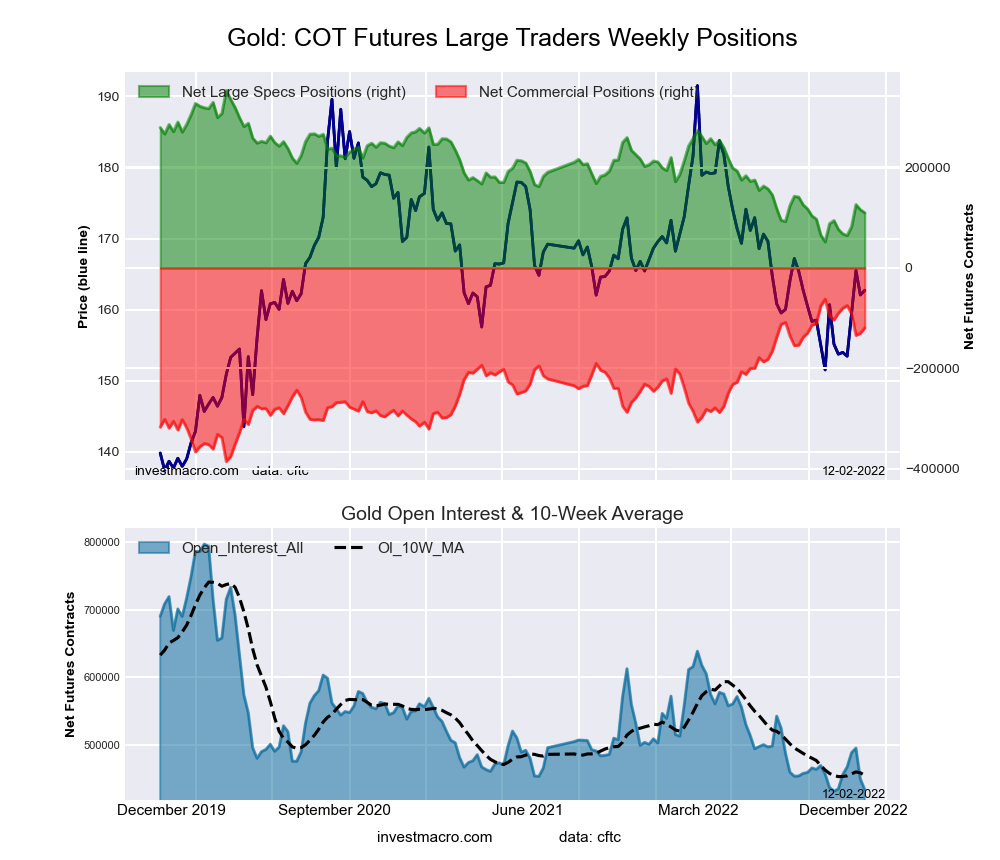 The Gold Comex Futures large speculator standing this week equaled a net position of 110,003 contracts in the data reported through Tuesday. This was a weekly decrease of -6,110 contracts from the previous week which had a total of 116,113 net contracts.
This week’s current strength score (the trader positioning range over the past three years, measured from 0 to 100) shows the speculators are currently Bearish-Extreme with a score of 19.2 percent. The commercials are Bullish-Extreme with a score of 82.3 percent and the small traders (not shown in chart) are Bearish-Extreme with a score of 3.0 percent.
| Gold Futures Statistics | SPECULATORS | COMMERCIALS | SMALL TRADERS |
| – Percent of Open Interest Longs: | 48.2 | 30.9 | 7.8 |
| – Percent of Open Interest Shorts: | 22.9 | 58.4 | 5.7 |
| – Net Position: | 110,003 | -119,233 | 9,230 |
| – Gross Longs: | 209,161 | 134,184 | 33,946 |
| – Gross Shorts: | 99,158 | 253,417 | 24,716 |
| – Long to Short Ratio: | 2.1 to 1 | 0.5 to 1 | 1.4 to 1 |
| NET POSITION TREND: | |||
| – Strength Index Score (3 Year Range Pct): | 19.2 | 82.3 | 3.0 |
| – Strength Index Reading (3 Year Range): | Bearish-Extreme | Bullish-Extreme | Bearish-Extreme |
| NET POSITION MOVEMENT INDEX: | |||
| – 6-Week Change in Strength Index: | 11.0 | -9.0 | -9.7 |
Silver Comex Futures:
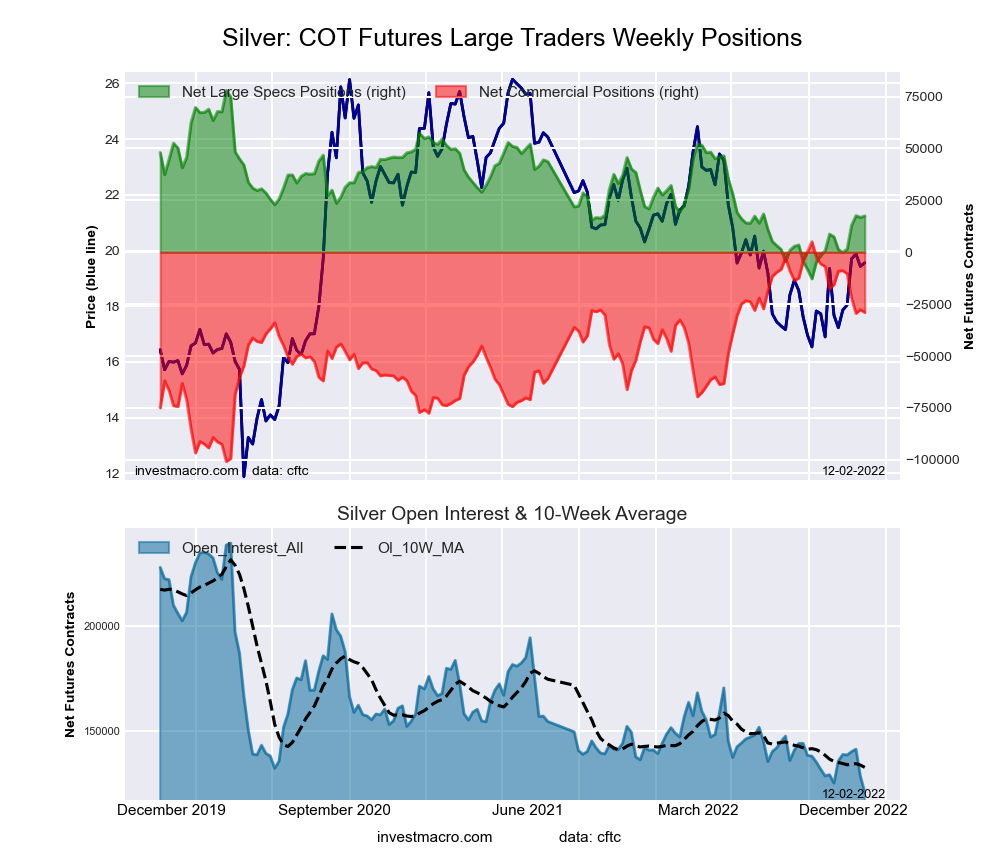 The Silver Comex Futures large speculator standing this week equaled a net position of 17,483 contracts in the data reported through Tuesday. This was a weekly boost of 717 contracts from the previous week which had a total of 16,766 net contracts.
This week’s current strength score (the trader positioning range over the past three years, measured from 0 to 100) shows the speculators are currently Bearish with a score of 33.4 percent. The commercials are Bullish with a score of 67.8 percent and the small traders (not shown in chart) are Bearish with a score of 26.0 percent.
| Silver Futures Statistics | SPECULATORS | COMMERCIALS | SMALL TRADERS |
| – Percent of Open Interest Longs: | 39.9 | 38.2 | 18.3 |
| – Percent of Open Interest Shorts: | 25.5 | 62.1 | 8.8 |
| – Net Position: | 17,483 | -28,997 | 11,514 |
| – Gross Longs: | 48,441 | 46,270 | 22,150 |
| – Gross Shorts: | 30,958 | 75,267 | 10,636 |
| – Long to Short Ratio: | 1.6 to 1 | 0.6 to 1 | 2.1 to 1 |
| NET POSITION TREND: | |||
| – Strength Index Score (3 Year Range Pct): | 33.4 | 67.8 | 26.0 |
| – Strength Index Reading (3 Year Range): | Bearish | Bullish | Bearish |
| NET POSITION MOVEMENT INDEX: | |||
| – 6-Week Change in Strength Index: | 17.9 | -18.8 | 17.8 |
Copper Grade #1 Futures:
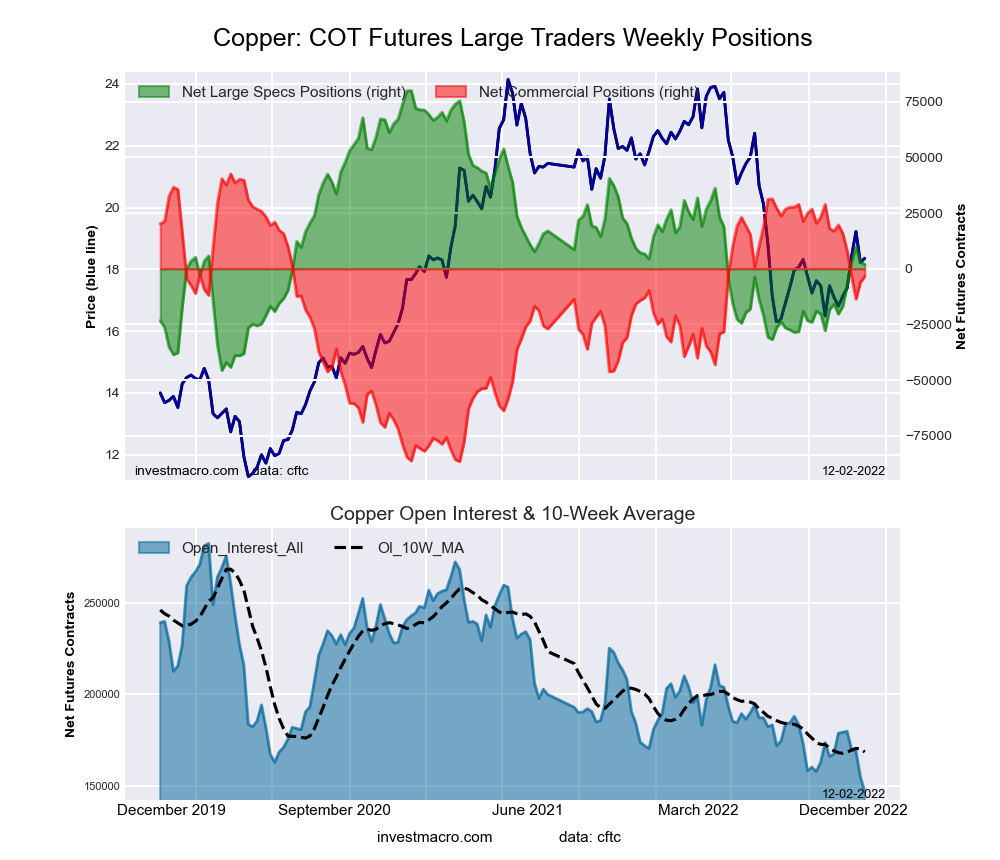 The Copper Grade #1 Futures large speculator standing this week equaled a net position of 1,984 contracts in the data reported through Tuesday. This was a weekly reduction of -1,120 contracts from the previous week which had a total of 3,104 net contracts.
This week’s current strength score (the trader positioning range over the past three years, measured from 0 to 100) shows the speculators are currently Bearish with a score of 37.9 percent. The commercials are Bullish with a score of 64.4 percent and the small traders (not shown in chart) are Bearish with a score of 33.3 percent.
| Copper Futures Statistics | SPECULATORS | COMMERCIALS | SMALL TRADERS |
| – Percent of Open Interest Longs: | 35.0 | 43.1 | 9.2 |
| – Percent of Open Interest Shorts: | 33.7 | 45.4 | 8.3 |
| – Net Position: | 1,984 | -3,362 | 1,378 |
| – Gross Longs: | 51,433 | 63,196 | 13,549 |
| – Gross Shorts: | 49,449 | 66,558 | 12,171 |
| – Long to Short Ratio: | 1.0 to 1 | 0.9 to 1 | 1.1 to 1 |
| NET POSITION TREND: | |||
| – Strength Index Score (3 Year Range Pct): | 37.9 | 64.4 | 33.3 |
| – Strength Index Reading (3 Year Range): | Bearish | Bullish | Bearish |
| NET POSITION MOVEMENT INDEX: | |||
| – 6-Week Change in Strength Index: | 17.7 | -17.9 | 4.5 |
Platinum Futures:
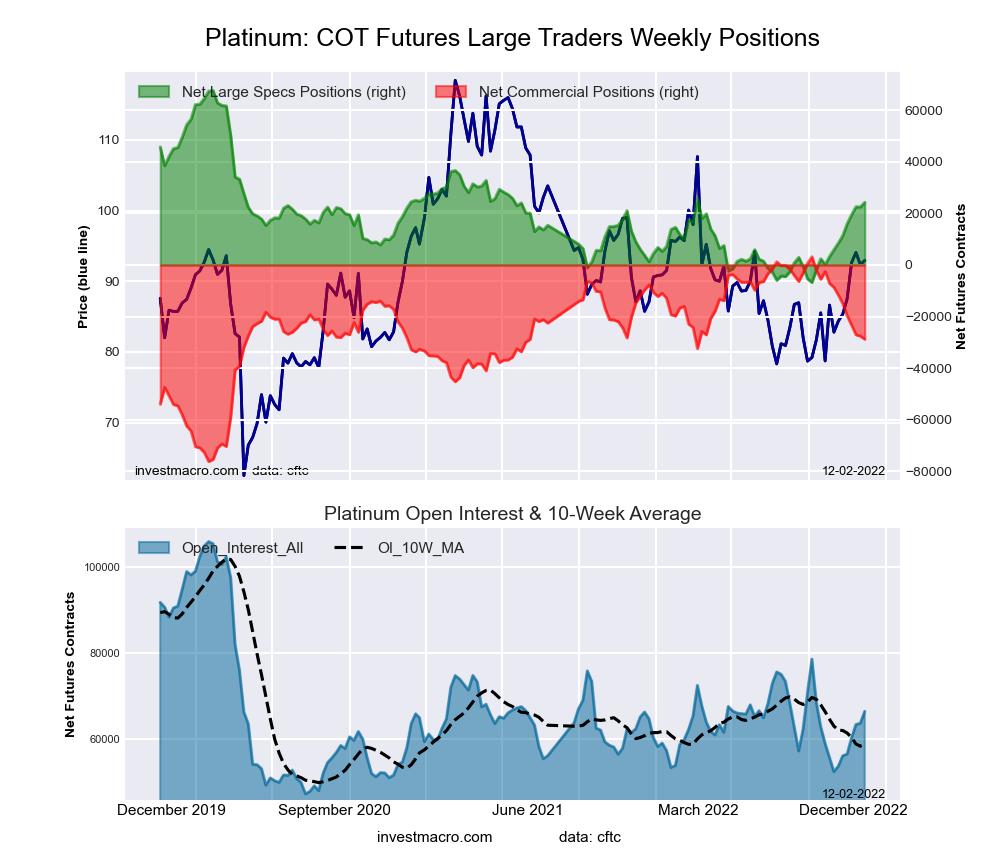 The Platinum Futures large speculator standing this week equaled a net position of 24,259 contracts in the data reported through Tuesday. This was a weekly lift of 1,769 contracts from the previous week which had a total of 22,490 net contracts.
This week’s current strength score (the trader positioning range over the past three years, measured from 0 to 100) shows the speculators are currently Bearish with a score of 41.7 percent. The commercials are Bullish with a score of 59.8 percent and the small traders (not shown in chart) are Bearish with a score of 28.5 percent.
| Platinum Futures Statistics | SPECULATORS | COMMERCIALS | SMALL TRADERS |
| – Percent of Open Interest Longs: | 53.1 | 29.8 | 11.1 |
| – Percent of Open Interest Shorts: | 16.6 | 73.1 | 4.4 |
| – Net Position: | 24,259 | -28,762 | 4,503 |
| – Gross Longs: | 35,268 | 19,824 | 7,400 |
| – Gross Shorts: | 11,009 | 48,586 | 2,897 |
| – Long to Short Ratio: | 3.2 to 1 | 0.4 to 1 | 2.6 to 1 |
| NET POSITION TREND: | |||
| – Strength Index Score (3 Year Range Pct): | 41.7 | 59.8 | 28.5 |
| – Strength Index Reading (3 Year Range): | Bearish | Bullish | Bearish |
| NET POSITION MOVEMENT INDEX: | |||
| – 6-Week Change in Strength Index: | 21.2 | -21.6 | 18.2 |
Palladium Futures:
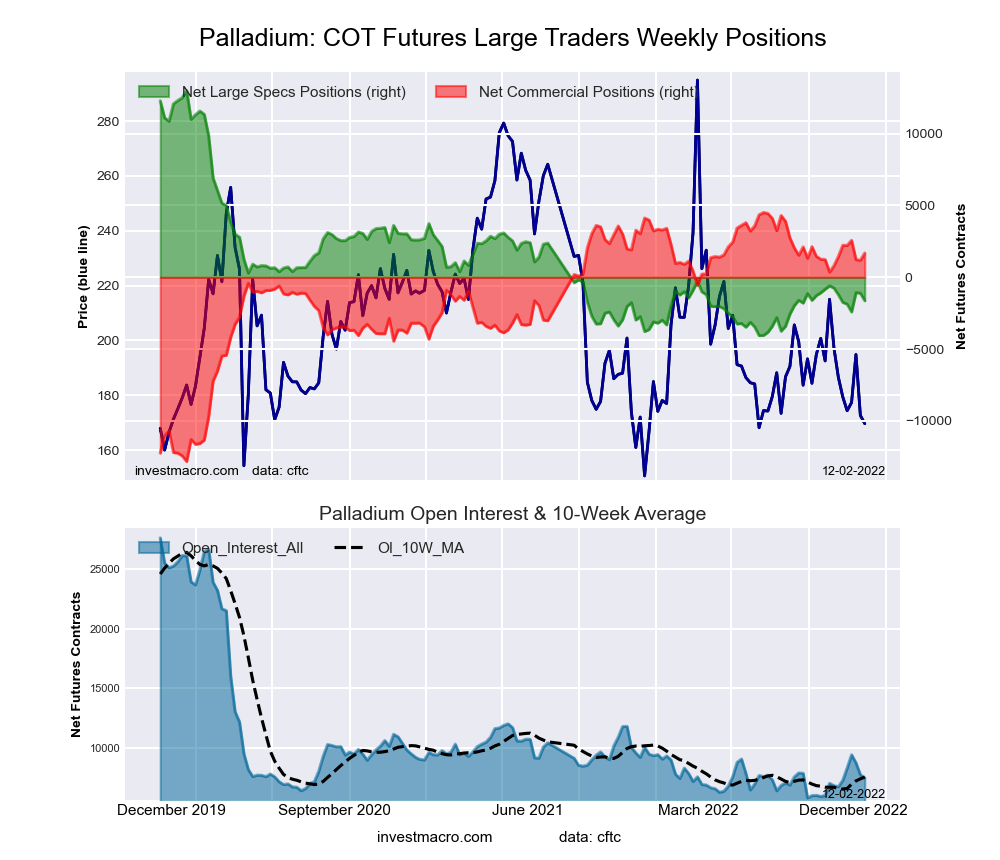 The Palladium Futures large speculator standing this week equaled a net position of -1,631 contracts in the data reported through Tuesday. This was a weekly lowering of -523 contracts from the previous week which had a total of -1,108 net contracts.
This week’s current strength score (the trader positioning range over the past three years, measured from 0 to 100) shows the speculators are currently Bearish-Extreme with a score of 14.2 percent. The commercials are Bullish-Extreme with a score of 83.7 percent and the small traders (not shown in chart) are Bearish with a score of 38.3 percent.
| Palladium Futures Statistics | SPECULATORS | COMMERCIALS | SMALL TRADERS |
| – Percent of Open Interest Longs: | 30.4 | 52.4 | 14.1 |
| – Percent of Open Interest Shorts: | 52.0 | 30.0 | 14.8 |
| – Net Position: | -1,631 | 1,687 | -56 |
| – Gross Longs: | 2,289 | 3,951 | 1,061 |
| – Gross Shorts: | 3,920 | 2,264 | 1,117 |
| – Long to Short Ratio: | 0.6 to 1 | 1.7 to 1 | 0.9 to 1 |
| NET POSITION TREND: | |||
| – Strength Index Score (3 Year Range Pct): | 14.2 | 83.7 | 38.3 |
| – Strength Index Reading (3 Year Range): | Bearish-Extreme | Bullish-Extreme | Bearish |
| NET POSITION MOVEMENT INDEX: | |||
| – 6-Week Change in Strength Index: | -2.5 | 1.4 | 10.8 |
Article By InvestMacro – Receive our weekly COT Newsletter
*COT Report: The COT data, released weekly to the public each Friday, is updated through the most recent Tuesday (data is 3 days old) and shows a quick view of how large speculators or non-commercials (for-profit traders) were positioned in the futures markets.
The CFTC categorizes trader positions according to commercial hedgers (traders who use futures contracts for hedging as part of the business), non-commercials (large traders who speculate to realize trading profits) and nonreportable traders (usually small traders/speculators) as well as their open interest (contracts open in the market at time of reporting). See CFTC criteria here.

- Geopolitical and macroeconomic conditions continue to pressure market sentiment Jul 20, 2026
- USD/JPY Poised to Continue Gains as Expensive Oil and Lack of Support Weigh on Yen Jul 20, 2026
- COT Metals Charts: Weekly Speculator Bets led by Copper & Steel Jul 18, 2026
- COT Bonds Charts: Weekly Speculator Bets led by 2-Year, SOFR 3M & 5-Year Bonds Jul 18, 2026
- COT Energy Charts: Weekly Speculator Bets led by Brent Oil & Heating Oil Jul 18, 2026
- COT Soft Commodities Charts: Weekly Speculator Bets led by Wheat, Corn & Soybean Meal Jul 18, 2026
- The Bank of Canada kept its interest rate unchanged. Platinum prices reached a three‑week high Jul 16, 2026
- Stock indices rose after the release of US inflation data. China’s GDP slowed sharply Jul 15, 2026
- GBP/USD Awaits Political News: What Will Happen Next Jul 15, 2026
- USD/JPY Holds at Highs: Pressure Lingers on Yen Jul 14, 2026