Archive for CountingPips Forex Blog – Page 25

COT Stock Market Charts: Speculators boost SP500-Mini Futures bets to 50-Week high

By InvestMacro.com COT Home | Data Tables | Data Downloads | Newsletter

Here are the latest charts and statistics for the Commitment of Traders (COT) data published by the Commodities Futures Trading Commission (CFTC).

The latest COT data is updated through Tuesday October 12th 2021 and shows a quick view of how large traders (for-profit speculators and commercial entities) were positioned in the futures markets.

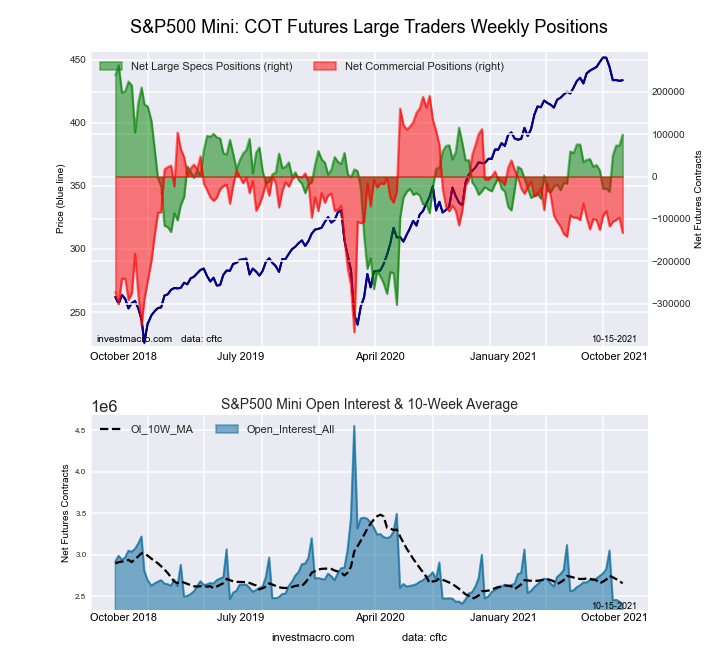
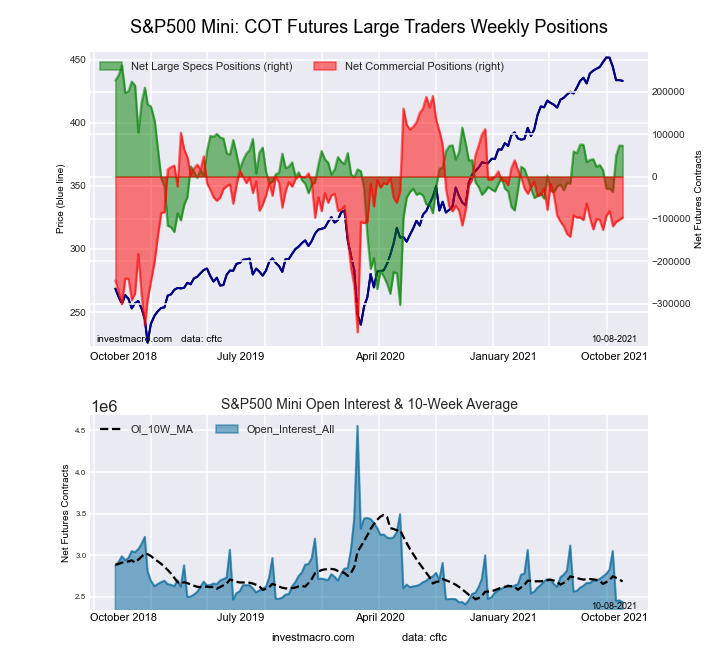
Highlighting this week’s stock market COT data is the S&P500 Mini contracts which rose sharply this week by 25,999 contracts. The S&P500 Mini bets have now gained for three out of the past four weeks and by a total of +134,625 contracts over that time-frame. This has brought the speculator level out of a negative position on September 14th to the current speculator position at a total of 98,783 contracts. The current standing marks the highest level since October 27th of 2020 when the total contracts reached 115,439 net positions.


Data Snapshot of Stock Market Traders | Columns Legend
Oct-12-2021OIOI-IndexSpec-NetSpec-IndexCom-NetCOM-IndexSmalls-NetSmalls-Index
S&P500-Mini2,403,163098,78371-133,1674234,38434
Nikkei 22517,54891,19457-2,536451,34244
Nasdaq-Mini230,61531-818752,87628-2,05839
DowJones-Mini102,04073-4,28331-3,119597,40278
VIX329,90536-73,5695581,41746-7,84827
Nikkei 225 Yen56,171384,6083426,699100-31,30718


VIX Volatility Futures:

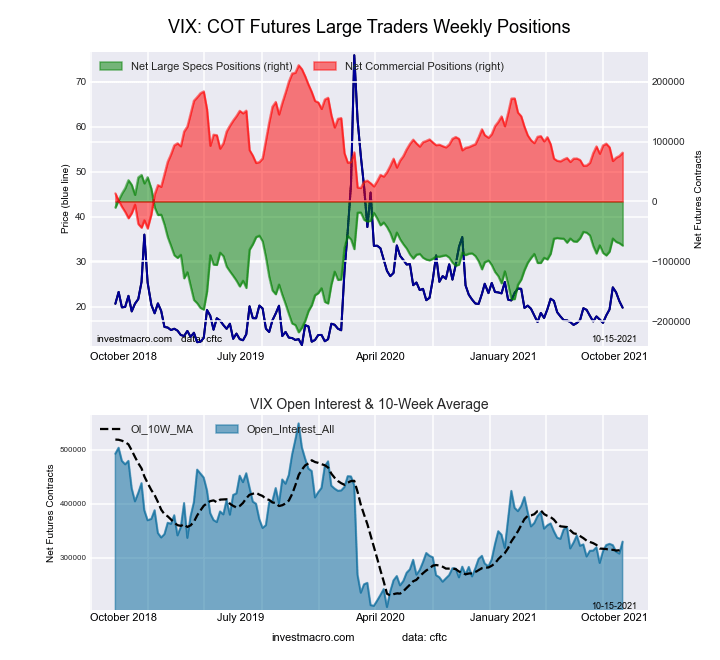
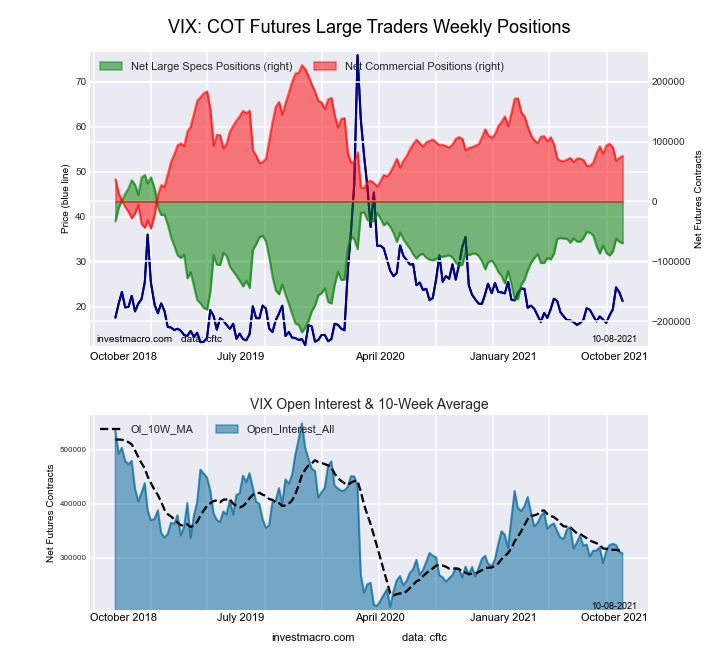
Federal Funds 30-Day Bonds Futures COT ChartThe VIX Volatility large speculator standing this week recorded a net position of -73,569 contracts in the data reported through Tuesday. This was a weekly decrease of -3,981 contracts from the previous week which had a total of -69,588 net contracts.

This week’s current strength score (the trader positioning range over the past three years, measured from 0 to 100) shows the speculators are currently Bullish with a score of 55.1 percent. The commercials are Bearish with a score of 46.4 percent and the small traders (not shown in chart) are Bearish with a score of 26.6 percent.

VIX Volatility Futures StatisticsSPECULATORSCOMMERCIALSSMALL TRADERS
– Percent of Open Interest Longs:16.352.16.3
– Percent of Open Interest Shorts:38.627.48.7
– Net Position:-73,56981,417-7,848
– Gross Longs:53,756171,92820,718
– Gross Shorts:127,32590,51128,566
– Long to Short Ratio:0.4 to 11.9 to 10.7 to 1
NET POSITION TREND:
– COT Index Score (3 Year Range Pct):55.146.426.6
– COT Index Reading (3 Year Range):BullishBearishBearish
NET POSITION MOVEMENT INDEX:
– 6-Week Change in Strength Index:4.7-4.4-0.6


S&P500 Mini Futures:

2-Year Treasury Bonds Futures COT ChartThe S&P500 Mini large speculator standing this week recorded a net position of 98,783 contracts in the market data reported through Tuesday. This was a weekly increase of 25,999 contracts from the previous week which had a total of 72,784 net contracts.

This week’s current strength score (the trader positioning range over the past three years, measured from 0 to 100) shows the speculators are currently Bullish with a score of 71.0 percent. The commercials are Bearish with a score of 42.0 percent and the small traders (not shown in chart) are Bearish with a score of 33.6 percent.

S&P500 Mini Futures StatisticsSPECULATORSCOMMERCIALSSMALL TRADERS
– Percent of Open Interest Longs:15.870.910.9
– Percent of Open Interest Shorts:11.776.49.5
– Net Position:98,783-133,16734,384
– Gross Longs:379,9011,704,039262,461
– Gross Shorts:281,1181,837,206228,077
– Long to Short Ratio:1.4 to 10.9 to 11.2 to 1
NET POSITION TREND:
– COT Index Score (3 Year Range Pct):71.042.033.6
– COT Index Reading (3 Year Range):BullishBearishBearish
NET POSITION MOVEMENT INDEX:
– 6-Week Change in Strength Index:22.5-7.2-18.3


Dow Jones Mini Futures:

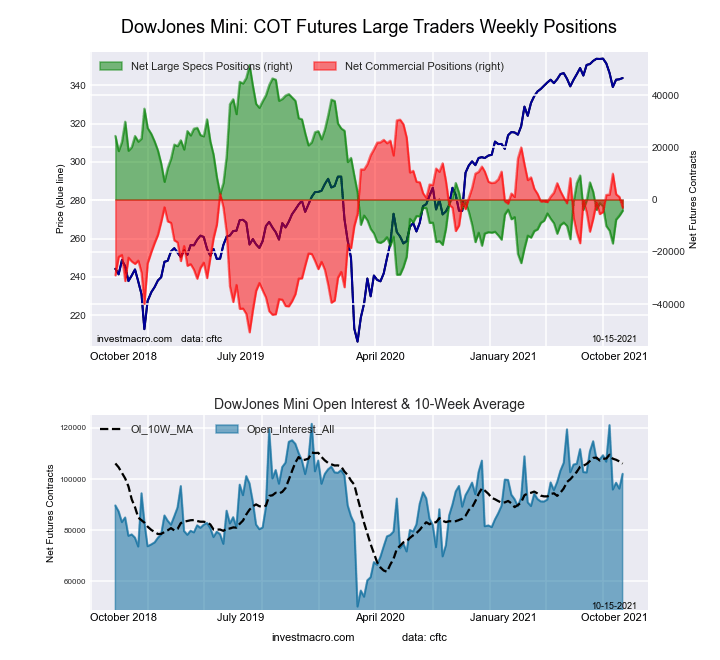
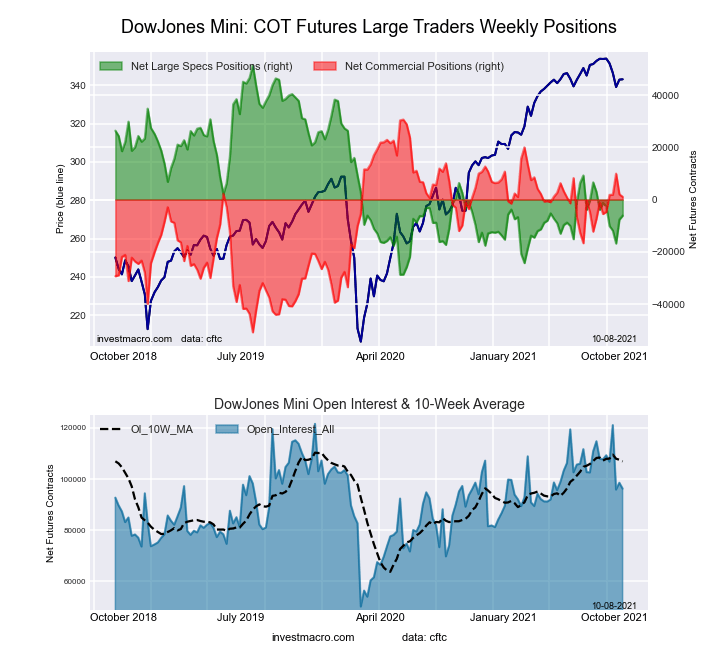
5-Year Treasury Bonds Futures COT ChartThe Dow Jones Mini large speculator standing this week recorded a net position of -4,283 contracts in the data reported through Tuesday. This was a weekly increase of 1,892 contracts from the previous week which had a total of -6,175 net contracts.

This week’s current strength score (the trader positioning range over the past three years, measured from 0 to 100) shows the speculators are currently Bearish with a score of 30.5 percent. The commercials are Bullish with a score of 58.6 percent and the small traders (not shown in chart) are Bullish with a score of 78.0 percent.

Dow Jones Mini Futures StatisticsSPECULATORSCOMMERCIALSSMALL TRADERS
– Percent of Open Interest Longs:31.548.618.0
– Percent of Open Interest Shorts:35.751.610.8
– Net Position:-4,283-3,1197,402
– Gross Longs:32,18349,54218,417
– Gross Shorts:36,46652,66111,015
– Long to Short Ratio:0.9 to 10.9 to 11.7 to 1
NET POSITION TREND:
– COT Index Score (3 Year Range Pct):30.558.678.0
– COT Index Reading (3 Year Range):BearishBullishBullish
NET POSITION MOVEMENT INDEX:
– 6-Week Change in Strength Index:-2.22.00.7


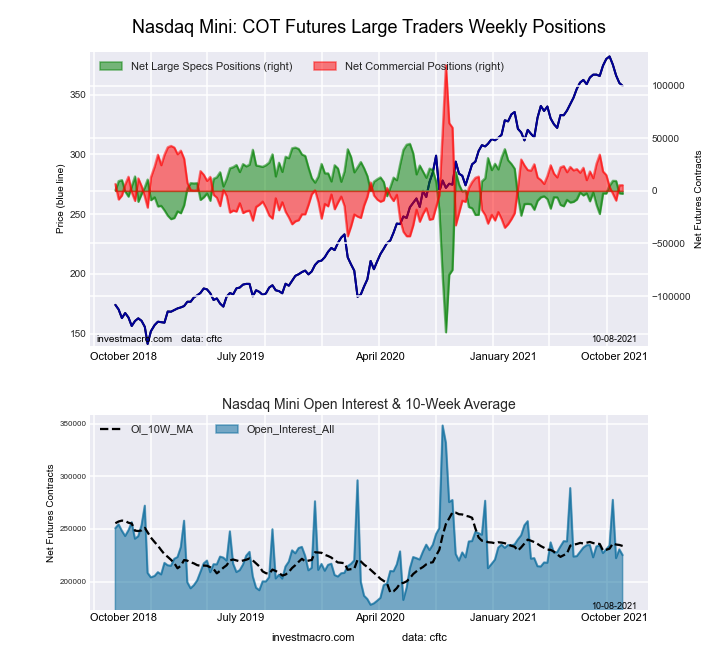
Nasdaq Mini Futures:

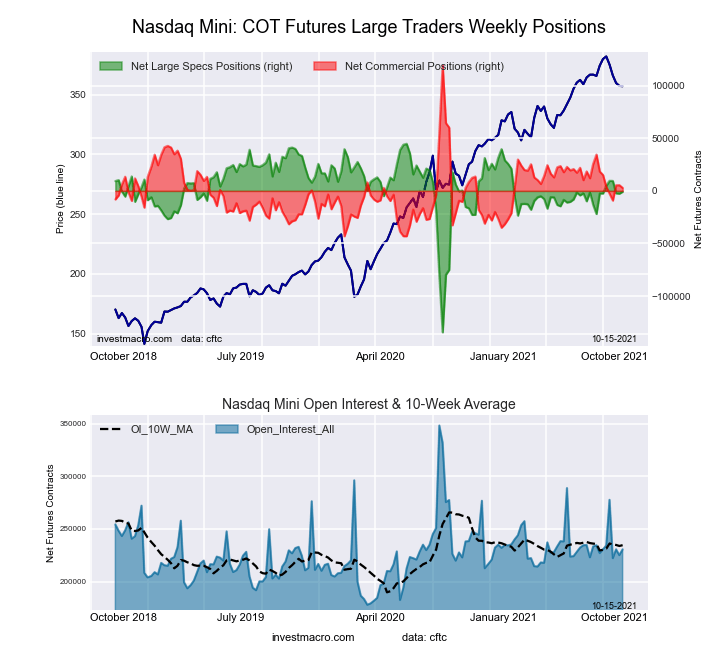
10-Year Treasury Notes Bonds Futures COT ChartThe Nasdaq Mini large speculator standing this week recorded a net position of -818 contracts in the data reported through Tuesday. This was a weekly advance of 1,835 contracts from the previous week which had a total of -2,653 net contracts.

This week’s current strength score (the trader positioning range over the past three years, measured from 0 to 100) shows the speculators are currently Bullish with a score of 74.6 percent. The commercials are Bearish with a score of 28.3 percent and the small traders (not shown in chart) are Bearish with a score of 39.4 percent.

Nasdaq Mini Futures StatisticsSPECULATORSCOMMERCIALSSMALL TRADERS
– Percent of Open Interest Longs:26.355.216.8
– Percent of Open Interest Shorts:26.754.017.7
– Net Position:-8182,876-2,058
– Gross Longs:60,671127,30238,670
– Gross Shorts:61,489124,42640,728
– Long to Short Ratio:1.0 to 11.0 to 10.9 to 1
NET POSITION TREND:
– COT Index Score (3 Year Range Pct):74.628.339.4
– COT Index Reading (3 Year Range):BullishBearishBearish
NET POSITION MOVEMENT INDEX:
– 6-Week Change in Strength Index:0.9-7.523.8


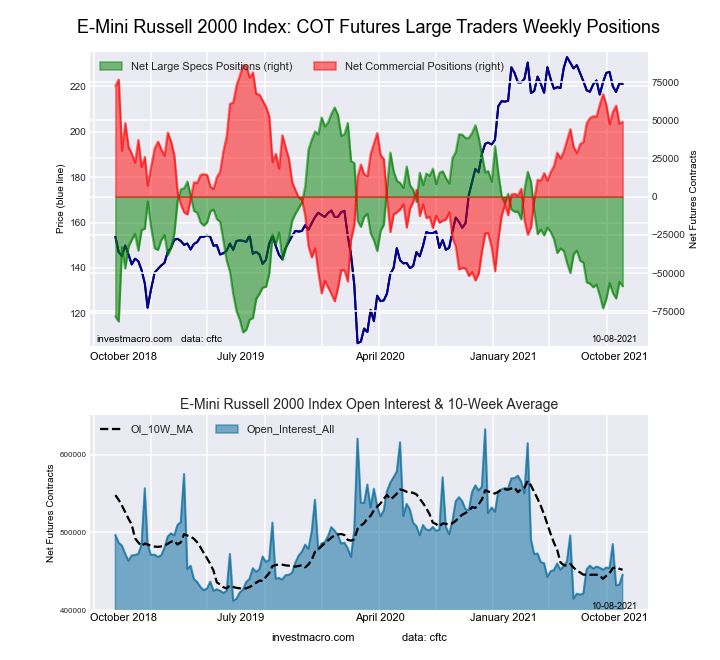
Russell 2000 Mini Futures:

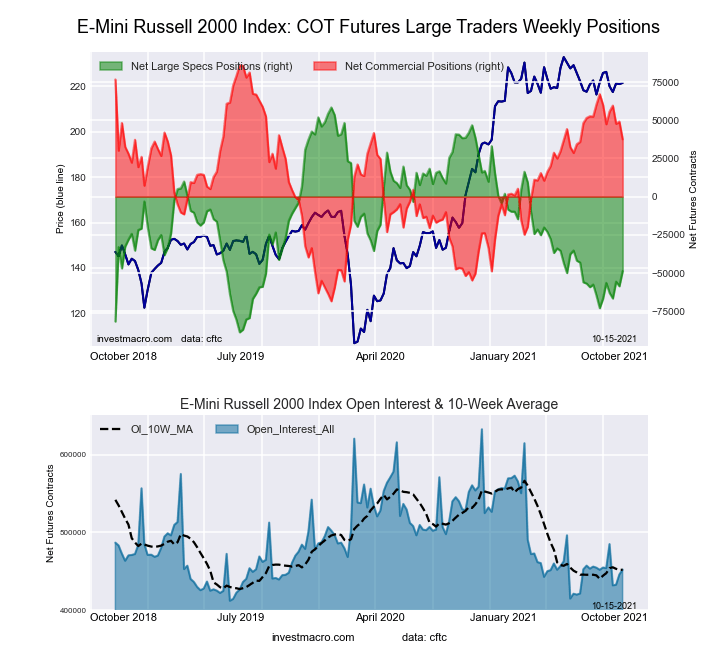
Ultra 10-Year Treasury Notes Bonds Futures COT ChartThe Russell 2000 Mini large speculator standing this week recorded a net position of -48,706 contracts in the market data reported through Tuesday. This was a weekly lift of 9,907 contracts from the previous week which had a total of -58,613 net contracts.

This week’s current strength score (the trader positioning range over the past three years, measured from 0 to 100) shows the speculators are currently Bearish with a score of 27.2 percent. The commercials are Bullish with a score of 68.6 percent and the small traders (not shown in chart) are Bullish with a score of 64.6 percent.

Russell 2000 Mini Futures StatisticsSPECULATORSCOMMERCIALSSMALL TRADERS
– Percent of Open Interest Longs:14.278.16.6
– Percent of Open Interest Shorts:24.969.84.2
– Net Position:-48,70637,53611,170
– Gross Longs:63,996353,15729,974
– Gross Shorts:112,702315,62118,804
– Long to Short Ratio:0.6 to 11.1 to 11.6 to 1
NET POSITION TREND:
– COT Index Score (3 Year Range Pct):27.268.664.6
– COT Index Reading (3 Year Range):BearishBullishBullish
NET POSITION MOVEMENT INDEX:
– 6-Week Change in Strength Index:12.3-14.612.6


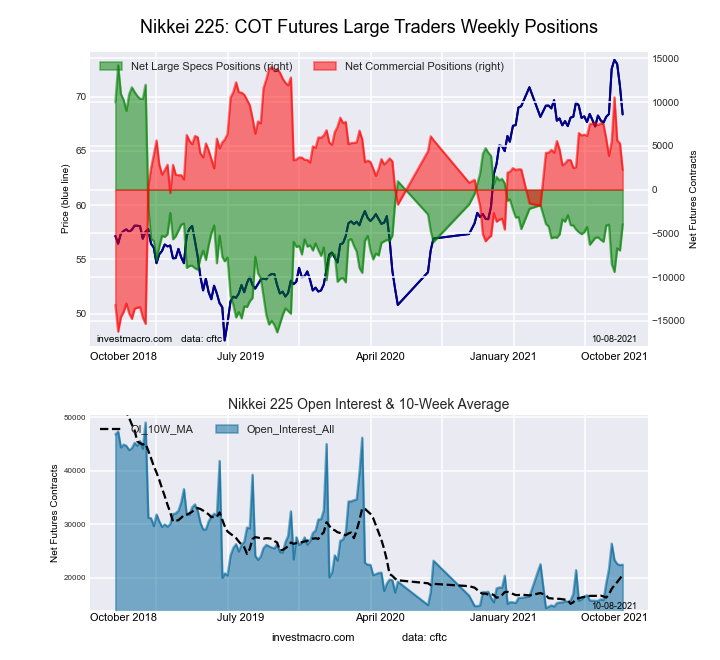
Nikkei Stock Average (USD) Futures:

US Year Treasury Notes Long Bonds Futures COT ChartThe Nikkei Stock Average (USD) large speculator standing this week recorded a net position of 1,194 contracts in the data reported through Tuesday. This was a weekly increase of 5,138 contracts from the previous week which had a total of -3,944 net contracts.

This week’s current strength score (the trader positioning range over the past three years, measured from 0 to 100) shows the speculators are currently Bullish with a score of 57.3 percent. The commercials are Bearish with a score of 45.3 percent and the small traders (not shown in chart) are Bearish with a score of 44.0 percent.

Nikkei Stock Average Futures StatisticsSPECULATORSCOMMERCIALSSMALL TRADERS
– Percent of Open Interest Longs:12.361.526.0
– Percent of Open Interest Shorts:5.576.018.3
– Net Position:1,194-2,5361,342
– Gross Longs:2,16710,7964,558
– Gross Shorts:97313,3323,216
– Long to Short Ratio:2.2 to 10.8 to 11.4 to 1
NET POSITION TREND:
– COT Index Score (3 Year Range Pct):57.345.344.0
– COT Index Reading (3 Year Range):BullishBearishBearish
NET POSITION MOVEMENT INDEX:
– 6-Week Change in Strength Index:17.0-21.115.3


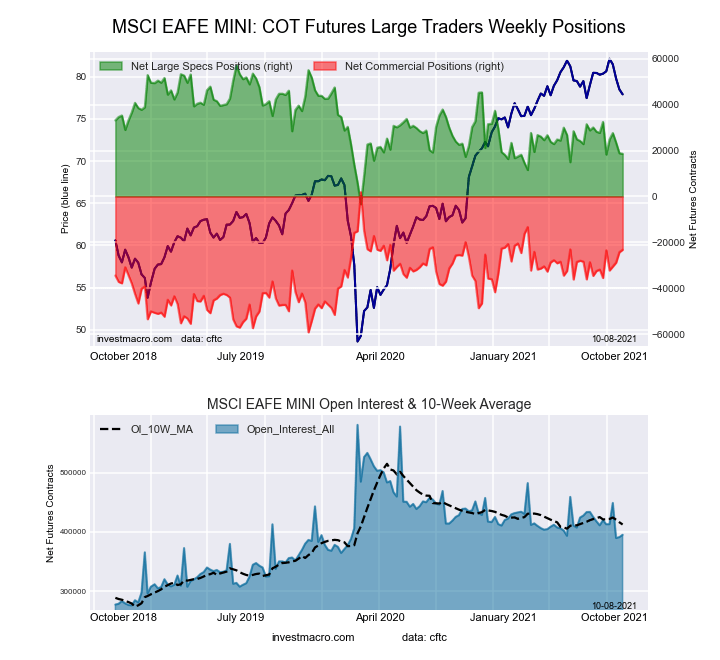
MSCI EAFE Mini Futures:

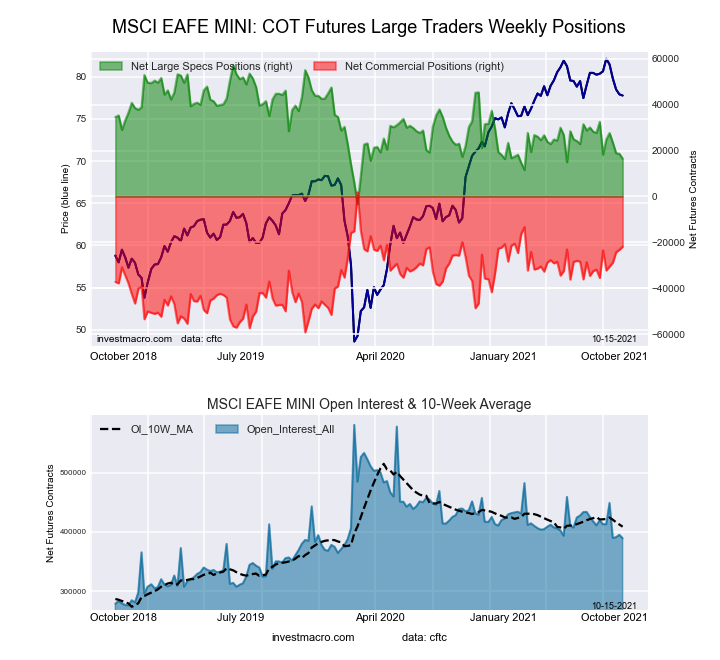
Ultra US Year Treasury Notes Long Bonds Futures COT ChartThe MSCI EAFE Mini large speculator standing this week recorded a net position of 16,454 contracts in the data reported through Tuesday. This was a weekly lowering of -2,137 contracts from the previous week which had a total of 18,591 net contracts.

This week’s current strength score (the trader positioning range over the past three years, measured from 0 to 100) shows the speculators are currently Bearish with a score of 32.8 percent. The commercials are Bullish with a score of 61.1 percent and the small traders (not shown in chart) are Bullish with a score of 65.3 percent.

MSCI EAFE Mini Futures StatisticsSPECULATORSCOMMERCIALSSMALL TRADERS
– Percent of Open Interest Longs:7.089.72.7
– Percent of Open Interest Shorts:2.895.31.3
– Net Position:16,454-21,8965,442
– Gross Longs:27,317349,33610,335
– Gross Shorts:10,863371,2324,893
– Long to Short Ratio:2.5 to 10.9 to 12.1 to 1
NET POSITION TREND:
– COT Index Score (3 Year Range Pct):32.861.165.3
– COT Index Reading (3 Year Range):BearishBullishBullish
NET POSITION MOVEMENT INDEX:
– 6-Week Change in Strength Index:-3.02.62.0


Article By InvestMacro.comReceive our weekly COT Reports by Email

*COT Report: The COT data, released weekly to the public each Friday, is updated through the most recent Tuesday (data is 3 days old) and shows a quick view of how large speculators or non-commercials (for-profit traders) were positioned in the futures markets.

The CFTC categorizes trader positions according to commercial hedgers (traders who use futures contracts for hedging as part of the business), non-commercials (large traders who speculate to realize trading profits) and nonreportable traders (usually small traders/speculators).

Find CFTC criteria here: (http://www.cftc.gov/MarketReports/CommitmentsofTraders/ExplanatoryNotes/index.htm).

COT Energy Charts: Speculators raise Heating Oil Futures bets to 156-week high

By InvestMacro.com COT Home | Data Tables | Data Downloads | Newsletter

Here are the latest charts and statistics for the Commitment of Traders (COT) data published by the Commodities Futures Trading Commission (CFTC).

The latest COT data is updated through Tuesday October 12th 2021 and shows a quick view of how large traders (for-profit speculators and commercial entities) were positioned in the futures markets.

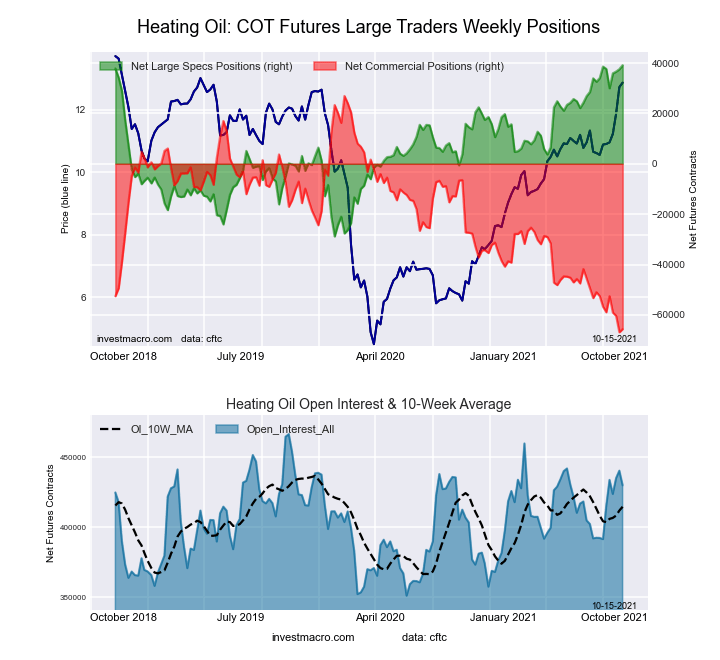
Highlighting this week’s data is the Heating Oil bullish speculator positions which rose to the highest level in the past 156 weeks at a total of 39,137 contracts. This is the most bullish level dating back to October 16th of 2018 when the net position totaled 43,385 contracts. Heating Oil speculative contracts have increased for four straight weeks and for ten out of the last thirteen weeks. The speculator strength score is currently at 100 percent showing that speculator sentiment is at a three-year high.


Data Snapshot of Commodity Market Traders | Columns Legend
Oct-12-2021OIOI-IndexSpec-NetSpec-IndexCom-NetCOM-IndexSmalls-NetSmalls-Index
WTI Crude2,231,22748404,77641-453,6844648,90884
Gold484,38221185,53954-207,6144622,07533
Silver139,403617,98740-30,2926912,30511
Copper194,8172322,48159-25,867423,38645
Palladium9,29613-2,49642,62595-12937
Platinum59,3442110,91918-16,756855,83743
Natural Gas1,314,02240-130,9023991,2016039,70179
Brent205,52144-34,9245729,563375,36182
Heating Oil429,9086839,137100-65,644126,50790
Soybeans759,1013541,99041-9,66564-32,32518
Corn1,400,3774279,28866-223,33640-55,95211
Coffee305,1416269,08599-73,80824,72321
Sugar891,67225246,18887-294,6741248,48668
Wheat385,20423-4,5344312,96953-8,43561


WTI Crude Oil Futures:

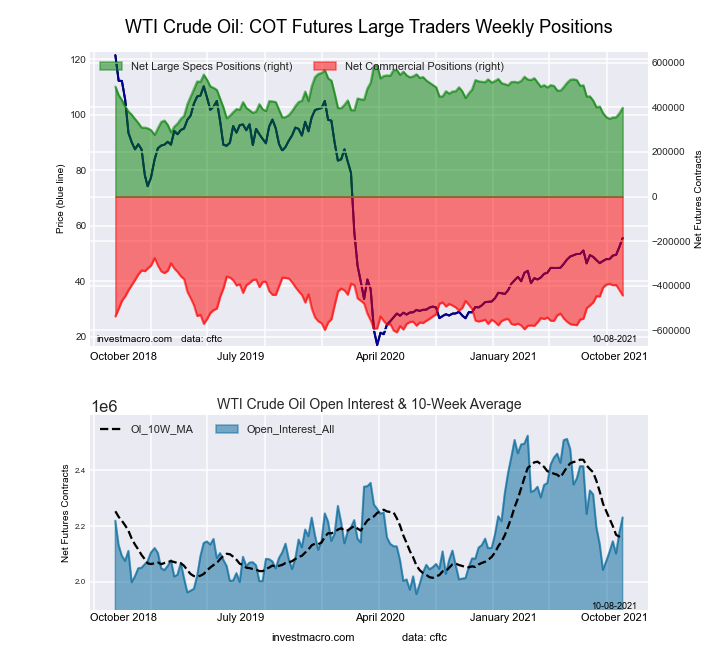
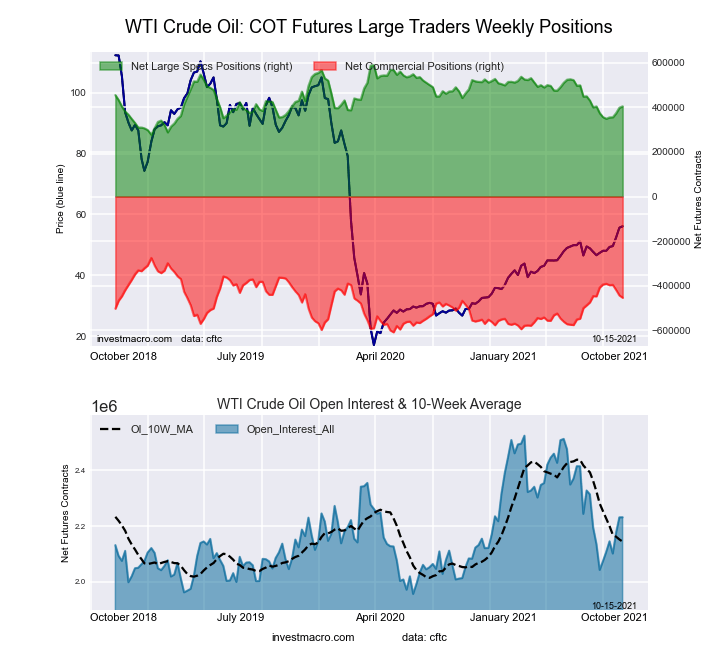
WTI Crude Oil Futures COT ChartThe WTI Crude Oil Futures large speculator standing this week came in at a net position of 404,776 contracts in the data reported through Tuesday. This was a weekly advance of 6,469 contracts from the previous week which had a total of 398,307 net contracts.

This week’s current strength score (the trader positioning range over the past three years, measured from 0 to 100) shows the speculators are currently Bearish with a score of 40.9 percent. The commercials are Bearish with a score of 46.5 percent and the small traders (not shown in chart) are Bullish-Extreme with a score of 83.9 percent.

WTI Crude Oil Futures StatisticsSPECULATORSCOMMERCIALSSMALL TRADERS
– Percent of Open Interest Longs:25.332.34.7
– Percent of Open Interest Shorts:7.152.72.5
– Net Position:404,776-453,68448,908
– Gross Longs:564,001721,614105,276
– Gross Shorts:159,2251,175,29856,368
– Long to Short Ratio:3.5 to 10.6 to 11.9 to 1
NET POSITION TREND:
– COT Index Score (3 Year Range Pct):40.946.583.9
– COT Index Reading (3 Year Range):BearishBearishBullish-Extreme
NET POSITION MOVEMENT INDEX:
– 6-Week Change in Strength Index:15.5-17.815.7


Brent Crude Oil Futures:

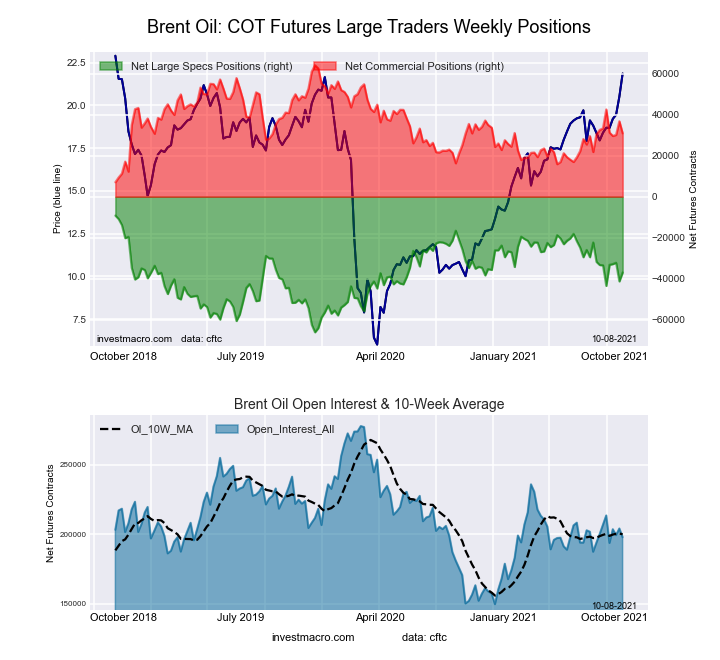
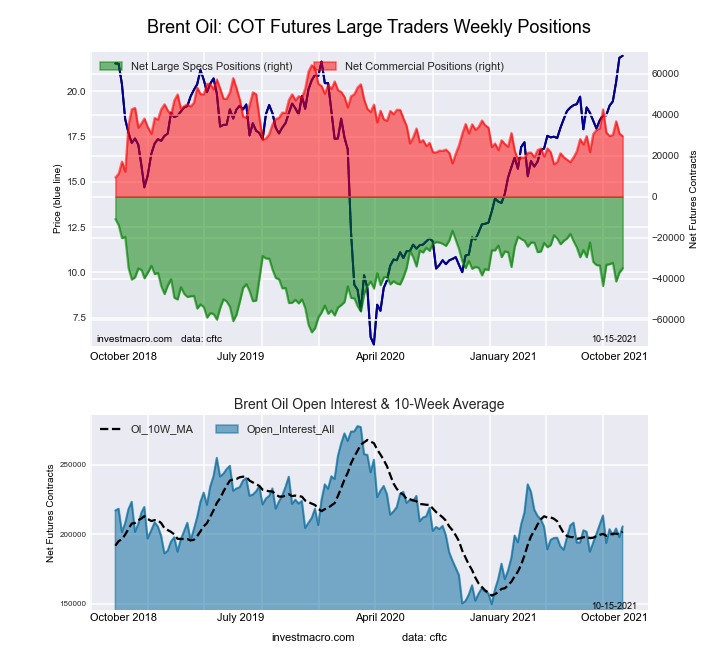
Brent Last Day Crude Oil Futures COT ChartThe Brent Crude Oil Futures large speculator standing this week came in at a net position of -34,924 contracts in the data reported through Tuesday. This was a weekly rise of 2,097 contracts from the previous week which had a total of -37,021 net contracts.

This week’s current strength score (the trader positioning range over the past three years, measured from 0 to 100) shows the speculators are currently Bullish with a score of 56.6 percent. The commercials are Bearish with a score of 36.8 percent and the small traders (not shown in chart) are Bullish-Extreme with a score of 82.4 percent.

Brent Crude Oil Futures StatisticsSPECULATORSCOMMERCIALSSMALL TRADERS
– Percent of Open Interest Longs:15.949.64.9
– Percent of Open Interest Shorts:32.935.22.3
– Net Position:-34,92429,5635,361
– Gross Longs:32,761101,89410,063
– Gross Shorts:67,68572,3314,702
– Long to Short Ratio:0.5 to 11.4 to 12.1 to 1
NET POSITION TREND:
– COT Index Score (3 Year Range Pct):56.636.882.4
– COT Index Reading (3 Year Range):BullishBearishBullish-Extreme
NET POSITION MOVEMENT INDEX:
– 6-Week Change in Strength Index:15.6-23.838.5


Natural Gas Futures:

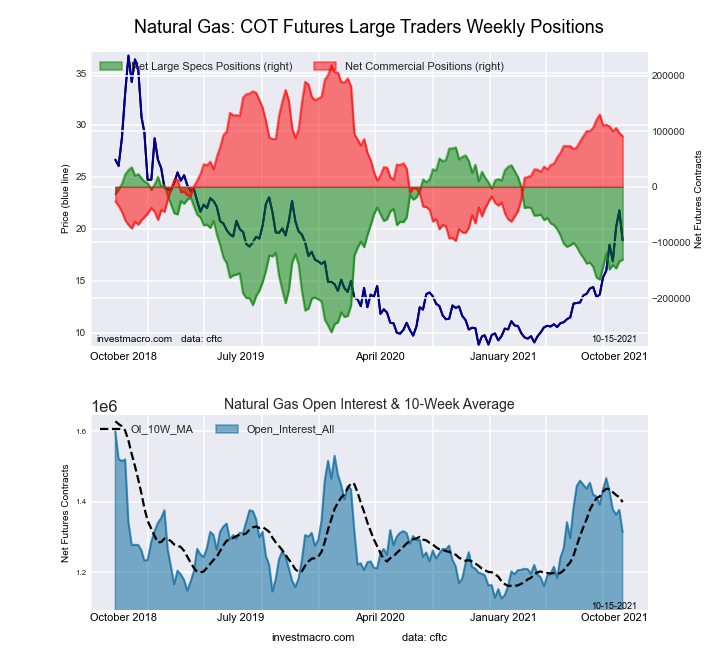
Natural Gas Futures COT ChartThe Natural Gas Futures large speculator standing this week came in at a net position of -130,902 contracts in the data reported through Tuesday. This was a weekly boost of 2,806 contracts from the previous week which had a total of -133,708 net contracts.

This week’s current strength score (the trader positioning range over the past three years, measured from 0 to 100) shows the speculators are currently Bearish with a score of 39.3 percent. The commercials are Bullish with a score of 59.6 percent and the small traders (not shown in chart) are Bullish with a score of 79.5 percent.

Natural Gas Futures StatisticsSPECULATORSCOMMERCIALSSMALL TRADERS
– Percent of Open Interest Longs:20.744.35.0
– Percent of Open Interest Shorts:30.737.42.0
– Net Position:-130,90291,20139,701
– Gross Longs:272,106582,32765,639
– Gross Shorts:403,008491,12625,938
– Long to Short Ratio:0.7 to 11.2 to 12.5 to 1
NET POSITION TREND:
– COT Index Score (3 Year Range Pct):39.359.679.5
– COT Index Reading (3 Year Range):BearishBullishBullish
NET POSITION MOVEMENT INDEX:
– 6-Week Change in Strength Index:4.1-6.013.4


Gasoline Blendstock Futures:

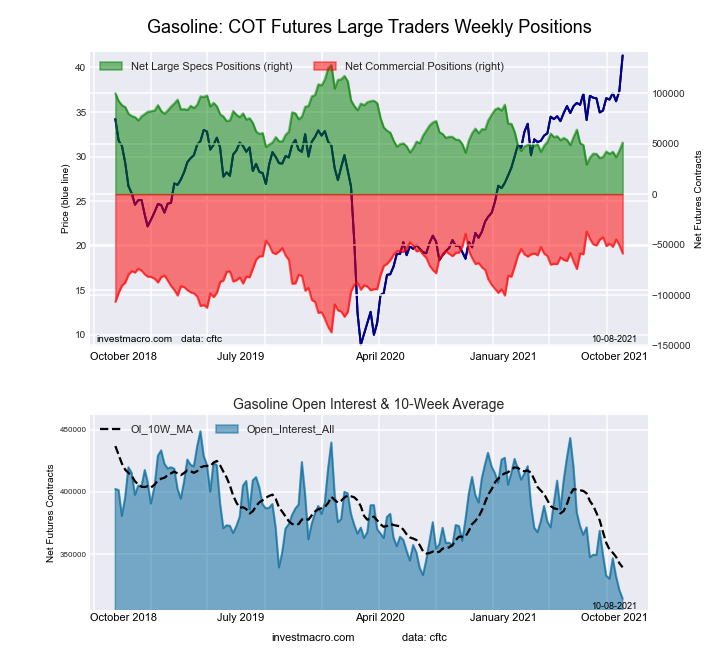
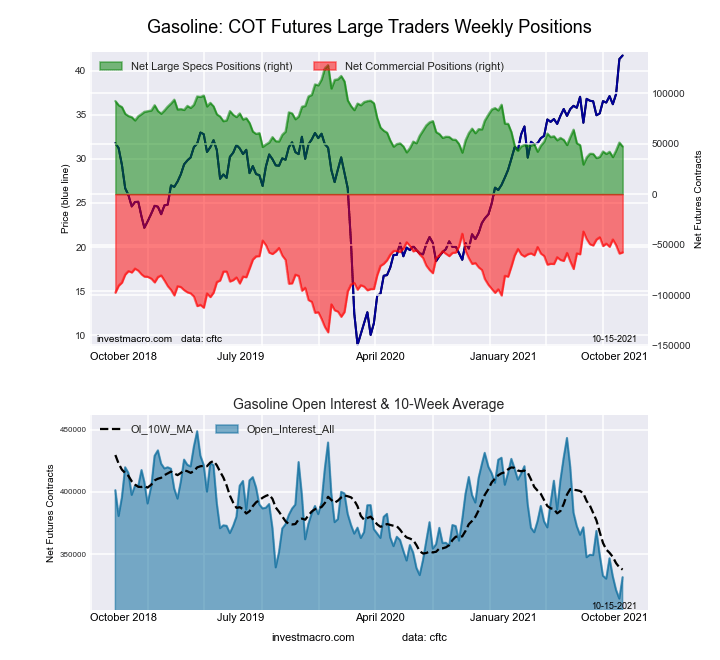
RBOB Gasoline Energy Futures COT ChartThe Gasoline Blendstock Futures large speculator standing this week came in at a net position of 47,193 contracts in the data reported through Tuesday. This was a weekly fall of -3,859 contracts from the previous week which had a total of 51,052 net contracts.

This week’s current strength score (the trader positioning range over the past three years, measured from 0 to 100) shows the speculators are currently Bearish-Extreme with a score of 18.1 percent. The commercials are Bullish with a score of 79.3 percent and the small traders (not shown in chart) are Bullish with a score of 74.7 percent.

Nasdaq Mini Futures StatisticsSPECULATORSCOMMERCIALSSMALL TRADERS
– Percent of Open Interest Longs:28.745.77.6
– Percent of Open Interest Shorts:14.563.14.4
– Net Position:47,193-57,75310,560
– Gross Longs:95,137151,40625,077
– Gross Shorts:47,944209,15914,517
– Long to Short Ratio:2.0 to 10.7 to 11.7 to 1
NET POSITION TREND:
– COT Index Score (3 Year Range Pct):18.179.374.7
– COT Index Reading (3 Year Range):Bearish-ExtremeBullishBullish
NET POSITION MOVEMENT INDEX:
– 6-Week Change in Strength Index:5.1-6.48.2


#2 Heating Oil NY-Harbor Futures:

NY Harbor Heating Oil Energy Futures COT ChartThe #2 Heating Oil NY-Harbor Futures large speculator standing this week came in at a net position of 39,137 contracts in the cot data reported through Tuesday. This was a weekly gain of 1,589 contracts from the previous week which had a total of 37,548 net contracts.

This week’s current strength score (the trader positioning range over the past three years, measured from 0 to 100) shows the speculators are currently Bullish-Extreme with a score of 100.0 percent. The commercials are Bearish-Extreme with a score of 1.3 percent and the small traders (not shown in chart) are Bullish-Extreme with a score of 90.2 percent.

Heating Oil Futures StatisticsSPECULATORSCOMMERCIALSSMALL TRADERS
– Percent of Open Interest Longs:16.949.711.6
– Percent of Open Interest Shorts:7.865.05.4
– Net Position:39,137-65,64426,507
– Gross Longs:72,833213,80849,877
– Gross Shorts:33,696279,45223,370
– Long to Short Ratio:2.2 to 10.8 to 12.1 to 1
NET POSITION TREND:
– COT Index Score (3 Year Range Pct):100.01.390.2
– COT Index Reading (3 Year Range):Bullish-ExtremeBearish-ExtremeBullish-Extreme
NET POSITION MOVEMENT INDEX:
– 6-Week Change in Strength Index:0.8-9.529.1


Bloomberg Commodity Index Futures:

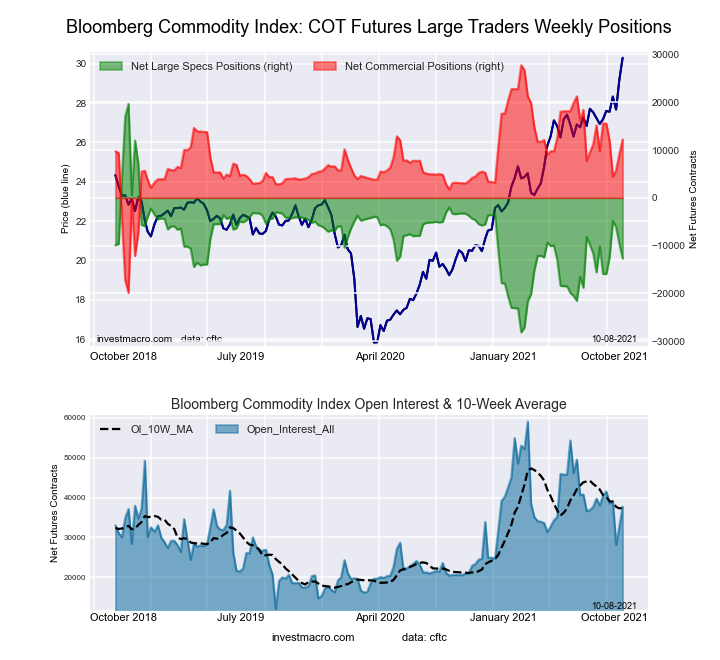
Bloomberg Commodity Index Futures COT ChartThe Bloomberg Commodity Index Futures large speculator standing this week came in at a net position of -16,117 contracts in the data reported through Tuesday. This was a weekly reduction of -3,443 contracts from the previous week which had a total of -12,674 net contracts.

This week’s current strength score (the trader positioning range over the past three years, measured from 0 to 100) shows the speculators are currently Bearish with a score of 25.1 percent. The commercials are Bullish with a score of 74.5 percent and the small traders (not shown in chart) are Bearish with a score of 47.3 percent.

Bloomberg Index Futures StatisticsSPECULATORSCOMMERCIALSSMALL TRADERS
– Percent of Open Interest Longs:51.242.61.5
– Percent of Open Interest Shorts:90.24.90.2
– Net Position:-16,11715,593524
– Gross Longs:21,17817,609621
– Gross Shorts:37,2952,01697
– Long to Short Ratio:0.6 to 18.7 to 16.4 to 1
NET POSITION TREND:
– COT Index Score (3 Year Range Pct):25.174.547.3
– COT Index Reading (3 Year Range):BearishBullishBearish
NET POSITION MOVEMENT INDEX:
– 6-Week Change in Strength Index:-0.40.17.1


Article By InvestMacro.comReceive our weekly COT Reports by Email

*COT Report: The COT data, released weekly to the public each Friday, is updated through the most recent Tuesday (data is 3 days old) and shows a quick view of how large speculators or non-commercials (for-profit traders) were positioned in the futures markets.

The CFTC categorizes trader positions according to commercial hedgers (traders who use futures contracts for hedging as part of the business), non-commercials (large traders who speculate to realize trading profits) and nonreportable traders (usually small traders/speculators).

Find CFTC criteria here: (http://www.cftc.gov/MarketReports/CommitmentsofTraders/ExplanatoryNotes/index.htm).
COT Soft Commodities Charts: Coffee Speculators push bullish bets to over 4-month high

By InvestMacro.com COT Home | Data Tables | Data Downloads | Newsletter

Here are the latest charts and statistics for the Commitment of Traders (COT) data published by the Commodities Futures Trading Commission (CFTC).

The latest COT data is updated through Tuesday October 12th 2021 and shows a quick view of how large traders (for-profit speculators and commercial entities) were positioned in the futures markets.

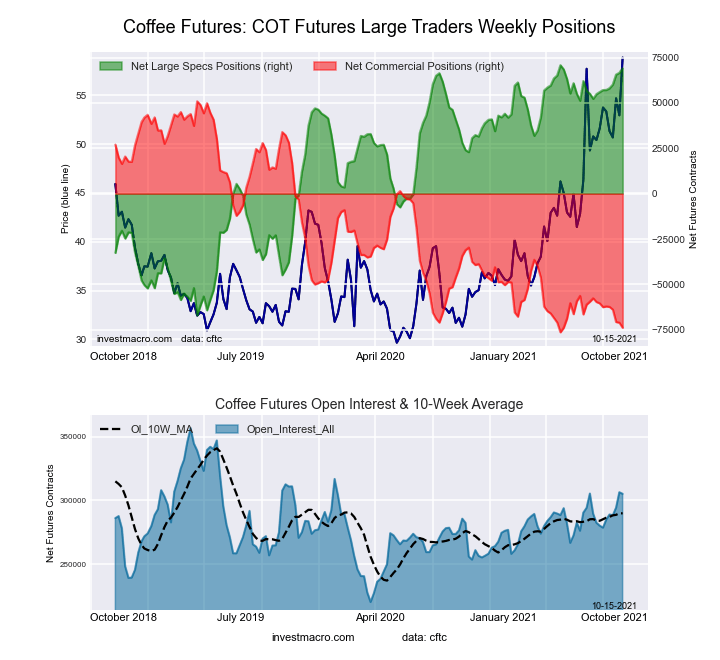
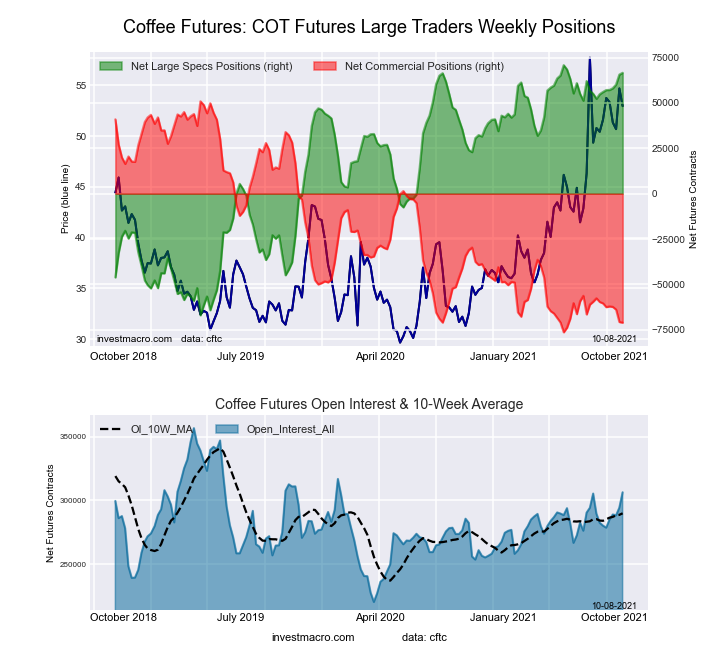
Highlighting this week’s data is Coffee which saw speculators raise their bullish net positions to the highest level in over four months. Coffee bullish bets have now increased for nine consecutive weeks and came in this week at a total of 69,085 contracts. This marks the second highest level on record and just below the all-time high set on June 1st of this year at a total of 70,773 contracts. Speculators currently have a 99 percent strength index score which means that speculative trader sentiment is at the very top of the range over the past three years.


Data Snapshot of Commodity Market Traders | Columns Legend
Oct-12-2021OIOI-IndexSpec-NetSpec-IndexCom-NetCOM-IndexSmalls-NetSmalls-Index
WTI Crude2,231,22748404,77641-453,6844648,90884
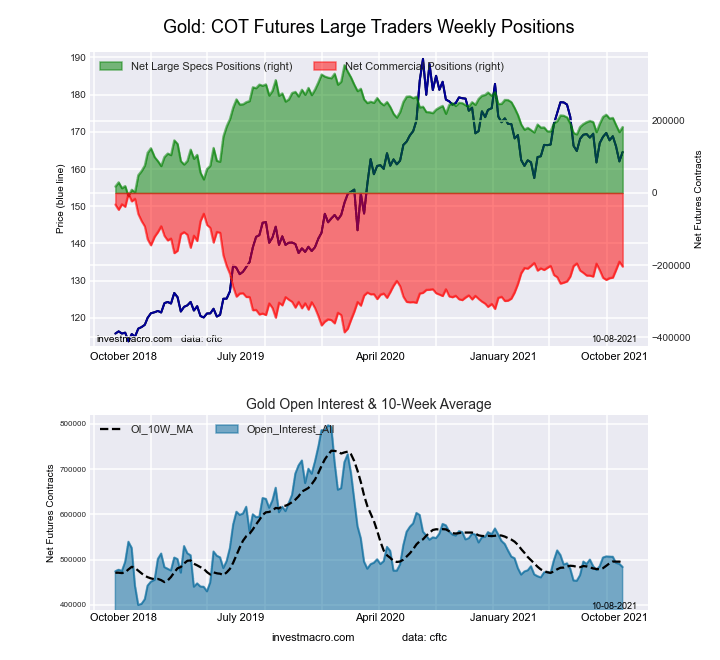
Gold484,38221185,53954-207,6144622,07533
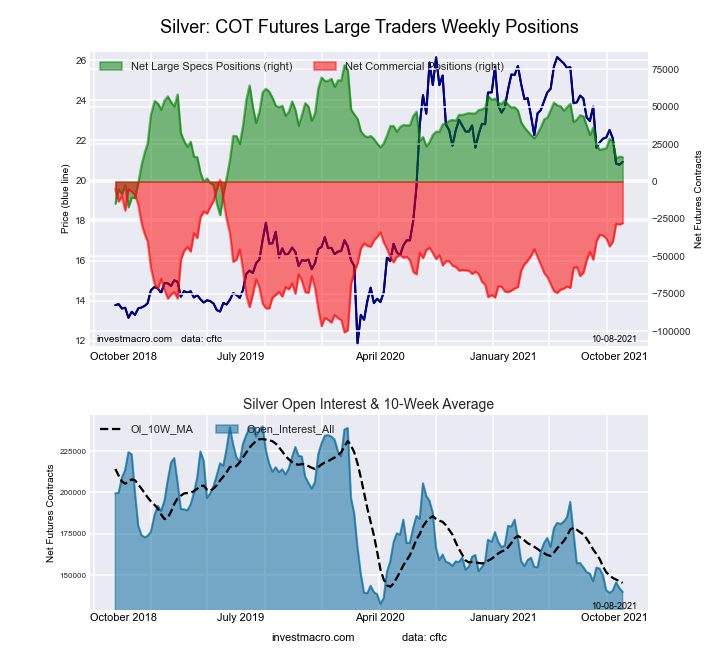
Silver139,403617,98740-30,2926912,30511
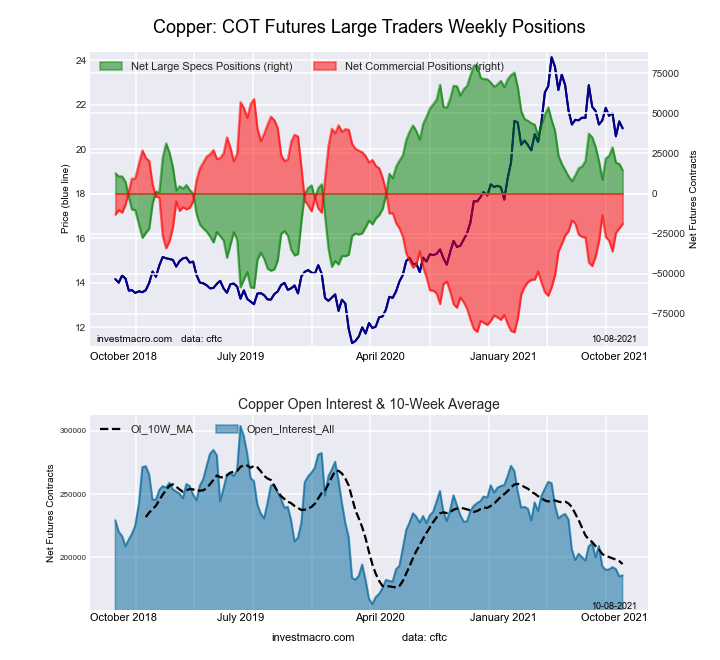
Copper194,8172322,48159-25,867423,38645
Palladium9,29613-2,49642,62595-12937
Platinum59,3442110,91918-16,756855,83743
Natural Gas1,314,02240-130,9023991,2016039,70179
Brent205,52144-34,9245729,563375,36182
Heating Oil429,9086839,137100-65,644126,50790
Soybeans759,1013541,99041-9,66564-32,32518
Corn1,400,3774279,28866-223,33640-55,95211
Coffee305,1416269,08599-73,80824,72321
Sugar891,67225246,18887-294,6741248,48668
Wheat385,20423-4,5344312,96953-8,43561


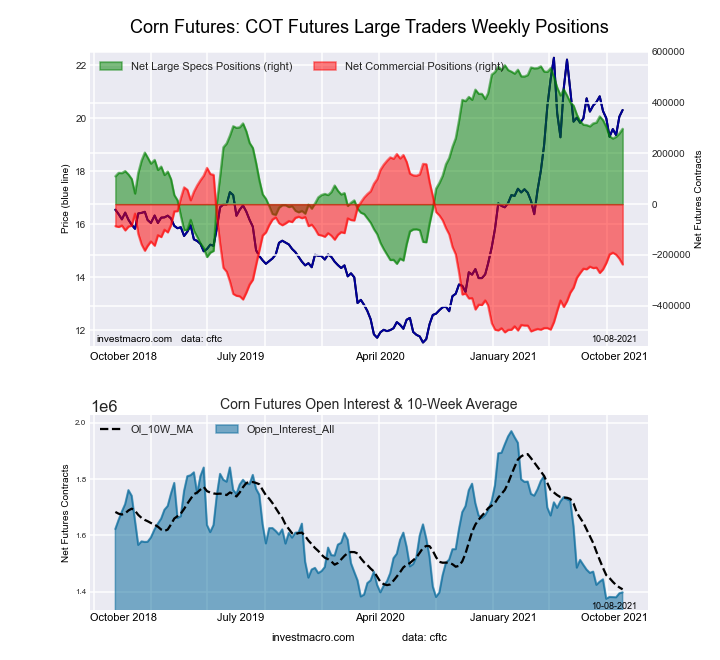
CORN Futures:

Federal Funds 30-Day Bonds Futures COT ChartThe CORN large speculator standing this week reached a net position of 279,288 contracts in the data reported through Tuesday. This was a weekly reduction of -17,717 contracts from the previous week which had a total of 297,005 net contracts.

This week’s current strength score (the trader positioning range over the past three years, measured from 0 to 100) shows the speculators are currently Bullish with a score of 65.7 percent. The commercials are Bearish with a score of 40.1 percent and the small traders (not shown in chart) are Bearish-Extreme with a score of 10.8 percent.

CORN Futures StatisticsSPECULATORSCOMMERCIALSSMALL TRADERS
– Percent of Open Interest Longs:28.849.09.3
– Percent of Open Interest Shorts:8.864.913.3
– Net Position:279,288-223,336-55,952
– Gross Longs:402,726685,667130,383
– Gross Shorts:123,438909,003186,335
– Long to Short Ratio:3.3 to 10.8 to 10.7 to 1
NET POSITION TREND:
– COT Index Score (3 Year Range Pct):65.740.110.8
– COT Index Reading (3 Year Range):BullishBearishBearish-Extreme
NET POSITION MOVEMENT INDEX:
– 6-Week Change in Strength Index:-3.21.29.4


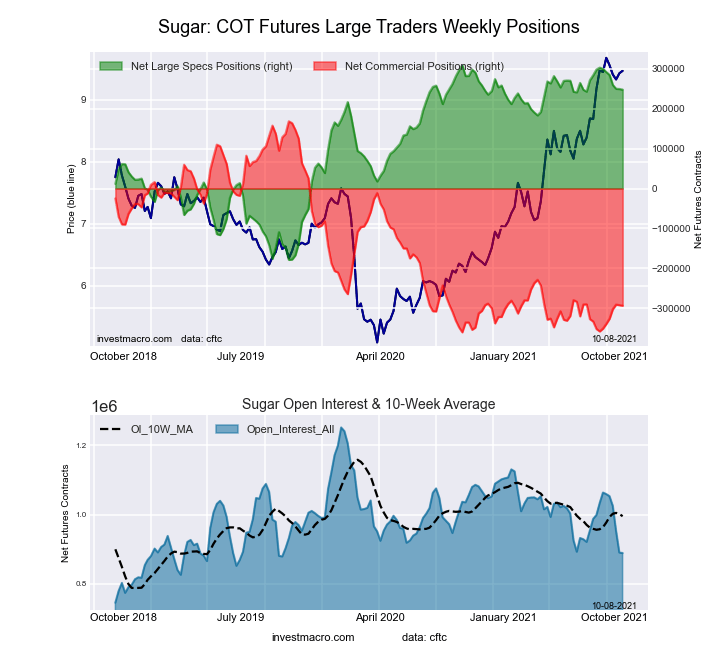
SUGAR Futures:

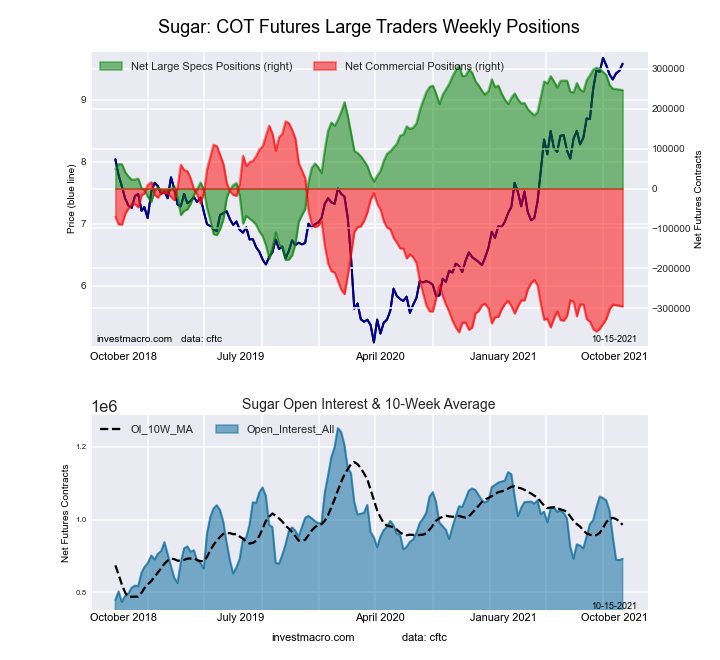
2-Year Treasury Bonds Futures COT ChartThe SUGAR large speculator standing this week reached a net position of 246,188 contracts in the data reported through Tuesday. This was a weekly fall of -1,187 contracts from the previous week which had a total of 247,375 net contracts.

This week’s current strength score (the trader positioning range over the past three years, measured from 0 to 100) shows the speculators are currently Bullish-Extreme with a score of 87.2 percent. The commercials are Bearish-Extreme with a score of 12.3 percent and the small traders (not shown in chart) are Bullish with a score of 67.8 percent.

SUGAR Futures StatisticsSPECULATORSCOMMERCIALSSMALL TRADERS
– Percent of Open Interest Longs:33.041.910.7
– Percent of Open Interest Shorts:5.474.95.3
– Net Position:246,188-294,67448,486
– Gross Longs:294,624373,27795,832
– Gross Shorts:48,436667,95147,346
– Long to Short Ratio:6.1 to 10.6 to 12.0 to 1
NET POSITION TREND:
– COT Index Score (3 Year Range Pct):87.212.367.8
– COT Index Reading (3 Year Range):Bullish-ExtremeBearish-ExtremeBullish
NET POSITION MOVEMENT INDEX:
– 6-Week Change in Strength Index:-9.38.41.4


COFFEE Futures:

5-Year Treasury Bonds Futures COT ChartThe COFFEE large speculator standing this week reached a net position of 69,085 contracts in the data reported through Tuesday. This was a weekly boost of 2,514 contracts from the previous week which had a total of 66,571 net contracts.

This week’s current strength score (the trader positioning range over the past three years, measured from 0 to 100) shows the speculators are currently Bullish-Extreme with a score of 98.8 percent. The commercials are Bearish-Extreme with a score of 2.0 percent and the small traders (not shown in chart) are Bearish with a score of 21.0 percent.

COFFEE Futures StatisticsSPECULATORSCOMMERCIALSSMALL TRADERS
– Percent of Open Interest Longs:27.939.73.9
– Percent of Open Interest Shorts:5.363.92.4
– Net Position:69,085-73,8084,723
– Gross Longs:85,275121,29112,017
– Gross Shorts:16,190195,0997,294
– Long to Short Ratio:5.3 to 10.6 to 11.6 to 1
NET POSITION TREND:
– COT Index Score (3 Year Range Pct):98.82.021.0
– COT Index Reading (3 Year Range):Bullish-ExtremeBearish-ExtremeBearish
NET POSITION MOVEMENT INDEX:
– 6-Week Change in Strength Index:8.7-8.9-4.7


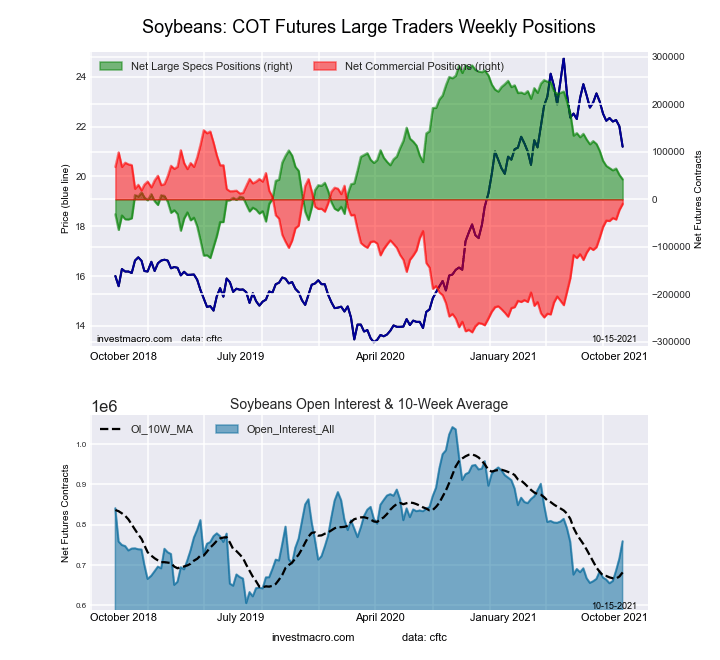
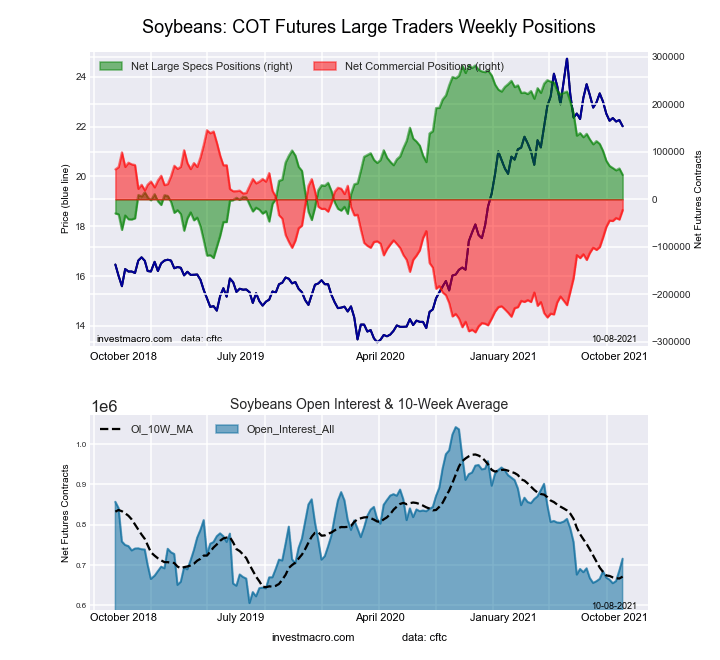
SOYBEANS Futures:

10-Year Treasury Notes Bonds Futures COT ChartThe SOYBEANS large speculator standing this week reached a net position of 41,990 contracts in the data reported through Tuesday. This was a weekly decline of -9,411 contracts from the previous week which had a total of 51,401 net contracts.

This week’s current strength score (the trader positioning range over the past three years, measured from 0 to 100) shows the speculators are currently Bearish with a score of 40.8 percent. The commercials are Bullish with a score of 63.5 percent and the small traders (not shown in chart) are Bearish-Extreme with a score of 18.1 percent.

SOYBEANS Futures StatisticsSPECULATORSCOMMERCIALSSMALL TRADERS
– Percent of Open Interest Longs:17.758.26.5
– Percent of Open Interest Shorts:12.259.510.7
– Net Position:41,990-9,665-32,325
– Gross Longs:134,258441,82748,964
– Gross Shorts:92,268451,49281,289
– Long to Short Ratio:1.5 to 11.0 to 10.6 to 1
NET POSITION TREND:
– COT Index Score (3 Year Range Pct):40.863.518.1
– COT Index Reading (3 Year Range):BearishBullishBearish-Extreme
NET POSITION MOVEMENT INDEX:
– 6-Week Change in Strength Index:-9.711.4-15.6


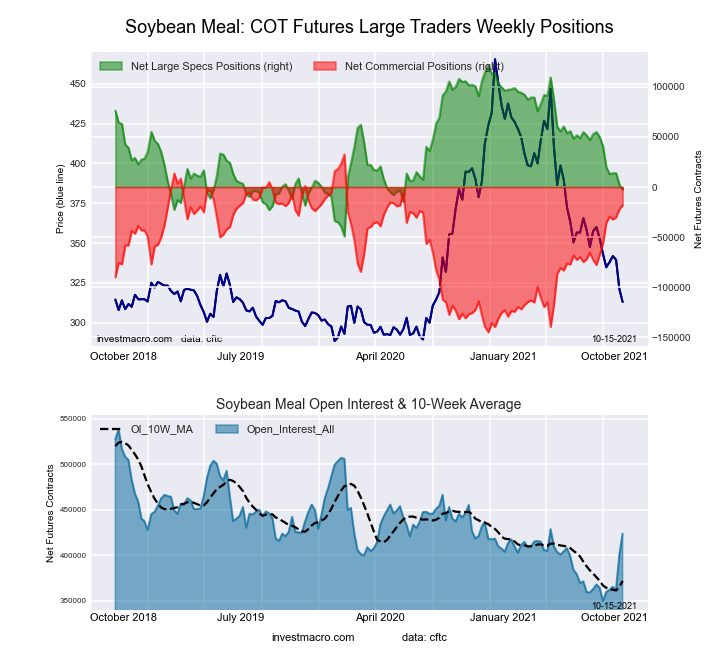
SOYBEAN MEAL Futures:

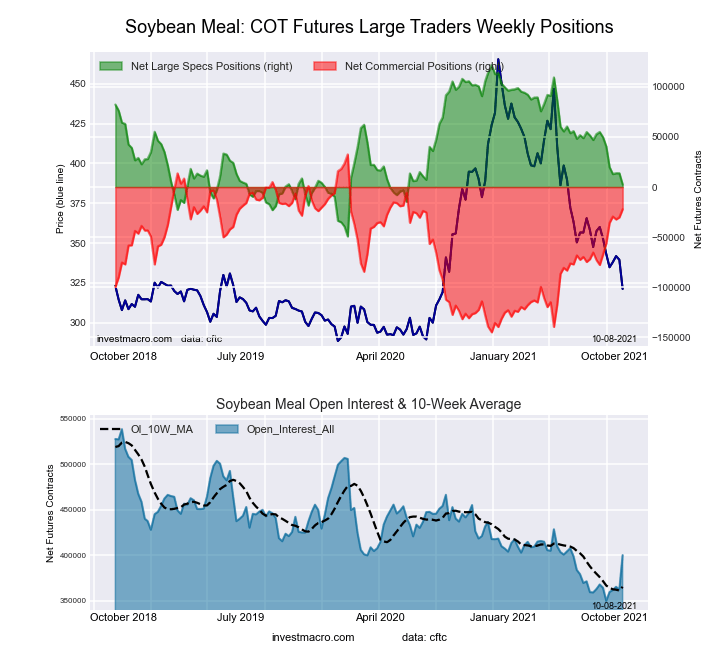
US Year Treasury Notes Long Bonds Futures COT ChartThe SOYBEAN MEAL large speculator standing this week reached a net position of -2,587 contracts in the data reported through Tuesday. This was a weekly fall of -5,049 contracts from the previous week which had a total of 2,462 net contracts.

This week’s current strength score (the trader positioning range over the past three years, measured from 0 to 100) shows the speculators are currently Bearish with a score of 27.3 percent. The commercials are Bullish with a score of 71.5 percent and the small traders (not shown in chart) are Bullish with a score of 53.4 percent.

SOYBEAN MEAL Futures StatisticsSPECULATORSCOMMERCIALSSMALL TRADERS
– Percent of Open Interest Longs:19.749.012.2
– Percent of Open Interest Shorts:20.353.37.3
– Net Position:-2,587-18,05620,643
– Gross Longs:83,287207,66751,696
– Gross Shorts:85,874225,72331,053
– Long to Short Ratio:1.0 to 10.9 to 11.7 to 1
NET POSITION TREND:
– COT Index Score (3 Year Range Pct):27.371.553.4
– COT Index Reading (3 Year Range):BearishBullishBullish
NET POSITION MOVEMENT INDEX:
– 6-Week Change in Strength Index:-25.221.519.5


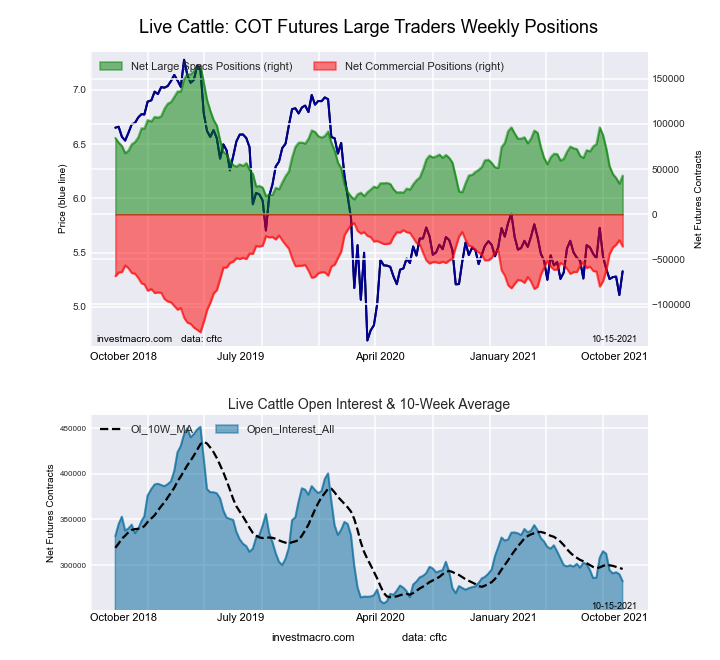
LIVE CATTLE Futures:

Ultra US Year Treasury Notes Long Bonds Futures COT ChartThe LIVE CATTLE large speculator standing this week reached a net position of 42,789 contracts in the data reported through Tuesday. This was a weekly gain of 8,937 contracts from the previous week which had a total of 33,852 net contracts.

This week’s current strength score (the trader positioning range over the past three years, measured from 0 to 100) shows the speculators are currently Bearish-Extreme with a score of 17.7 percent. The commercials are Bullish with a score of 78.5 percent and the small traders (not shown in chart) are Bullish with a score of 70.2 percent.

LIVE CATTLE Futures StatisticsSPECULATORSCOMMERCIALSSMALL TRADERS
– Percent of Open Interest Longs:32.444.410.8
– Percent of Open Interest Shorts:17.357.113.3
– Net Position:42,789-35,822-6,967
– Gross Longs:91,514125,28030,551
– Gross Shorts:48,725161,10237,518
– Long to Short Ratio:1.9 to 10.8 to 10.8 to 1
NET POSITION TREND:
– COT Index Score (3 Year Range Pct):17.778.570.2
– COT Index Reading (3 Year Range):Bearish-ExtremeBullishBullish
NET POSITION MOVEMENT INDEX:
– 6-Week Change in Strength Index:-30.131.615.8


LEAN HOGS Futures:

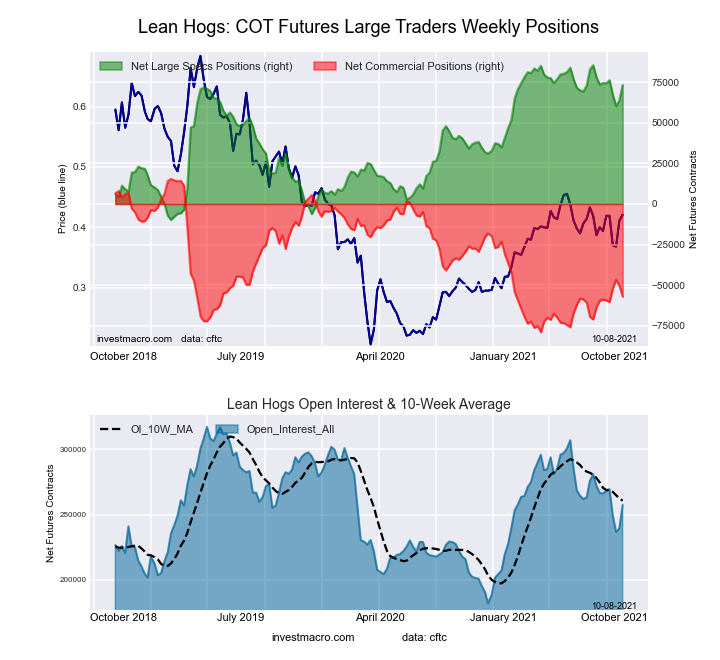
Eurodollar Bonds Futures COT ChartThe LEAN HOGS large speculator standing this week reached a net position of 71,544 contracts in the data reported through Tuesday. This was a weekly lowering of -1,885 contracts from the previous week which had a total of 73,429 net contracts.

This week’s current strength score (the trader positioning range over the past three years, measured from 0 to 100) shows the speculators are currently Bullish-Extreme with a score of 85.3 percent. The commercials are Bearish with a score of 26.4 percent and the small traders (not shown in chart) are Bearish-Extreme with a score of 0.0 percent.

LEAN HOGS Futures StatisticsSPECULATORSCOMMERCIALSSMALL TRADERS
– Percent of Open Interest Longs:42.930.17.3
– Percent of Open Interest Shorts:14.451.614.2
– Net Position:71,544-54,143-17,401
– Gross Longs:107,88175,60618,368
– Gross Shorts:36,337129,74935,769
– Long to Short Ratio:3.0 to 10.6 to 10.5 to 1
NET POSITION TREND:
– COT Index Score (3 Year Range Pct):85.326.40.0
– COT Index Reading (3 Year Range):Bullish-ExtremeBearishBearish-Extreme
NET POSITION MOVEMENT INDEX:
– 6-Week Change in Strength Index:-3.15.6-10.6


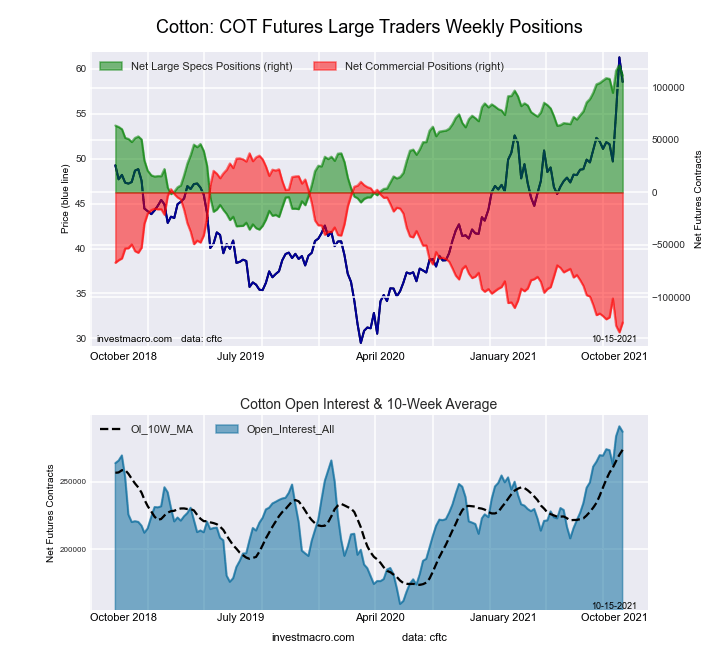
COTTON Futures:

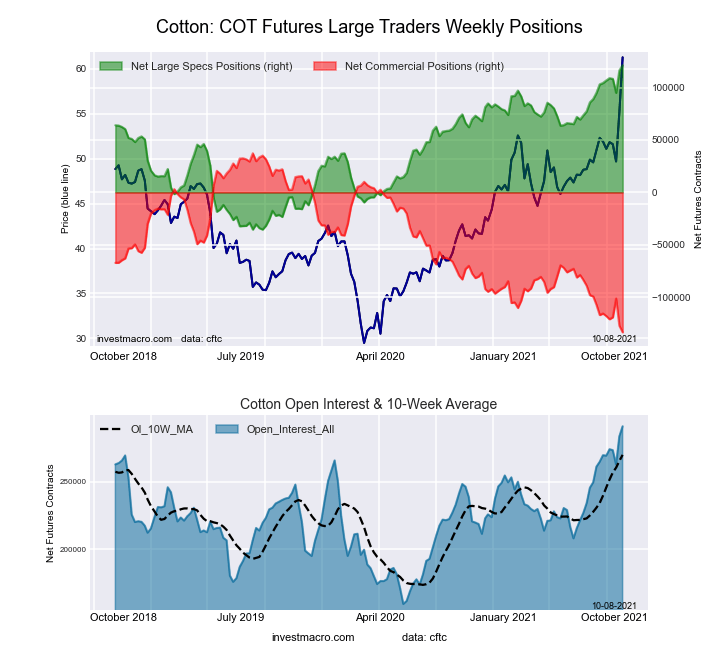
Ultra 10-Year Treasury Notes Bonds Futures COT ChartThe COTTON large speculator standing this week reached a net position of 111,391 contracts in the data reported through Tuesday. This was a weekly fall of -9,895 contracts from the previous week which had a total of 121,286 net contracts.

This week’s current strength score (the trader positioning range over the past three years, measured from 0 to 100) shows the speculators are currently Bullish-Extreme with a score of 93.7 percent. The commercials are Bearish-Extreme with a score of 5.4 percent and the small traders (not shown in chart) are Bullish-Extreme with a score of 92.6 percent.

COTTON Futures StatisticsSPECULATORSCOMMERCIALSSMALL TRADERS
– Percent of Open Interest Longs:43.335.87.5
– Percent of Open Interest Shorts:4.579.03.1
– Net Position:111,391-124,04912,658
– Gross Longs:124,338102,68221,438
– Gross Shorts:12,947226,7318,780
– Long to Short Ratio:9.6 to 10.5 to 12.4 to 1
NET POSITION TREND:
– COT Index Score (3 Year Range Pct):93.75.492.6
– COT Index Reading (3 Year Range):Bullish-ExtremeBearish-ExtremeBullish-Extreme
NET POSITION MOVEMENT INDEX:
– 6-Week Change in Strength Index:3.0-3.69.6


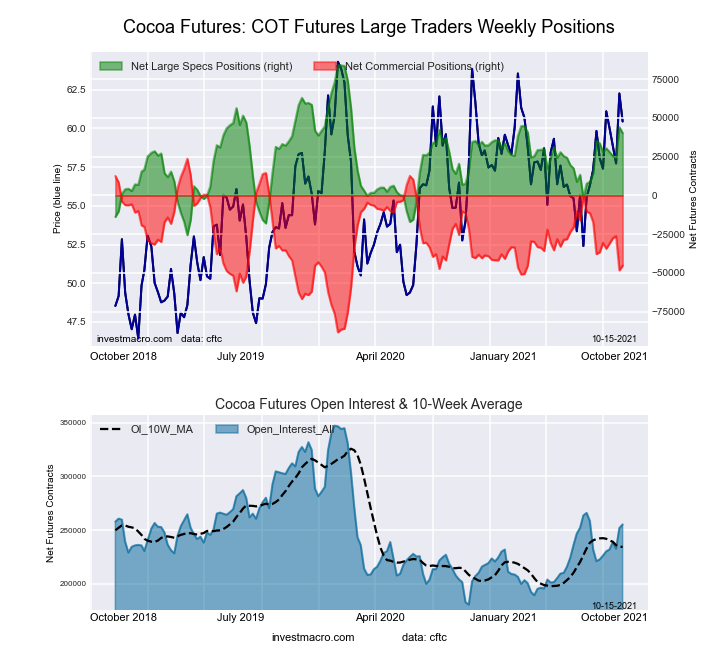
COCOA Futures:

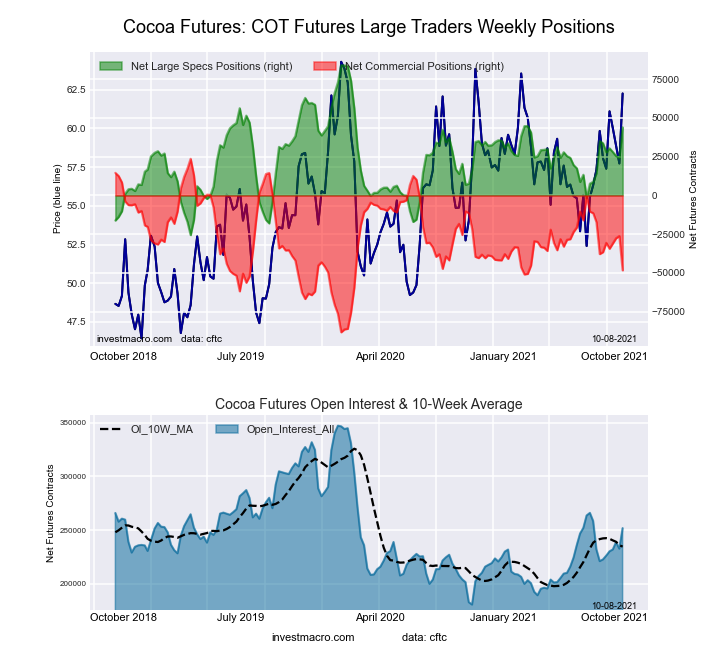
US Year Treasury Notes Long Bonds Futures COT ChartThe COCOA large speculator standing this week reached a net position of 40,221 contracts in the data reported through Tuesday. This was a weekly reduction of -3,776 contracts from the previous week which had a total of 43,997 net contracts.

This week’s current strength score (the trader positioning range over the past three years, measured from 0 to 100) shows the speculators are currently Bullish with a score of 60.0 percent. The commercials are Bearish with a score of 38.4 percent and the small traders (not shown in chart) are Bullish with a score of 66.2 percent.

COCOA Futures StatisticsSPECULATORSCOMMERCIALSSMALL TRADERS
– Percent of Open Interest Longs:30.845.15.2
– Percent of Open Interest Shorts:15.062.93.2
– Net Position:40,221-45,2995,078
– Gross Longs:78,546115,11813,171
– Gross Shorts:38,325160,4178,093
– Long to Short Ratio:2.0 to 10.7 to 11.6 to 1
NET POSITION TREND:
– COT Index Score (3 Year Range Pct):60.038.466.2
– COT Index Reading (3 Year Range):BullishBearishBullish
NET POSITION MOVEMENT INDEX:
– 6-Week Change in Strength Index:11.2-13.127.2


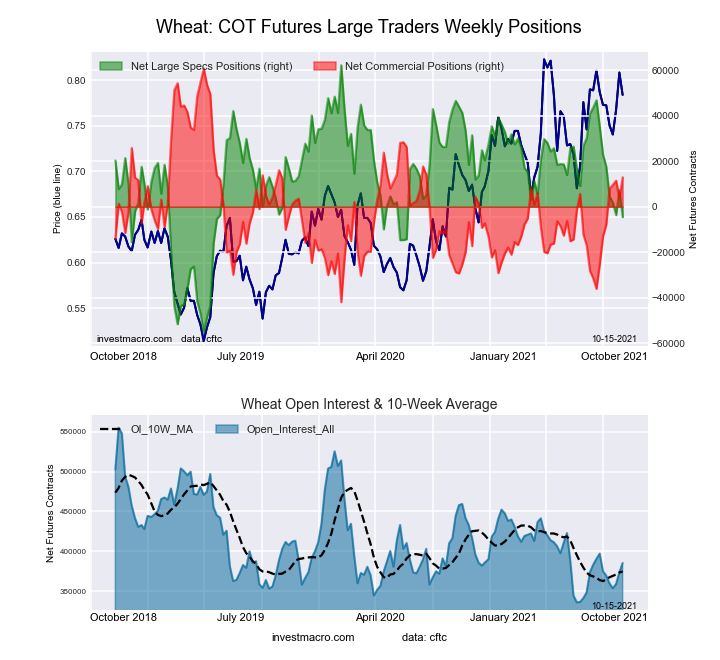
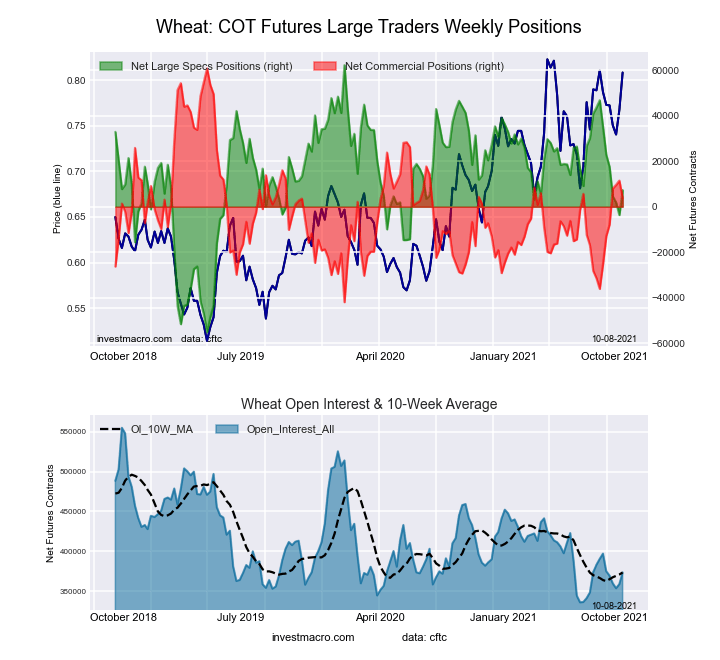
WHEAT Futures:

Ultra US Year Treasury Notes Long Bonds Futures COT ChartThe WHEAT large speculator standing this week reached a net position of -4,534 contracts in the data reported through Tuesday. This was a weekly fall of -11,846 contracts from the previous week which had a total of 7,312 net contracts.

This week’s current strength score (the trader positioning range over the past three years, measured from 0 to 100) shows the speculators are currently Bearish with a score of 43.1 percent. The commercials are Bullish with a score of 53.5 percent and the small traders (not shown in chart) are Bullish with a score of 61.3 percent.

WHEAT Futures StatisticsSPECULATORSCOMMERCIALSSMALL TRADERS
– Percent of Open Interest Longs:24.641.38.1
– Percent of Open Interest Shorts:25.837.910.3
– Net Position:-4,53412,969-8,435
– Gross Longs:94,728159,13131,296
– Gross Shorts:99,262146,16239,731
– Long to Short Ratio:1.0 to 11.1 to 10.8 to 1
NET POSITION TREND:
– COT Index Score (3 Year Range Pct):43.153.561.3
– COT Index Reading (3 Year Range):BearishBullishBullish
NET POSITION MOVEMENT INDEX:
– 6-Week Change in Strength Index:-23.325.26.8


Article By InvestMacro.comReceive our weekly COT Reports by Email

*COT Report: The COT data, released weekly to the public each Friday, is updated through the most recent Tuesday (data is 3 days old) and shows a quick view of how large speculators or non-commercials (for-profit traders) were positioned in the futures markets.

The CFTC categorizes trader positions according to commercial hedgers (traders who use futures contracts for hedging as part of the business), non-commercials (large traders who speculate to realize trading profits) and nonreportable traders (usually small traders/speculators).

Find CFTC criteria here: (http://www.cftc.gov/MarketReports/CommitmentsofTraders/ExplanatoryNotes/index.htm).
COT Currency Charts: US Dollar Index Speculators boost bullish bets to 103-Week high

By InvestMacro.com COT Home | Data Tables | Data Downloads | Newsletter

Here are the latest charts and statistics for the Commitment of Traders (COT) data published by the Commodities Futures Trading Commission (CFTC).

The latest COT data is updated through Tuesday October 5th 2021 and shows a quick view of how large traders (for-profit speculators and commercial entities) were positioned in the futures markets. All currency positions are in direct relation to the US dollar where, for example, a bet for the euro is a bet that the euro will rise versus the dollar while a bet against the euro will be a bet that the euro will decline versus the dollar.

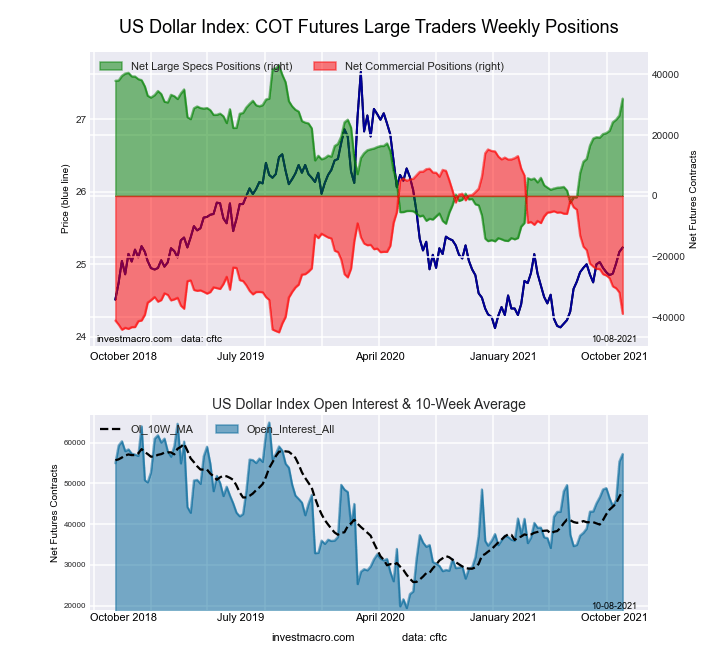
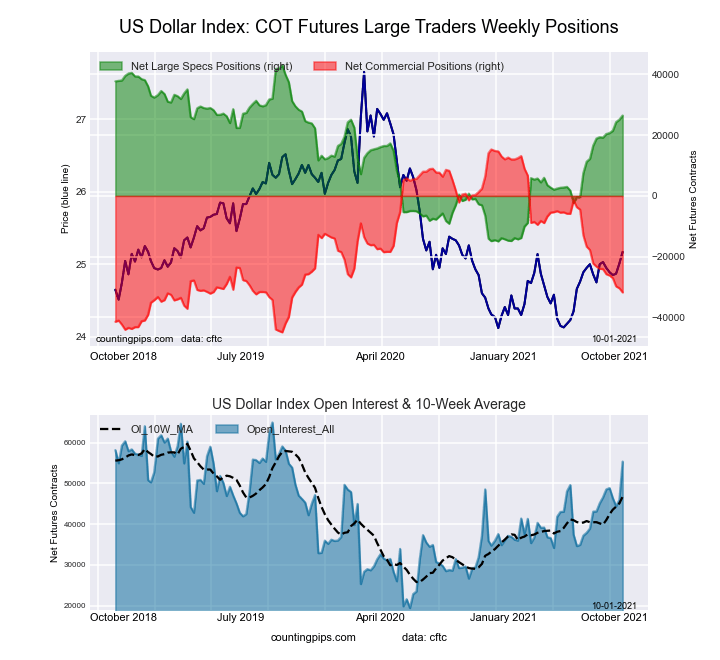
Highlighting the currency COT data this week is the US Dollar Index positioning. Speculators increased their bullish bets this week by +5,565 contracts which marked the largest one-week gain in three months. The bullish speculator position has now risen for seven straight weeks and for fifteen out of the past sixteen weeks. This bullishness has brought the current bullish standing for US Dollar Index speculators to the highest level in the past 103 weeks, dating back to October 15th of 2019.


Data Snapshot of Forex Market Traders | Columns Legend
Oct-05-2021OIOI-IndexSpec-NetSpec-IndexCom-NetCOM-IndexSmalls-NetSmalls-Index
USD Index57,1948332,02681-38,817106,791100
EUR693,59182-22,33428-8,4877330,82129
GBP182,33827-20,0186025,67645-5,65844
JPY226,37995-63,6942984,46379-20,7698
CHF55,97036-15,6794329,58664-13,90722
CAD120,16810-26,8663315,4556111,41164
AUD188,69174-89,9790108,693100-18,71410
NZD35,861168,05685-7,88618-17051
MXN168,11933-35,579033,6931001,88651
RUB52,9135820,40962-22,491342,082100
BRL22,97620-2,290661,269351,02179
Bitcoin8,88651-1,51861554096421


US Dollar Index Futures:

Federal Funds 30-Day Bonds Futures COT ChartThe US Dollar Index large speculator standing this week was a net position of 32,026 contracts in the data reported through Tuesday. This was a weekly advance of 5,565 contracts from the previous week which had a total of 26,461 net contracts.

This week’s current strength score (the trader positioning range over the past three years, measured from 0 to 100) shows the speculators are currently Bullish-Extreme with a score of 81.0 percent. The commercials are Bearish-Extreme with a score of 10.1 percent and the small traders (not shown in chart) are Bullish-Extreme with a score of 100.0 percent.

US DOLLAR INDEX StatisticsSPECULATORSCOMMERCIALSSMALL TRADERS
– Percent of Open Interest Longs:78.23.314.9
– Percent of Open Interest Shorts:22.271.23.1
– Net Position:32,026-38,8176,791
– Gross Longs:44,7151,8798,543
– Gross Shorts:12,68940,6961,752
– Long to Short Ratio:3.5 to 10.0 to 14.9 to 1
NET POSITION TREND:
– COT Index Score (3 Year Range Pct):81.010.1100.0
– COT Index Reading (3 Year Range):Bullish-ExtremeBearish-ExtremeBullish-Extreme
NET POSITION MOVEMENT INDEX:
– 6-Week Change in Strength Index:20.1-21.716.8


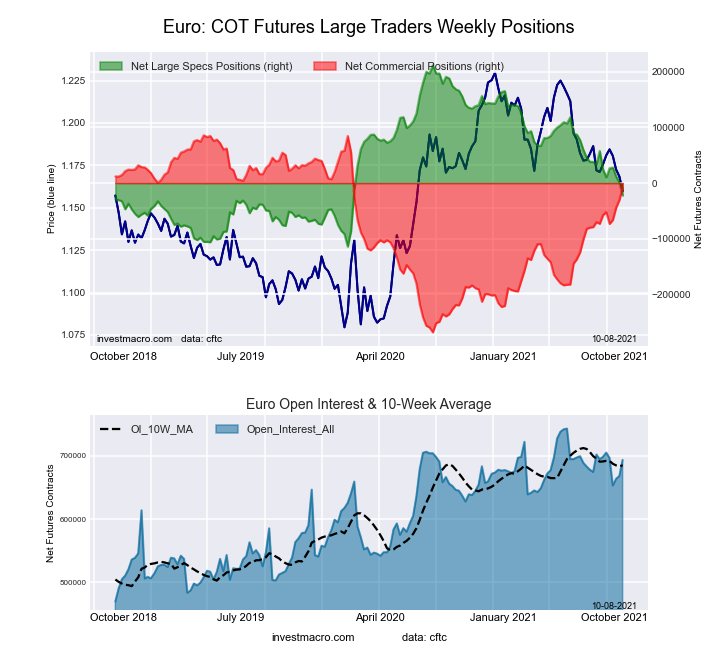
Euro Currency Futures:

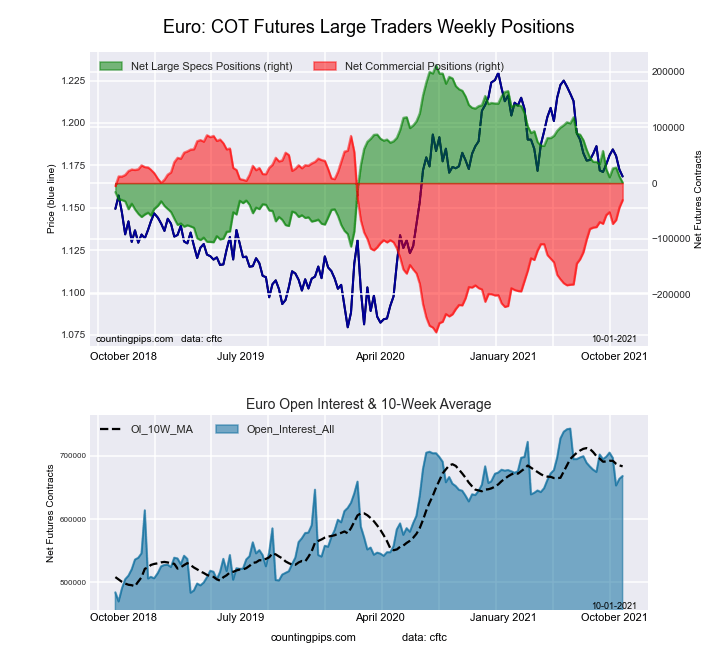
2-Year Treasury Bonds Futures COT ChartThe Euro Currency large speculator standing this week was a net position of -22,334 contracts in the data reported through Tuesday. This was a weekly decline of -23,206 contracts from the previous week which had a total of 872 net contracts.

This week’s current strength score (the trader positioning range over the past three years, measured from 0 to 100) shows the speculators are currently Bearish with a score of 28.1 percent. The commercials are Bullish with a score of 73.3 percent and the small traders (not shown in chart) are Bearish with a score of 28.8 percent.

EURO Currency StatisticsSPECULATORSCOMMERCIALSSMALL TRADERS
– Percent of Open Interest Longs:28.457.213.1
– Percent of Open Interest Shorts:31.658.48.6
– Net Position:-22,334-8,48730,821
– Gross Longs:196,819396,53490,564
– Gross Shorts:219,153405,02159,743
– Long to Short Ratio:0.9 to 11.0 to 11.5 to 1
NET POSITION TREND:
– COT Index Score (3 Year Range Pct):28.173.328.8
– COT Index Reading (3 Year Range):BearishBullishBearish
NET POSITION MOVEMENT INDEX:
– 6-Week Change in Strength Index:-14.413.8-3.1


British Pound Sterling Futures:

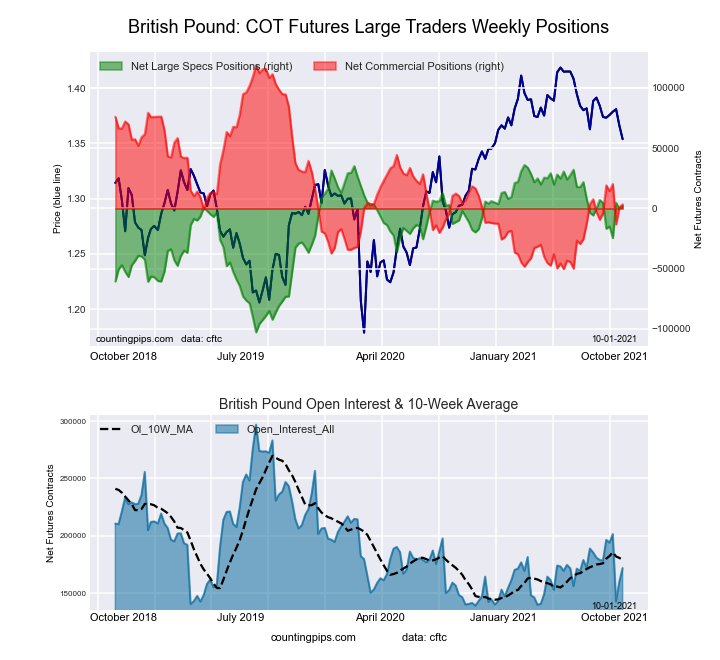
5-Year Treasury Bonds Futures COT ChartThe British Pound Sterling large speculator standing this week was a net position of -20,018 contracts in the data reported through Tuesday. This was a weekly lowering of -21,982 contracts from the previous week which had a total of 1,964 net contracts.

This week’s current strength score (the trader positioning range over the past three years, measured from 0 to 100) shows the speculators are currently Bullish with a score of 59.6 percent. The commercials are Bearish with a score of 44.9 percent and the small traders (not shown in chart) are Bearish with a score of 43.9 percent.

BRITISH POUND StatisticsSPECULATORSCOMMERCIALSSMALL TRADERS
– Percent of Open Interest Longs:26.458.114.1
– Percent of Open Interest Shorts:37.444.017.2
– Net Position:-20,01825,676-5,658
– Gross Longs:48,137105,89925,681
– Gross Shorts:68,15580,22331,339
– Long to Short Ratio:0.7 to 11.3 to 10.8 to 1
NET POSITION TREND:
– COT Index Score (3 Year Range Pct):59.644.943.9
– COT Index Reading (3 Year Range):BullishBearishBearish
NET POSITION MOVEMENT INDEX:
– 6-Week Change in Strength Index:-2.43.8-6.7


Japanese Yen Futures:

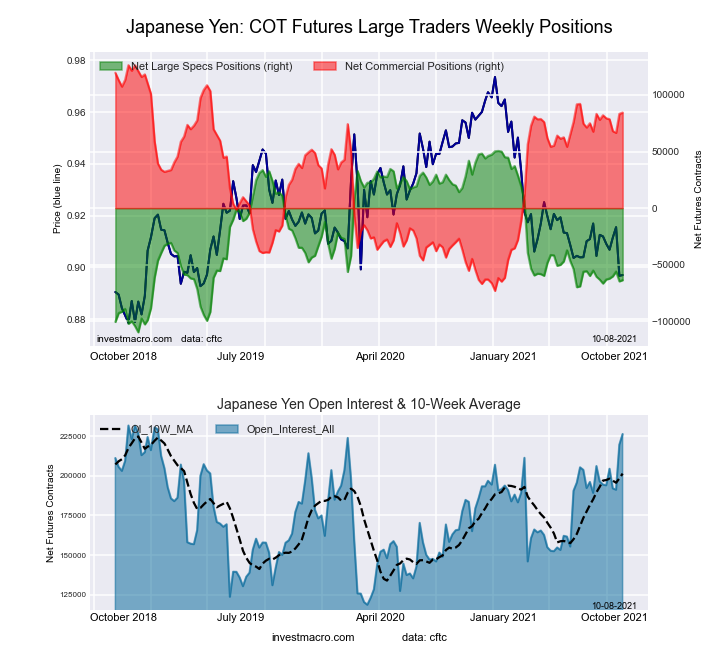
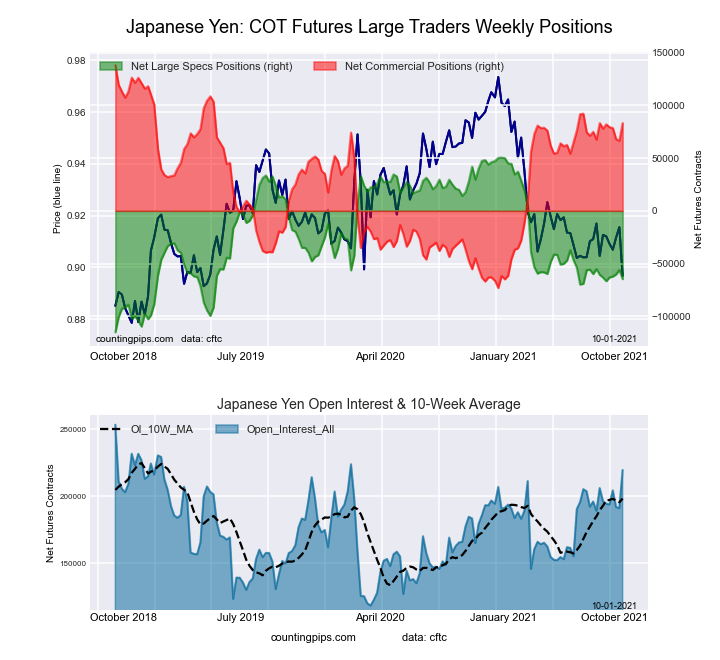
10-Year Treasury Notes Bonds Futures COT ChartThe Japanese Yen large speculator standing this week was a net position of -63,694 contracts in the data reported through Tuesday. This was a weekly gain of 1,066 contracts from the previous week which had a total of -64,760 net contracts.

This week’s current strength score (the trader positioning range over the past three years, measured from 0 to 100) shows the speculators are currently Bearish with a score of 28.7 percent. The commercials are Bullish with a score of 79.0 percent and the small traders (not shown in chart) are Bearish-Extreme with a score of 7.5 percent.

JAPANESE YEN StatisticsSPECULATORSCOMMERCIALSSMALL TRADERS
– Percent of Open Interest Longs:13.977.48.1
– Percent of Open Interest Shorts:42.140.117.3
– Net Position:-63,69484,463-20,769
– Gross Longs:31,569175,16018,406
– Gross Shorts:95,26390,69739,175
– Long to Short Ratio:0.3 to 11.9 to 10.5 to 1
NET POSITION TREND:
– COT Index Score (3 Year Range Pct):28.779.07.5
– COT Index Reading (3 Year Range):BearishBullishBearish-Extreme
NET POSITION MOVEMENT INDEX:
– 6-Week Change in Strength Index:1.91.2-11.4


Swiss Franc Futures:

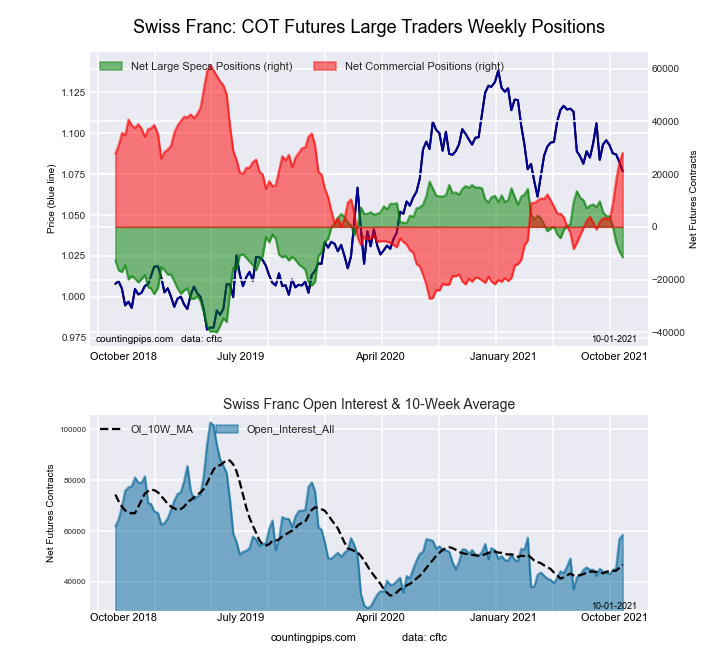
Ultra 10-Year Treasury Notes Bonds Futures COT ChartThe Swiss Franc large speculator standing this week was a net position of -15,679 contracts in the data reported through Tuesday. This was a weekly lowering of -4,092 contracts from the previous week which had a total of -11,587 net contracts.

This week’s current strength score (the trader positioning range over the past three years, measured from 0 to 100) shows the speculators are currently Bearish with a score of 42.6 percent. The commercials are Bullish with a score of 64.2 percent and the small traders (not shown in chart) are Bearish with a score of 22.5 percent.

SWISS FRANC StatisticsSPECULATORSCOMMERCIALSSMALL TRADERS
– Percent of Open Interest Longs:4.179.716.2
– Percent of Open Interest Shorts:32.126.941.0
– Net Position:-15,67929,586-13,907
– Gross Longs:2,27444,6339,051
– Gross Shorts:17,95315,04722,958
– Long to Short Ratio:0.1 to 13.0 to 10.4 to 1
NET POSITION TREND:
– COT Index Score (3 Year Range Pct):42.664.222.5
– COT Index Reading (3 Year Range):BearishBullishBearish
NET POSITION MOVEMENT INDEX:
– 6-Week Change in Strength Index:-34.629.7-19.1


Canadian Dollar Futures:

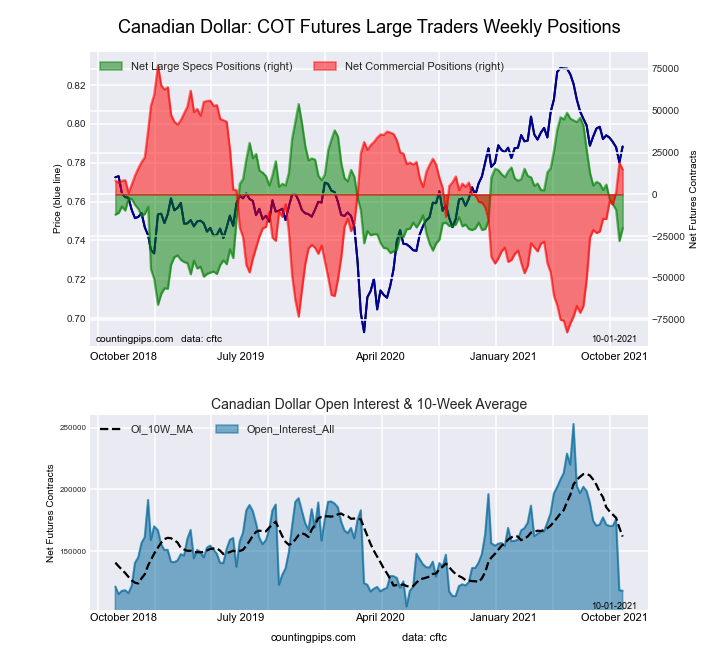
US Year Treasury Notes Long Bonds Futures COT ChartThe Canadian Dollar large speculator standing this week was a net position of -26,866 contracts in the data reported through Tuesday. This was a weekly decrease of -6,631 contracts from the previous week which had a total of -20,235 net contracts.

This week’s current strength score (the trader positioning range over the past three years, measured from 0 to 100) shows the speculators are currently Bearish with a score of 32.6 percent. The commercials are Bullish with a score of 61.3 percent and the small traders (not shown in chart) are Bullish with a score of 64.0 percent.

CANADIAN DOLLAR StatisticsSPECULATORSCOMMERCIALSSMALL TRADERS
– Percent of Open Interest Longs:15.554.428.8
– Percent of Open Interest Shorts:37.841.519.3
– Net Position:-26,86615,45511,411
– Gross Longs:18,58065,33834,639
– Gross Shorts:45,44649,88323,228
– Long to Short Ratio:0.4 to 11.3 to 11.5 to 1
NET POSITION TREND:
– COT Index Score (3 Year Range Pct):32.661.364.0
– COT Index Reading (3 Year Range):BearishBullishBullish
NET POSITION MOVEMENT INDEX:
– 6-Week Change in Strength Index:-27.318.93.9


Australian Dollar Futures:

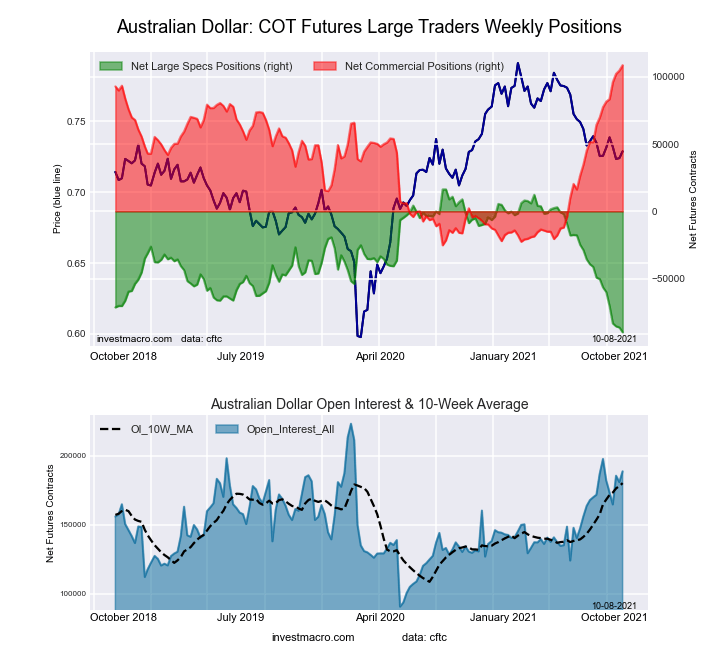
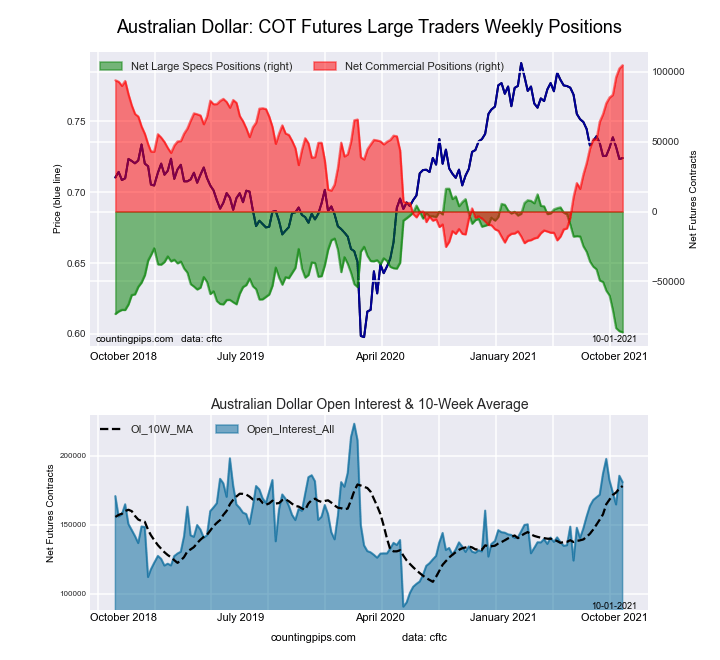
Ultra US Year Treasury Notes Long Bonds Futures COT ChartThe Australian Dollar large speculator standing this week was a net position of -89,979 contracts in the data reported through Tuesday. This was a weekly reduction of -3,596 contracts from the previous week which had a total of -86,383 net contracts.

This week’s current strength score (the trader positioning range over the past three years, measured from 0 to 100) shows the speculators are currently Bearish-Extreme with a score of 0.0 percent. The commercials are Bullish-Extreme with a score of 100.0 percent and the small traders (not shown in chart) are Bearish-Extreme with a score of 10.1 percent.

AUSTRALIAN DOLLAR StatisticsSPECULATORSCOMMERCIALSSMALL TRADERS
– Percent of Open Interest Longs:9.380.37.7
– Percent of Open Interest Shorts:56.922.717.6
– Net Position:-89,979108,693-18,714
– Gross Longs:17,471151,50114,474
– Gross Shorts:107,45042,80833,188
– Long to Short Ratio:0.2 to 13.5 to 10.4 to 1
NET POSITION TREND:
– COT Index Score (3 Year Range Pct):0.0100.010.1
– COT Index Reading (3 Year Range):Bearish-ExtremeBullish-ExtremeBearish-Extreme
NET POSITION MOVEMENT INDEX:
– 6-Week Change in Strength Index:-31.423.35.0


New Zealand Dollar Futures:

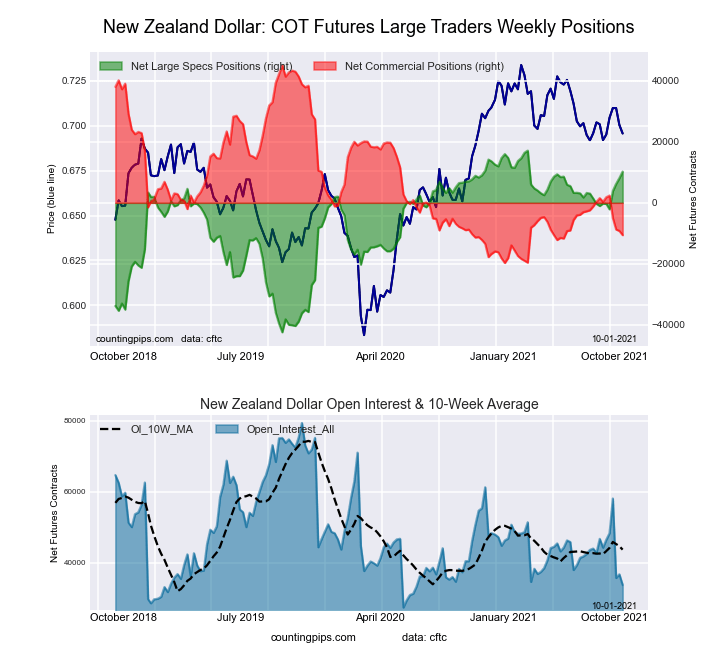
Eurodollar Bonds Futures COT ChartThe New Zealand Dollar large speculator standing this week was a net position of 8,056 contracts in the data reported through Tuesday. This was a weekly reduction of -2,190 contracts from the previous week which had a total of 10,246 net contracts.

This week’s current strength score (the trader positioning range over the past three years, measured from 0 to 100) shows the speculators are currently Bullish-Extreme with a score of 84.8 percent. The commercials are Bearish-Extreme with a score of 18.2 percent and the small traders (not shown in chart) are Bullish with a score of 51.4 percent.

NEW ZEALAND DOLLAR StatisticsSPECULATORSCOMMERCIALSSMALL TRADERS
– Percent of Open Interest Longs:49.937.910.3
– Percent of Open Interest Shorts:27.459.910.8
– Net Position:8,056-7,886-170
– Gross Longs:17,88713,5883,702
– Gross Shorts:9,83121,4743,872
– Long to Short Ratio:1.8 to 10.6 to 11.0 to 1
NET POSITION TREND:
– COT Index Score (3 Year Range Pct):84.818.251.4
– COT Index Reading (3 Year Range):Bullish-ExtremeBearish-ExtremeBullish
NET POSITION MOVEMENT INDEX:
– 6-Week Change in Strength Index:14.1-15.014.4


Mexican Peso Futures:

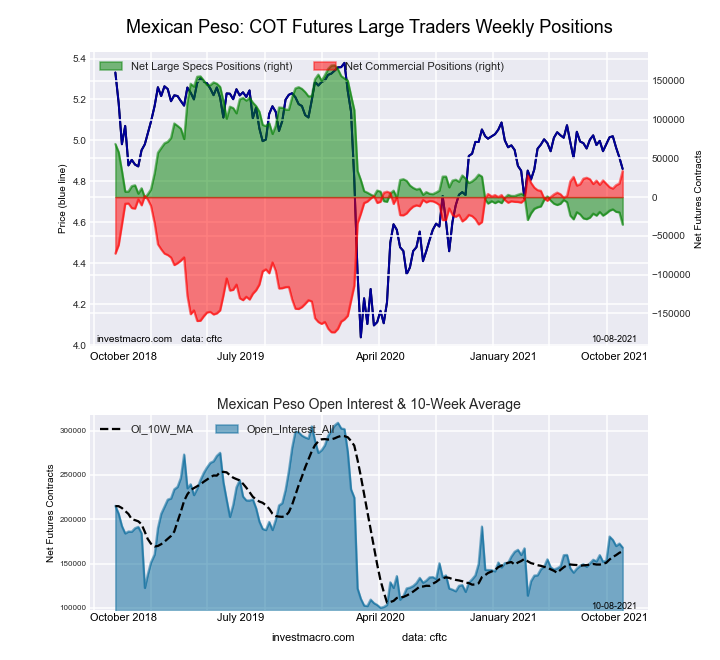
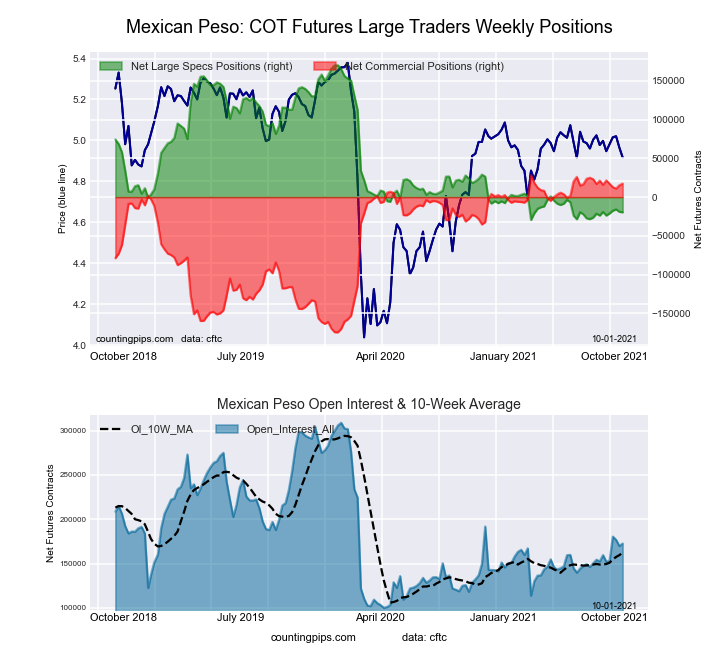
Ultra 10-Year Treasury Notes Bonds Futures COT ChartThe Mexican Peso large speculator standing this week was a net position of -35,579 contracts in the data reported through Tuesday. This was a weekly reduction of -15,984 contracts from the previous week which had a total of -19,595 net contracts.

This week’s current strength score (the trader positioning range over the past three years, measured from 0 to 100) shows the speculators are currently Bearish-Extreme with a score of 0.0 percent. The commercials are Bullish-Extreme with a score of 100.0 percent and the small traders (not shown in chart) are Bullish with a score of 51.0 percent.

MEXICAN PESO StatisticsSPECULATORSCOMMERCIALSSMALL TRADERS
– Percent of Open Interest Longs:45.849.93.3
– Percent of Open Interest Shorts:67.029.92.2
– Net Position:-35,57933,6931,886
– Gross Longs:77,07483,9265,540
– Gross Shorts:112,65350,2333,654
– Long to Short Ratio:0.7 to 11.7 to 11.5 to 1
NET POSITION TREND:
– COT Index Score (3 Year Range Pct):0.0100.051.0
– COT Index Reading (3 Year Range):Bearish-ExtremeBullish-ExtremeBullish
NET POSITION MOVEMENT INDEX:
– 6-Week Change in Strength Index:-5.75.8-1.5


Brazilian Real Futures:

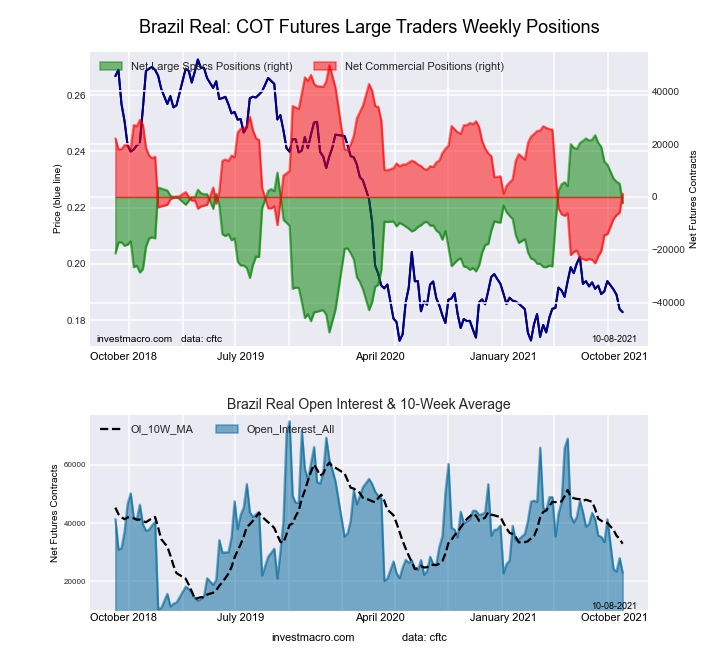
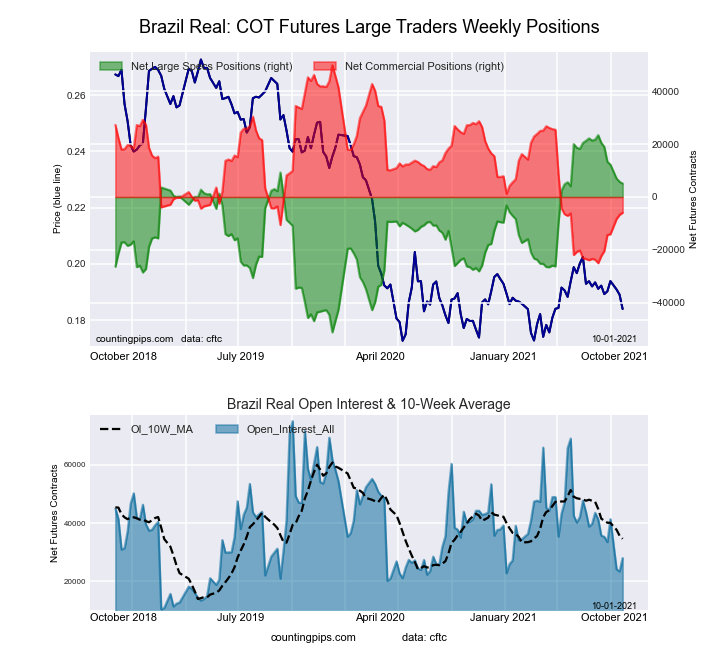
US Year Treasury Notes Long Bonds Futures COT ChartThe Brazilian Real large speculator standing this week was a net position of -2,290 contracts in the data reported through Tuesday. This was a weekly decrease of -7,376 contracts from the previous week which had a total of 5,086 net contracts.

This week’s current strength score (the trader positioning range over the past three years, measured from 0 to 100) shows the speculators are currently Bullish with a score of 65.6 percent. The commercials are Bearish with a score of 35.1 percent and the small traders (not shown in chart) are Bullish with a score of 79.2 percent.

BRAZIL REAL StatisticsSPECULATORSCOMMERCIALSSMALL TRADERS
– Percent of Open Interest Longs:44.342.013.3
– Percent of Open Interest Shorts:54.236.58.9
– Net Position:-2,2901,2691,021
– Gross Longs:10,1709,6463,064
– Gross Shorts:12,4608,3772,043
– Long to Short Ratio:0.8 to 11.2 to 11.5 to 1
NET POSITION TREND:
– COT Index Score (3 Year Range Pct):65.635.179.2
– COT Index Reading (3 Year Range):BullishBearishBullish
NET POSITION MOVEMENT INDEX:
– 6-Week Change in Strength Index:-20.920.9-0.5


Russian Ruble Futures:

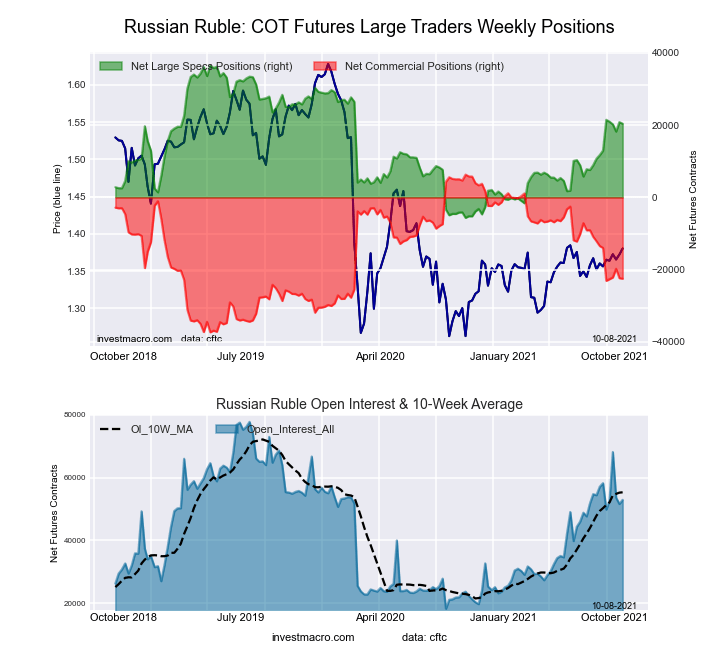
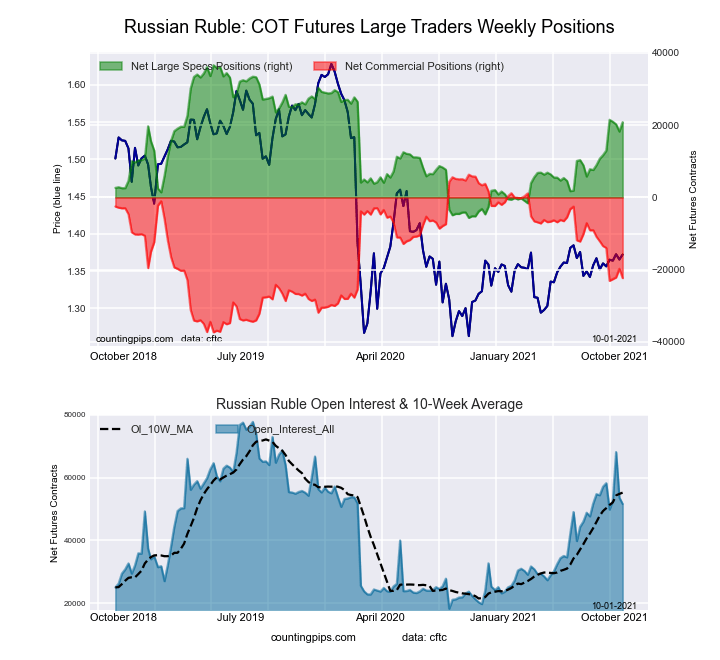
Ultra US Year Treasury Notes Long Bonds Futures COT ChartThe Russian Ruble large speculator standing this week was a net position of 20,409 contracts in the data reported through Tuesday. This was a weekly decrease of -419 contracts from the previous week which had a total of 20,828 net contracts.

This week’s current strength score (the trader positioning range over the past three years, measured from 0 to 100) shows the speculators are currently Bullish with a score of 61.7 percent. The commercials are Bearish with a score of 34.0 percent and the small traders (not shown in chart) are Bullish-Extreme with a score of 100.0 percent.

RUSSIAN RUBLE StatisticsSPECULATORSCOMMERCIALSSMALL TRADERS
– Percent of Open Interest Longs:55.039.05.8
– Percent of Open Interest Shorts:16.481.51.9
– Net Position:20,409-22,4912,082
– Gross Longs:29,10720,6343,092
– Gross Shorts:8,69843,1251,010
– Long to Short Ratio:3.3 to 10.5 to 13.1 to 1
NET POSITION TREND:
– COT Index Score (3 Year Range Pct):61.734.0100.0
– COT Index Reading (3 Year Range):BullishBearishBullish-Extreme
NET POSITION MOVEMENT INDEX:
– 6-Week Change in Strength Index:17.6-19.531.6


Bitcoin Futures:

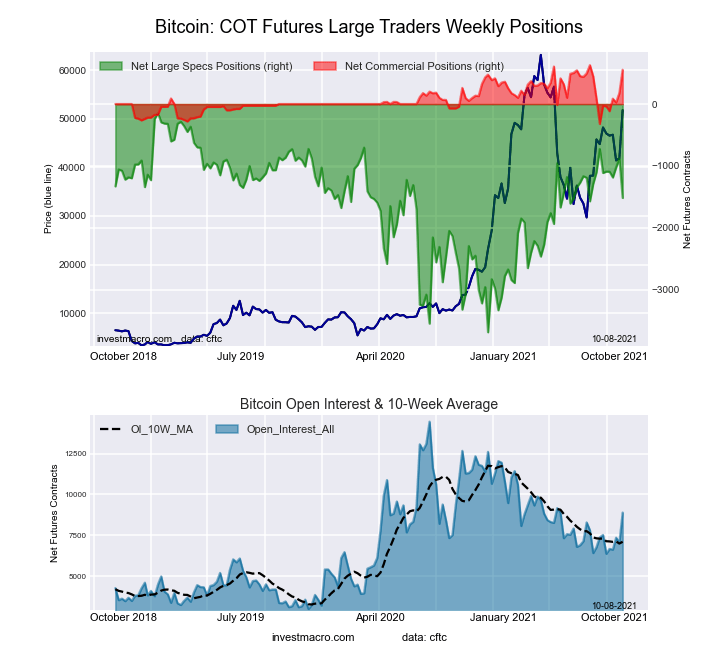
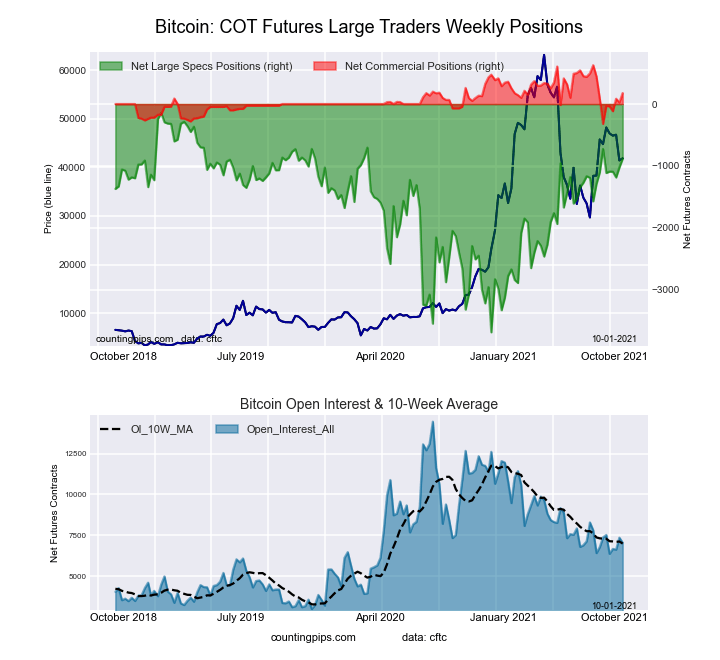
Eurodollar Bonds Futures COT ChartThe Bitcoin large speculator standing this week was a net position of -1,518 contracts in the data reported through Tuesday. This was a weekly lowering of -635 contracts from the previous week which had a total of -883 net contracts.

This week’s current strength score (the trader positioning range over the past three years, measured from 0 to 100) shows the speculators are currently Bullish with a score of 61.2 percent. The commercials are Bullish-Extreme with a score of 92.2 percent and the small traders (not shown in chart) are Bearish with a score of 21.4 percent.

BITCOIN StatisticsSPECULATORSCOMMERCIALSSMALL TRADERS
– Percent of Open Interest Longs:62.86.719.8
– Percent of Open Interest Shorts:79.90.58.9
– Net Position:-1,518554964
– Gross Longs:5,5815991,758
– Gross Shorts:7,09945794
– Long to Short Ratio:0.8 to 113.3 to 12.2 to 1
NET POSITION TREND:
– COT Index Score (3 Year Range Pct):61.292.221.4
– COT Index Reading (3 Year Range):BullishBullish-ExtremeBearish
NET POSITION MOVEMENT INDEX:
– 6-Week Change in Strength Index:-11.461.4-5.9


Article By InvestMacro.comReceive our weekly COT Reports by Email

*COT Report: The COT data, released weekly to the public each Friday, is updated through the most recent Tuesday (data is 3 days old) and shows a quick view of how large speculators or non-commercials (for-profit traders) were positioned in the futures markets.

The CFTC categorizes trader positions according to commercial hedgers (traders who use futures contracts for hedging as part of the business), non-commercials (large traders who speculate to realize trading profits) and nonreportable traders (usually small traders/speculators) as well as their open interest (contracts open in the market at time of reporting).

Find CFTC criteria here: (http://www.cftc.gov/MarketReports/CommitmentsofTraders/ExplanatoryNotes/index.htm).
COT Bonds Futures Charts: Treasury Notes, Fed Funds, 10-Year, 2-Year, 5-Year, Ultra Notes, Eurodollars

By InvestMacro COT Home | COT Tables | Data Downloads | Newsletter

Here are the latest charts and statistics for the Commitment of Traders (COT) data published by the Commodities Futures Trading Commission (CFTC).

The latest COT data is updated through Tuesday October 5th 2021 and shows a quick view of how large traders (for-profit speculators and commercial entities) were positioned in the futures markets.


Data Snapshot of Bond Market Traders | Columns Legend
Oct-05-2021OIOI-IndexSpec-NetSpec-IndexCom-NetCOM-IndexSmalls-NetSmalls-Index
Eurodollar12,461,19764-760,84336996,97258-236,12972
FedFunds1,112,64411-78,3483089,97871-11,63040
2-Year1,773,4740-42,5278353,74028-11,21319
Long T-Bond1,232,19856-98,64958109,98755-11,33844
10-Year4,063,95269141,33395192,71043-334,0430
5-Year3,571,11924-314,82455547,98562-233,1610


3-Month Eurodollars Futures:

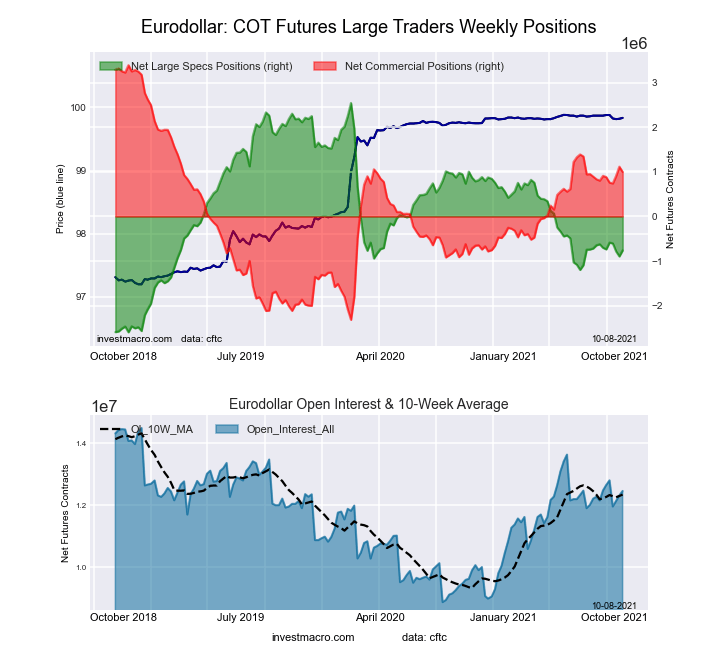
Eurodollar Bonds Futures COT ChartThe 3-Month Eurodollars large speculator standing this week reached a net position of -760,843 contracts in the data reported through Tuesday. This was a weekly lift of 134,187 contracts from the previous week which had a total of -895,030 net contracts.

This week’s current strength score (the trader positioning range over the past three years, measured from 0 to 100) shows the speculators are currently Bearish with a score of 35.7 percent. The commercials are Bullish with a score of 58.1 percent and the small traders (not shown in chart) are Bullish with a score of 72.1 percent.

3-Month Eurodollars StatisticsSPECULATORSCOMMERCIALSSMALL TRADERS
– Percent of Open Interest Longs:14.060.74.8
– Percent of Open Interest Shorts:20.152.76.7
– Net Position:-760,843996,972-236,129
– Gross Longs:1,746,5557,566,476594,467
– Gross Shorts:2,507,3986,569,504830,596
– Long to Short Ratio:0.7 to 11.2 to 10.7 to 1
NET POSITION TREND:
– COT Index Score (3 Year Range Pct):35.758.172.1
– COT Index Reading (3 Year Range):BearishBullishBullish
NET POSITION MOVEMENT INDEX:
– 6-Week Change in Strength Index:-1.11.5-3.7


30-Day Federal Funds Futures:

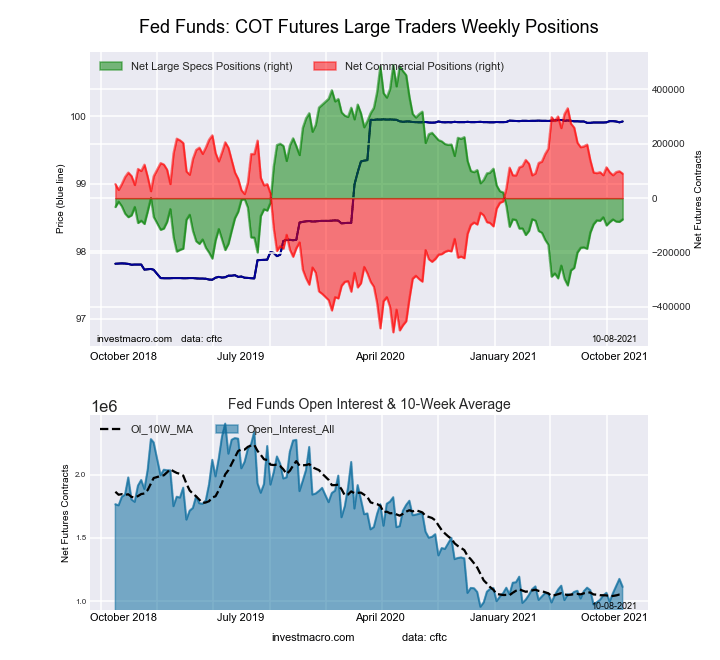
Federal Funds 30-Day Bonds Futures COT ChartThe 30-Day Federal Funds large speculator standing this week reached a net position of -78,348 contracts in the data reported through Tuesday. This was a weekly rise of 8,633 contracts from the previous week which had a total of -86,981 net contracts.

This week’s current strength score (the trader positioning range over the past three years, measured from 0 to 100) shows the speculators are currently Bearish with a score of 29.9 percent. The commercials are Bullish with a score of 70.8 percent and the small traders (not shown in chart) are Bearish with a score of 40.2 percent.

30-Day Federal Funds StatisticsSPECULATORSCOMMERCIALSSMALL TRADERS
– Percent of Open Interest Longs:5.477.02.2
– Percent of Open Interest Shorts:12.468.93.2
– Net Position:-78,34889,978-11,630
– Gross Longs:59,841856,93724,136
– Gross Shorts:138,189766,95935,766
– Long to Short Ratio:0.4 to 11.1 to 10.7 to 1
NET POSITION TREND:
– COT Index Score (3 Year Range Pct):29.970.840.2
– COT Index Reading (3 Year Range):BearishBullishBearish
NET POSITION MOVEMENT INDEX:
– 6-Week Change in Strength Index:-1.00.75.3


2-Year Treasury Note Futures:

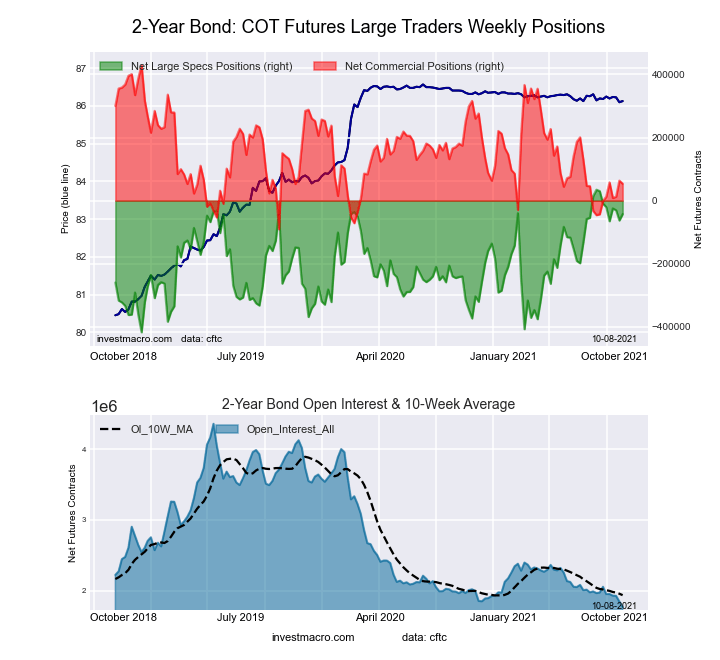
2-Year Treasury Bonds Futures COT ChartThe 2-Year Treasury Note large speculator standing this week reached a net position of -42,527 contracts in the data reported through Tuesday. This was a weekly boost of 20,302 contracts from the previous week which had a total of -62,829 net contracts.

This week’s current strength score (the trader positioning range over the past three years, measured from 0 to 100) shows the speculators are currently Bullish-Extreme with a score of 82.9 percent. The commercials are Bearish with a score of 27.8 percent and the small traders (not shown in chart) are Bearish-Extreme with a score of 19.3 percent.

2-Year Treasury Note StatisticsSPECULATORSCOMMERCIALSSMALL TRADERS
– Percent of Open Interest Longs:17.572.07.7
– Percent of Open Interest Shorts:19.969.08.3
– Net Position:-42,52753,740-11,213
– Gross Longs:310,7311,277,218136,061
– Gross Shorts:353,2581,223,478147,274
– Long to Short Ratio:0.9 to 11.0 to 10.9 to 1
NET POSITION TREND:
– COT Index Score (3 Year Range Pct):82.927.819.3
– COT Index Reading (3 Year Range):Bullish-ExtremeBearishBearish-Extreme
NET POSITION MOVEMENT INDEX:
– 6-Week Change in Strength Index:-7.310.5-12.8


5-Year Treasury Note Futures:

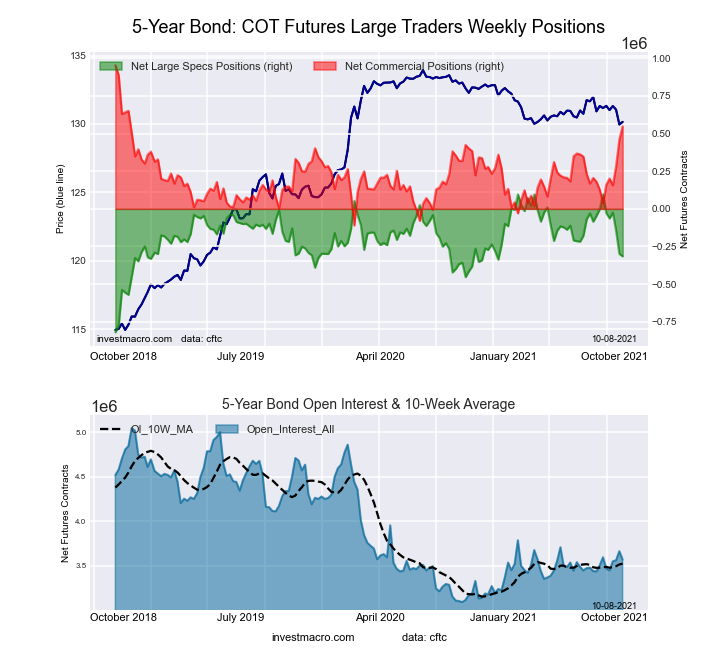
5-Year Treasury Bonds Futures COT ChartThe 5-Year Treasury Note large speculator standing this week reached a net position of -314,824 contracts in the data reported through Tuesday. This was a weekly lowering of -15,628 contracts from the previous week which had a total of -299,196 net contracts.

This week’s current strength score (the trader positioning range over the past three years, measured from 0 to 100) shows the speculators are currently Bullish with a score of 55.2 percent. The commercials are Bullish with a score of 61.8 percent and the small traders (not shown in chart) are Bearish-Extreme with a score of 0.0 percent.

5-Year Treasury Note StatisticsSPECULATORSCOMMERCIALSSMALL TRADERS
– Percent of Open Interest Longs:9.779.67.0
– Percent of Open Interest Shorts:18.564.313.5
– Net Position:-314,824547,985-233,161
– Gross Longs:345,0602,842,467248,462
– Gross Shorts:659,8842,294,482481,623
– Long to Short Ratio:0.5 to 11.2 to 10.5 to 1
NET POSITION TREND:
– COT Index Score (3 Year Range Pct):55.261.80.0
– COT Index Reading (3 Year Range):BullishBullishBearish-Extreme
NET POSITION MOVEMENT INDEX:
– 6-Week Change in Strength Index:-44.848.0-33.1


10-Year Treasury Note Futures:

10-Year Treasury Notes Bonds Futures COT ChartThe 10-Year Treasury Note large speculator standing this week reached a net position of 141,333 contracts in the data reported through Tuesday. This was a weekly lowering of -39,874 contracts from the previous week which had a total of 181,207 net contracts.

This week’s current strength score (the trader positioning range over the past three years, measured from 0 to 100) shows the speculators are currently Bullish-Extreme with a score of 95.0 percent. The commercials are Bearish with a score of 42.6 percent and the small traders (not shown in chart) are Bearish-Extreme with a score of 0.0 percent.

10-Year Treasury Note StatisticsSPECULATORSCOMMERCIALSSMALL TRADERS
– Percent of Open Interest Longs:20.969.17.1
– Percent of Open Interest Shorts:17.464.415.3
– Net Position:141,333192,710-334,043
– Gross Longs:848,2562,808,775289,697
– Gross Shorts:706,9232,616,065623,740
– Long to Short Ratio:1.2 to 11.1 to 10.5 to 1
NET POSITION TREND:
– COT Index Score (3 Year Range Pct):95.042.60.0
– COT Index Reading (3 Year Range):Bullish-ExtremeBearishBearish-Extreme
NET POSITION MOVEMENT INDEX:
– 6-Week Change in Strength Index:3.511.1-29.7


Ultra 10-Year Notes Futures:

Ultra 10-Year Treasury Notes Bonds Futures COT ChartThe Ultra 10-Year Notes large speculator standing this week reached a net position of 80,879 contracts in the data reported through Tuesday. This was a weekly increase of 5,032 contracts from the previous week which had a total of 75,847 net contracts.

This week’s current strength score (the trader positioning range over the past three years, measured from 0 to 100) shows the speculators are currently Bearish with a score of 49.1 percent. The commercials are Bullish with a score of 70.8 percent and the small traders (not shown in chart) are Bearish-Extreme with a score of 0.0 percent.

Ultra 10-Year Notes StatisticsSPECULATORSCOMMERCIALSSMALL TRADERS
– Percent of Open Interest Longs:17.174.97.6
– Percent of Open Interest Shorts:11.568.419.7
– Net Position:80,87994,700-175,579
– Gross Longs:248,2581,087,022110,087
– Gross Shorts:167,379992,322285,666
– Long to Short Ratio:1.5 to 11.1 to 10.4 to 1
NET POSITION TREND:
– COT Index Score (3 Year Range Pct):49.170.80.0
– COT Index Reading (3 Year Range):BearishBullishBearish-Extreme
NET POSITION MOVEMENT INDEX:
– 6-Week Change in Strength Index:-0.36.6-15.1


US Treasury Bonds Futures:

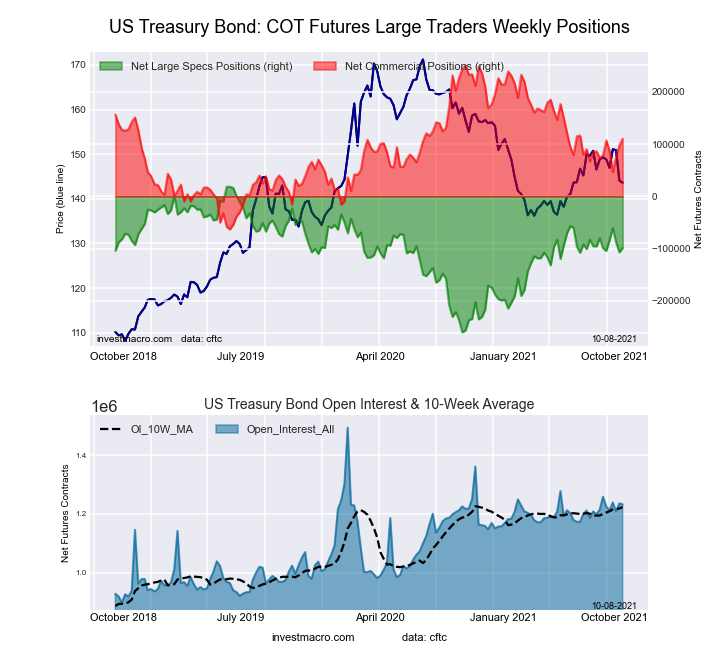
US Year Treasury Notes Long Bonds Futures COT ChartThe US Treasury Bonds large speculator standing this week reached a net position of -98,649 contracts in the data reported through Tuesday. This was a weekly lift of 8,291 contracts from the previous week which had a total of -106,940 net contracts.

This week’s current strength score (the trader positioning range over the past three years, measured from 0 to 100) shows the speculators are currently Bullish with a score of 58.0 percent. The commercials are Bullish with a score of 55.2 percent and the small traders (not shown in chart) are Bearish with a score of 43.6 percent.

US Treasury Bonds StatisticsSPECULATORSCOMMERCIALSSMALL TRADERS
– Percent of Open Interest Longs:8.775.213.9
– Percent of Open Interest Shorts:16.766.314.8
– Net Position:-98,649109,987-11,338
– Gross Longs:107,189927,032171,374
– Gross Shorts:205,838817,045182,712
– Long to Short Ratio:0.5 to 11.1 to 10.9 to 1
NET POSITION TREND:
– COT Index Score (3 Year Range Pct):58.055.243.6
– COT Index Reading (3 Year Range):BullishBullishBearish
NET POSITION MOVEMENT INDEX:
– 6-Week Change in Strength Index:0.210.0-25.5


Ultra US Treasury Bonds Futures:

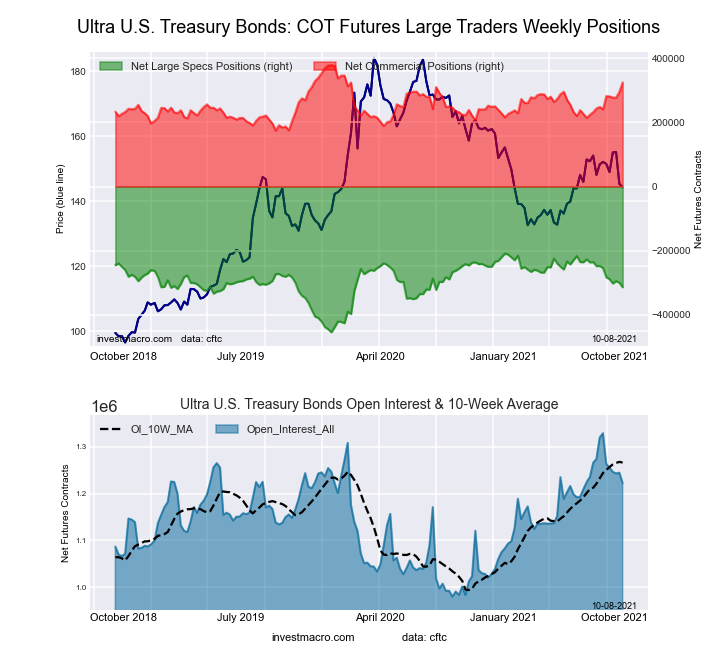
Ultra US Year Treasury Notes Long Bonds Futures COT ChartThe Ultra US Treasury Bonds large speculator standing this week reached a net position of -313,634 contracts in the data reported through Tuesday. This was a weekly decline of -13,841 contracts from the previous week which had a total of -299,793 net contracts.

This week’s current strength score (the trader positioning range over the past three years, measured from 0 to 100) shows the speculators are currently Bullish with a score of 57.3 percent. The commercials are Bullish with a score of 73.6 percent and the small traders (not shown in chart) are Bearish with a score of 20.7 percent.

Ultra US Treasury Bonds StatisticsSPECULATORSCOMMERCIALSSMALL TRADERS
– Percent of Open Interest Longs:4.682.512.0
– Percent of Open Interest Shorts:30.256.012.9
– Net Position:-313,634324,157-10,523
– Gross Longs:55,6951,008,685146,619
– Gross Shorts:369,329684,528157,142
– Long to Short Ratio:0.2 to 11.5 to 10.9 to 1
NET POSITION TREND:
– COT Index Score (3 Year Range Pct):57.373.620.7
– COT Index Reading (3 Year Range):BullishBullishBearish
NET POSITION MOVEMENT INDEX:
– 6-Week Change in Strength Index:-24.341.0-17.1


Article By InvestMacro.comReceive our weekly COT Reports by Email

*COT Report: The COT data, released weekly to the public each Friday, is updated through the most recent Tuesday (data is 3 days old) and shows a quick view of how large speculators or non-commercials (for-profit traders) were positioned in the futures markets.

The CFTC categorizes trader positions according to commercial hedgers (traders who use futures contracts for hedging as part of the business), non-commercials (large traders who speculate to realize trading profits) and nonreportable traders (usually small traders/speculators).

Find CFTC criteria here: (http://www.cftc.gov/MarketReports/CommitmentsofTraders/ExplanatoryNotes/index.htm).
COT Energy Charts: #2 Heating Oil Speculator bets gain for 3rd week as futures prices hit multi-year high

By InvestMacro.com COT Home | Data Tables | Data Downloads | COT Newsletter

Here are the latest charts and statistics for the Commitment of Traders (COT) data published by the Commodities Futures Trading Commission (CFTC).

The latest COT data is updated through Tuesday October 5th 2021 and shows a quick view of how large traders (for-profit speculators and commercial entities) were positioned in the futures markets.

Heating Oil speculators increased their bullish bets for a third straight week as heating oil prices continue to rise. Speculative positions have stayed above the +20,000 contracts now for twenty-one straight weeks and have a strength index score of 91.9 which shows a bullish-extreme reading (the level of bullish speculator positioning over the past three-year range). Heating Oil futures market prices have also jumped to the highest level since 2014 above $2.4 a gallon this week.


Data Snapshot of Commodity Market Traders | Columns Legend
Oct-05-2021OIOI-IndexSpec-NetSpec-IndexCom-NetCOM-IndexSmalls-NetSmalls-Index
WTI Crude2,230,79448398,30739-443,2595044,95278
Gold483,78921182,58253-203,7024721,12031
Silver139,763716,37939-27,7787211,3996
Copper185,6551614,41753-18,918464,50151
Palladium9,70514-3,23003,51099-28028
Platinum62,109255,51510-10,403944,88830
Natural Gas1,376,78850-133,7083896,6376137,07173
Brent197,79538-37,0215130,935426,08689
Heating Oil440,2867737,54892-66,885029,337100
Soybeans715,8352551,40143-22,59261-28,80924
Corn1,397,4584297,00568-237,59338-59,4129
Coffee306,3636366,57197-71,02244,45119
Sugar888,35428247,37587-293,1351345,76064
Wheat373,320177,312533,69544-11,00749


WTI Crude Oil Futures:

WTI Crude Oil Futures COT ChartThe WTI Crude Oil Futures large speculator standing this week reached a net position of 398,307 contracts in the data reported through Tuesday. This was a weekly advance of 24,493 contracts from the previous week which had a total of 373,814 net contracts.

This week’s current strength score (the trader positioning range over the past three years, measured from 0 to 100) shows the speculators are currently Bearish with a score of 38.8 percent. The commercials are Bearish with a score of 49.6 percent and the small traders (not shown in chart) are Bullish with a score of 78.4 percent.

WTI Crude Oil Futures StatisticsSPECULATORSCOMMERCIALSSMALL TRADERS
– Percent of Open Interest Longs:24.632.64.6
– Percent of Open Interest Shorts:6.752.52.6
– Net Position:398,307-443,25944,952
– Gross Longs:548,561726,829103,241
– Gross Shorts:150,2541,170,08858,289
– Long to Short Ratio:3.7 to 10.6 to 11.8 to 1
NET POSITION TREND:
– COT Index Score (3 Year Range Pct):38.849.678.4
– COT Index Reading (3 Year Range):BearishBearishBullish
NET POSITION MOVEMENT INDEX:
– 6-Week Change in Strength Index:7.7-10.615.9


Brent Crude Oil Futures:

Brent Last Day Crude Oil Futures COT ChartThe Brent Crude Oil Futures large speculator standing this week reached a net position of -37,021 contracts in the data reported through Tuesday. This was a weekly rise of 4,339 contracts from the previous week which had a total of -41,360 net contracts.

This week’s current strength score (the trader positioning range over the past three years, measured from 0 to 100) shows the speculators are currently Bullish with a score of 51.2 percent. The commercials are Bearish with a score of 41.8 percent and the small traders (not shown in chart) are Bullish-Extreme with a score of 88.8 percent.

Brent Crude Oil Futures StatisticsSPECULATORSCOMMERCIALSSMALL TRADERS
– Percent of Open Interest Longs:16.252.15.8
– Percent of Open Interest Shorts:35.036.52.8
– Net Position:-37,02130,9356,086
– Gross Longs:32,129103,09311,563
– Gross Shorts:69,15072,1585,477
– Long to Short Ratio:0.5 to 11.4 to 12.1 to 1
NET POSITION TREND:
– COT Index Score (3 Year Range Pct):51.241.888.8
– COT Index Reading (3 Year Range):BullishBearishBullish-Extreme
NET POSITION MOVEMENT INDEX:
– 6-Week Change in Strength Index:-6.2-4.352.3


Natural Gas Futures:

Natural Gas Futures COT ChartThe Natural Gas Futures large speculator standing this week reached a net position of -133,708 contracts in the data reported through Tuesday. This was a weekly rise of 12,972 contracts from the previous week which had a total of -146,680 net contracts.

This week’s current strength score (the trader positioning range over the past three years, measured from 0 to 100) shows the speculators are currently Bearish with a score of 38.4 percent. The commercials are Bullish with a score of 61.3 percent and the small traders (not shown in chart) are Bullish with a score of 72.8 percent.

Natural Gas Futures StatisticsSPECULATORSCOMMERCIALSSMALL TRADERS
– Percent of Open Interest Longs:21.044.44.7
– Percent of Open Interest Shorts:30.737.32.0
– Net Position:-133,70896,63737,071
– Gross Longs:289,262610,70364,111
– Gross Shorts:422,970514,06627,040
– Long to Short Ratio:0.7 to 11.2 to 12.4 to 1
NET POSITION TREND:
– COT Index Score (3 Year Range Pct):38.461.372.8
– COT Index Reading (3 Year Range):BearishBullishBullish
NET POSITION MOVEMENT INDEX:
– 6-Week Change in Strength Index:9.9-10.61.6


Gasoline Blendstock Futures:

RBOB Gasoline Energy Futures COT ChartThe Gasoline Blendstock Futures large speculator standing this week reached a net position of 51,052 contracts in the data reported through Tuesday. This was a weekly advance of 7,875 contracts from the previous week which had a total of 43,177 net contracts.

This week’s current strength score (the trader positioning range over the past three years, measured from 0 to 100) shows the speculators are currently Bearish with a score of 22.1 percent. The commercials are Bullish with a score of 78.2 percent and the small traders (not shown in chart) are Bullish with a score of 58.1 percent.

Nasdaq Mini Futures StatisticsSPECULATORSCOMMERCIALSSMALL TRADERS
– Percent of Open Interest Longs:30.743.17.1
– Percent of Open Interest Shorts:14.461.84.6
– Net Position:51,052-58,8407,788
– Gross Longs:96,435135,31422,305
– Gross Shorts:45,383194,15414,517
– Long to Short Ratio:2.1 to 10.7 to 11.5 to 1
NET POSITION TREND:
– COT Index Score (3 Year Range Pct):22.178.258.1
– COT Index Reading (3 Year Range):BearishBullishBullish
NET POSITION MOVEMENT INDEX:
– 6-Week Change in Strength Index:14.4-16.211.8


#2 Heating Oil NY-Harbor Futures:

NY Harbor Heating Oil Energy Futures COT ChartThe #2 Heating Oil NY-Harbor Futures large speculator standing this week reached a net position of 37,548 contracts in the data reported through Tuesday. This was a weekly increase of 958 contracts from the previous week which had a total of 36,590 net contracts.

This week’s current strength score (the trader positioning range over the past three years, measured from 0 to 100) shows the speculators are currently Bullish-Extreme with a score of 91.9 percent. The commercials are Bearish-Extreme with a score of 0.0 percent and the small traders (not shown in chart) are Bullish-Extreme with a score of 100.0 percent.

Heating Oil Futures StatisticsSPECULATORSCOMMERCIALSSMALL TRADERS
– Percent of Open Interest Longs:16.447.511.3
– Percent of Open Interest Shorts:7.962.74.7
– Net Position:37,548-66,88529,337
– Gross Longs:72,173208,95549,824
– Gross Shorts:34,625275,84020,487
– Long to Short Ratio:2.1 to 10.8 to 12.4 to 1
NET POSITION TREND:
– COT Index Score (3 Year Range Pct):91.90.0100.0
– COT Index Reading (3 Year Range):Bullish-ExtremeBearish-ExtremeBullish-Extreme
NET POSITION MOVEMENT INDEX:
– 6-Week Change in Strength Index:4.9-15.337.5


Bloomberg Commodity Index Futures:

Bloomberg Commodity Index Futures COT ChartThe Bloomberg Commodity Index Futures large speculator standing this week reached a net position of -12,674 contracts in the data reported through Tuesday. This was a weekly fall of -3,056 contracts from the previous week which had a total of -9,618 net contracts.

This week’s current strength score (the trader positioning range over the past three years, measured from 0 to 100) shows the speculators are currently Bearish with a score of 32.3 percent. The commercials are Bullish with a score of 67.4 percent and the small traders (not shown in chart) are Bearish with a score of 43.7 percent.

Bloomberg Index Futures StatisticsSPECULATORSCOMMERCIALSSMALL TRADERS
– Percent of Open Interest Longs:55.537.81.4
– Percent of Open Interest Shorts:89.15.30.3
– Net Position:-12,67412,233441
– Gross Longs:20,93814,249536
– Gross Shorts:33,6122,01695
– Long to Short Ratio:0.6 to 17.1 to 15.6 to 1
NET POSITION TREND:
– COT Index Score (3 Year Range Pct):32.367.443.7
– COT Index Reading (3 Year Range):BearishBullishBearish
NET POSITION MOVEMENT INDEX:
– 6-Week Change in Strength Index:6.7-7.04.6


Article By InvestMacro.comReceive our weekly COT Reports by Email

*COT Report: The COT data, released weekly to the public each Friday, is updated through the most recent Tuesday (data is 3 days old) and shows a quick view of how large speculators or non-commercials (for-profit traders) were positioned in the futures markets.

The CFTC categorizes trader positions according to commercial hedgers (traders who use futures contracts for hedging as part of the business), non-commercials (large traders who speculate to realize trading profits) and nonreportable traders (usually small traders/speculators).

Find CFTC criteria here: (http://www.cftc.gov/MarketReports/CommitmentsofTraders/ExplanatoryNotes/index.htm).
COT Soft Commodities Charts: Cotton speculators bets continue to rise to new 3-Year high

By InvestMacro COT Home | Data Tables | Data Downloads | COT Newsletter

Here are the latest charts and statistics for the Commitment of Traders (COT) data published by the Commodities Futures Trading Commission (CFTC).

The latest COT data is updated through Tuesday October 5th 2021 and shows a quick view of how large traders (for-profit speculators and commercial entities) were positioned in the futures markets.

Cotton speculative positions continued to draw higher this week with a gain of +5,154 contracts. This is the eleventh rise in the past thirteen weeks to bring the speculator level to over a 3-year high dating back to June 12th of 2018. Cotton prices have been surging as well with prices reaching the highest thresholds since 2011. Needless to say that the Cotton Speculator Strength Index is currently at a 100 percent score again this week (meaning the highest level of bullish speculator positioning over the past three-year range). Joining Cotton with bullish-extreme strength readings this week are Lean Hogs, COFFEE and Sugar among the soft commodities.


Data Snapshot of Commodity Market Traders | Columns Legend
Oct-05-2021OIOI-IndexSpec-NetSpec-IndexCom-NetCOM-IndexSmalls-NetSmalls-Index
WTI Crude2,230,79448398,30739-443,2595044,95278
Gold483,78921182,58253-203,7024721,12031
Silver139,763716,37939-27,7787211,3996
Copper185,6551614,41753-18,918464,50151
Palladium9,70514-3,23003,51099-28028
Platinum62,109255,51510-10,403944,88830
Natural Gas1,376,78850-133,7083896,6376137,07173
Brent197,79538-37,0215130,935426,08689
Heating Oil440,2867737,54892-66,885029,337100
Soybeans715,8352551,40143-22,59261-28,80924
Corn1,397,4584297,00568-237,59338-59,4129
Coffee306,3636366,57197-71,02244,45119
Sugar888,35428247,37587-293,1351345,76064
Wheat373,320177,312533,69544-11,00749


CORN Futures:

Federal Funds 30-Day Bonds Futures COT ChartThe CORN large speculator standing this week recorded a net position of 297,005 contracts in the data reported through Tuesday. This was a weekly boost of 18,459 contracts from the previous week which had a total of 278,546 net contracts.

This week’s current strength score (the trader positioning range over the past three years, measured from 0 to 100) shows the speculators are currently Bullish with a score of 68.0 percent. The commercials are Bearish with a score of 38.1 percent and the small traders (not shown in chart) are Bearish-Extreme with a score of 8.9 percent.

CORN Futures StatisticsSPECULATORSCOMMERCIALSSMALL TRADERS
– Percent of Open Interest Longs:29.448.09.0
– Percent of Open Interest Shorts:8.165.013.3
– Net Position:297,005-237,593-59,412
– Gross Longs:410,799670,303126,389
– Gross Shorts:113,794907,896185,801
– Long to Short Ratio:3.6 to 10.7 to 10.7 to 1
NET POSITION TREND:
– COT Index Score (3 Year Range Pct):68.038.18.9
– COT Index Reading (3 Year Range):BullishBearishBearish-Extreme
NET POSITION MOVEMENT INDEX:
– 6-Week Change in Strength Index:-4.32.78.5


SUGAR Futures:

2-Year Treasury Bonds Futures COT ChartThe SUGAR large speculator standing this week recorded a net position of 247,375 contracts in the data reported through Tuesday. This was a weekly fall of -1,540 contracts from the previous week which had a total of 248,915 net contracts.

This week’s current strength score (the trader positioning range over the past three years, measured from 0 to 100) shows the speculators are currently Bullish-Extreme with a score of 87.5 percent. The commercials are Bearish-Extreme with a score of 12.6 percent and the small traders (not shown in chart) are Bullish with a score of 64.4 percent.

SUGAR Futures StatisticsSPECULATORSCOMMERCIALSSMALL TRADERS
– Percent of Open Interest Longs:33.441.910.0
– Percent of Open Interest Shorts:5.674.94.8
– Net Position:247,375-293,13545,760
– Gross Longs:296,884372,00688,637
– Gross Shorts:49,509665,14142,877
– Long to Short Ratio:6.0 to 10.6 to 12.1 to 1
NET POSITION TREND:
– COT Index Score (3 Year Range Pct):87.512.664.4
– COT Index Reading (3 Year Range):Bullish-ExtremeBearish-ExtremeBullish
NET POSITION MOVEMENT INDEX:
– 6-Week Change in Strength Index:-10.610.9-6.9


COFFEE Futures:

5-Year Treasury Bonds Futures COT ChartThe COFFEE large speculator standing this week recorded a net position of 66,571 contracts in the data reported through Tuesday. This was a weekly lift of 996 contracts from the previous week which had a total of 65,575 net contracts.

This week’s current strength score (the trader positioning range over the past three years, measured from 0 to 100) shows the speculators are currently Bullish-Extreme with a score of 96.9 percent. The commercials are Bearish-Extreme with a score of 4.2 percent and the small traders (not shown in chart) are Bearish-Extreme with a score of 19.1 percent.

COFFEE Futures StatisticsSPECULATORSCOMMERCIALSSMALL TRADERS
– Percent of Open Interest Longs:27.639.63.8
– Percent of Open Interest Shorts:5.962.82.4
– Net Position:66,571-71,0224,451
– Gross Longs:84,602121,36511,705
– Gross Shorts:18,031192,3877,254
– Long to Short Ratio:4.7 to 10.6 to 11.6 to 1
NET POSITION TREND:
– COT Index Score (3 Year Range Pct):96.94.219.1
– COT Index Reading (3 Year Range):Bullish-ExtremeBearish-ExtremeBearish-Extreme
NET POSITION MOVEMENT INDEX:
– 6-Week Change in Strength Index:7.7-8.40.5


SOYBEANS Futures:

10-Year Treasury Notes Bonds Futures COT ChartThe SOYBEANS large speculator standing this week recorded a net position of 51,401 contracts in the data reported through Tuesday. This was a weekly reduction of -13,319 contracts from the previous week which had a total of 64,720 net contracts.

This week’s current strength score (the trader positioning range over the past three years, measured from 0 to 100) shows the speculators are currently Bearish with a score of 43.1 percent. The commercials are Bullish with a score of 60.5 percent and the small traders (not shown in chart) are Bearish with a score of 23.9 percent.

SOYBEANS Futures StatisticsSPECULATORSCOMMERCIALSSMALL TRADERS
– Percent of Open Interest Longs:19.256.26.7
– Percent of Open Interest Shorts:12.059.410.8
– Net Position:51,401-22,592-28,809
– Gross Longs:137,547402,37648,264
– Gross Shorts:86,146424,96877,073
– Long to Short Ratio:1.6 to 10.9 to 10.6 to 1
NET POSITION TREND:
– COT Index Score (3 Year Range Pct):43.160.523.9
– COT Index Reading (3 Year Range):BearishBullishBearish
NET POSITION MOVEMENT INDEX:
– 6-Week Change in Strength Index:-12.413.6-12.6


SOYBEAN MEAL Futures:

US Year Treasury Notes Long Bonds Futures COT ChartThe SOYBEAN MEAL large speculator standing this week recorded a net position of 2,462 contracts in the data reported through Tuesday. This was a weekly fall of -11,337 contracts from the previous week which had a total of 13,799 net contracts.

This week’s current strength score (the trader positioning range over the past three years, measured from 0 to 100) shows the speculators are currently Bearish with a score of 30.3 percent. The commercials are Bullish with a score of 69.2 percent and the small traders (not shown in chart) are Bearish with a score of 49.5 percent.

SOYBEAN MEAL Futures StatisticsSPECULATORSCOMMERCIALSSMALL TRADERS
– Percent of Open Interest Longs:20.149.011.9
– Percent of Open Interest Shorts:19.554.67.0
– Net Position:2,462-22,15319,691
– Gross Longs:80,454196,02747,656
– Gross Shorts:77,992218,18027,965
– Long to Short Ratio:1.0 to 10.9 to 11.7 to 1
NET POSITION TREND:
– COT Index Score (3 Year Range Pct):30.369.249.5
– COT Index Reading (3 Year Range):BearishBullishBearish
NET POSITION MOVEMENT INDEX:
– 6-Week Change in Strength Index:-27.625.58.0


LIVE CATTLE Futures:

Ultra US Year Treasury Notes Long Bonds Futures COT ChartThe LIVE CATTLE large speculator standing this week recorded a net position of 33,852 contracts in the data reported through Tuesday. This was a weekly fall of -6,311 contracts from the previous week which had a total of 40,163 net contracts.

This week’s current strength score (the trader positioning range over the past three years, measured from 0 to 100) shows the speculators are currently Bearish-Extreme with a score of 11.7 percent. The commercials are Bullish-Extreme with a score of 84.3 percent and the small traders (not shown in chart) are Bullish with a score of 74.6 percent.

LIVE CATTLE Futures StatisticsSPECULATORSCOMMERCIALSSMALL TRADERS
– Percent of Open Interest Longs:30.744.910.8
– Percent of Open Interest Shorts:19.054.812.6
– Net Position:33,852-28,700-5,152
– Gross Longs:88,928130,12531,412
– Gross Shorts:55,076158,82536,564
– Long to Short Ratio:1.6 to 10.8 to 10.9 to 1
NET POSITION TREND:
– COT Index Score (3 Year Range Pct):11.784.374.6
– COT Index Reading (3 Year Range):Bearish-ExtremeBullish-ExtremeBullish
NET POSITION MOVEMENT INDEX:
– 6-Week Change in Strength Index:-41.942.526.7


LEAN HOGS Futures:

Eurodollar Bonds Futures COT ChartThe LEAN HOGS large speculator standing this week recorded a net position of 73,429 contracts in the data reported through Tuesday. This was a weekly rise of 9,406 contracts from the previous week which had a total of 64,023 net contracts.

This week’s current strength score (the trader positioning range over the past three years, measured from 0 to 100) shows the speculators are currently Bullish-Extreme with a score of 87.2 percent. The commercials are Bearish with a score of 23.2 percent and the small traders (not shown in chart) are Bearish-Extreme with a score of 0.7 percent.

LEAN HOGS Futures StatisticsSPECULATORSCOMMERCIALSSMALL TRADERS
– Percent of Open Interest Longs:42.730.07.3
– Percent of Open Interest Shorts:14.252.213.7
– Net Position:73,429-57,148-16,281
– Gross Longs:109,94777,17718,907
– Gross Shorts:36,518134,32535,188
– Long to Short Ratio:3.0 to 10.6 to 10.5 to 1
NET POSITION TREND:
– COT Index Score (3 Year Range Pct):87.223.20.7
– COT Index Reading (3 Year Range):Bullish-ExtremeBearishBearish-Extreme
NET POSITION MOVEMENT INDEX:
– 6-Week Change in Strength Index:-1.31.9-2.8


COTTON Futures:

Ultra 10-Year Treasury Notes Bonds Futures COT ChartThe COTTON large speculator standing this week recorded a net position of 121,286 contracts in the data reported through Tuesday. This was a weekly advance of 5,154 contracts from the previous week which had a total of 116,132 net contracts.

This week’s current strength score (the trader positioning range over the past three years, measured from 0 to 100) shows the speculators are currently Bullish-Extreme with a score of 100.0 percent. The commercials are Bearish-Extreme with a score of 0.0 percent and the small traders (not shown in chart) are Bullish-Extreme with a score of 88.5 percent.

COTTON Futures StatisticsSPECULATORSCOMMERCIALSSMALL TRADERS
– Percent of Open Interest Longs:46.232.97.3
– Percent of Open Interest Shorts:4.578.73.2
– Net Position:121,286-133,28511,999
– Gross Longs:134,30795,68721,371
– Gross Shorts:13,021228,9729,372
– Long to Short Ratio:10.3 to 10.4 to 12.3 to 1
NET POSITION TREND:
– COT Index Score (3 Year Range Pct):100.00.088.5
– COT Index Reading (3 Year Range):Bullish-ExtremeBearish-ExtremeBullish-Extreme
NET POSITION MOVEMENT INDEX:
– 6-Week Change in Strength Index:10.8-10.55.4


COCOA Futures:

US Year Treasury Notes Long Bonds Futures COT ChartThe COCOA large speculator standing this week recorded a net position of 43,997 contracts in the data reported through Tuesday. This was a weekly gain of 19,721 contracts from the previous week which had a total of 24,276 net contracts.

This week’s current strength score (the trader positioning range over the past three years, measured from 0 to 100) shows the speculators are currently Bullish with a score of 63.5 percent. The commercials are Bearish with a score of 35.7 percent and the small traders (not shown in chart) are Bullish with a score of 57.4 percent.

COCOA Futures StatisticsSPECULATORSCOMMERCIALSSMALL TRADERS
– Percent of Open Interest Longs:31.546.44.9
– Percent of Open Interest Shorts:14.065.63.2
– Net Position:43,997-48,3014,304
– Gross Longs:79,217116,79212,283
– Gross Shorts:35,220165,0937,979
– Long to Short Ratio:2.2 to 10.7 to 11.5 to 1
NET POSITION TREND:
– COT Index Score (3 Year Range Pct):63.535.757.4
– COT Index Reading (3 Year Range):BullishBearishBullish
NET POSITION MOVEMENT INDEX:
– 6-Week Change in Strength Index:9.4-10.515.7


WHEAT Futures:

Ultra US Year Treasury Notes Long Bonds Futures COT ChartThe WHEAT large speculator standing this week recorded a net position of 7,312 contracts in the data reported through Tuesday. This was a weekly rise of 10,957 contracts from the previous week which had a total of -3,645 net contracts.

This week’s current strength score (the trader positioning range over the past three years, measured from 0 to 100) shows the speculators are currently Bullish with a score of 53.2 percent. The commercials are Bearish with a score of 44.4 percent and the small traders (not shown in chart) are Bearish with a score of 49.0 percent.

WHEAT Futures StatisticsSPECULATORSCOMMERCIALSSMALL TRADERS
– Percent of Open Interest Longs:25.841.28.1
– Percent of Open Interest Shorts:23.840.211.0
– Net Position:7,3123,695-11,007
– Gross Longs:96,203153,94230,210
– Gross Shorts:88,891150,24741,217
– Long to Short Ratio:1.1 to 11.0 to 10.7 to 1
NET POSITION TREND:
– COT Index Score (3 Year Range Pct):53.244.449.0
– COT Index Reading (3 Year Range):BullishBearishBearish
NET POSITION MOVEMENT INDEX:
– 6-Week Change in Strength Index:-23.628.1-5.6


Article By InvestMacro.comReceive our weekly COT Reports by Email

*COT Report: The COT data, released weekly to the public each Friday, is updated through the most recent Tuesday (data is 3 days old) and shows a quick view of how large speculators or non-commercials (for-profit traders) were positioned in the futures markets.

The CFTC categorizes trader positions according to commercial hedgers (traders who use futures contracts for hedging as part of the business), non-commercials (large traders who speculate to realize trading profits) and nonreportable traders (usually small traders/speculators).

Find CFTC criteria here: (http://www.cftc.gov/MarketReports/CommitmentsofTraders/ExplanatoryNotes/index.htm).
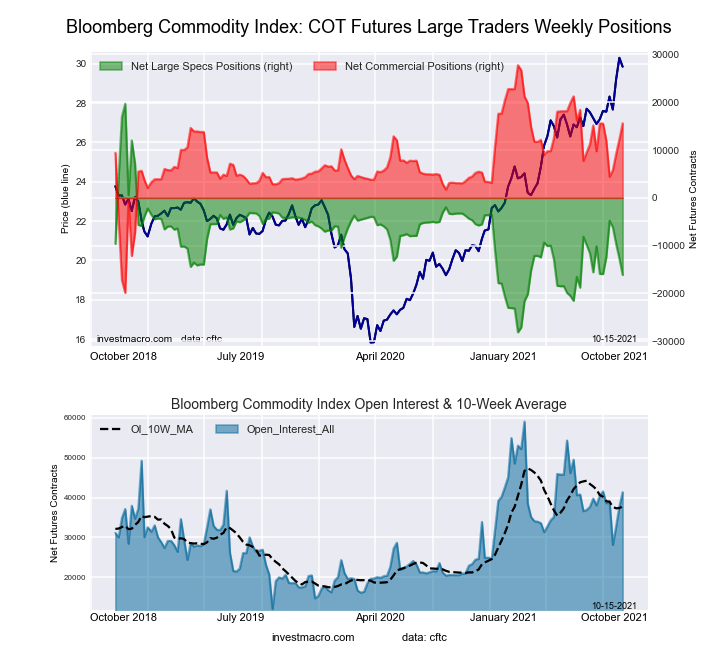
COT Metals Charts: Copper, Gold, Comex Silver, Platinum & Palladium

By InvestMacro.com COT Home | Data Tables | Data Downloads | Newsletter

Here are the latest charts and statistics for the Commitment of Traders (COT) data published by the Commodities Futures Trading Commission (CFTC).

The latest COT data is updated through Tuesday October 05 2021 and shows a quick view of how large traders (for-profit speculators and commercial entities) were positioned in the futures markets.


Data Snapshot of Commodity Market Traders | Columns Legend
Oct-05-2021OIOI-IndexSpec-NetSpec-IndexCom-NetCOM-IndexSmalls-NetSmalls-Index
WTI Crude2,230,79448398,30739-443,2595044,95278
Gold483,78921182,58253-203,7024721,12031
Silver139,763716,37939-27,7787211,3996
Copper185,6551614,41753-18,918464,50151
Palladium9,70514-3,23003,51099-28028
Platinum62,109255,51510-10,403944,88830
Natural Gas1,376,78850-133,7083896,6376137,07173
Brent197,79538-37,0215130,935426,08689
Heating Oil440,2867737,54892-66,885029,337100
Soybeans715,8352551,40143-22,59261-28,80924
Corn1,397,4584297,00568-237,59338-59,4129
Coffee306,3636366,57197-71,02244,45119
Sugar888,35428247,37587-293,1351345,76064
Wheat373,320177,312533,69544-11,00749


Gold Comex Futures:

Federal Funds 30-Day Bonds Futures COT ChartThe Gold Comex Futures large speculator standing this week recorded a net position of 182,582 contracts in the data reported through Tuesday. This was a weekly advance of 14,183 contracts from the previous week which had a total of 168,399 net contracts.

This week’s current strength score (the trader positioning range over the past three years, measured from 0 to 100) shows the speculators are currently Bullish with a score of 52.9 percent. The commercials are Bearish with a score of 47.4 percent and the small traders (not shown in chart) are Bearish with a score of 30.8 percent.

Gold Futures StatisticsSPECULATORSCOMMERCIALSSMALL TRADERS
– Percent of Open Interest Longs:61.223.69.1
– Percent of Open Interest Shorts:23.465.74.7
– Net Position:182,582-203,70221,120
– Gross Longs:295,939114,22944,017
– Gross Shorts:113,357317,93122,897
– Long to Short Ratio:2.6 to 10.4 to 11.9 to 1
NET POSITION TREND:
– COT Index Score (3 Year Range Pct):52.947.430.8
– COT Index Reading (3 Year Range):BullishBearishBearish
NET POSITION MOVEMENT INDEX:
– 6-Week Change in Strength Index:-7.78.1-7.5


Silver Comex Futures:

2-Year Treasury Bonds Futures COT ChartThe Silver Comex Futures large speculator standing this week recorded a net position of 16,379 contracts in the data reported through Tuesday. This was a weekly decrease of -326 contracts from the previous week which had a total of 16,705 net contracts.

This week’s current strength score (the trader positioning range over the past three years, measured from 0 to 100) shows the speculators are currently Bearish with a score of 38.7 percent. The commercials are Bullish with a score of 71.6 percent and the small traders (not shown in chart) are Bearish-Extreme with a score of 5.9 percent.

Silver Futures StatisticsSPECULATORSCOMMERCIALSSMALL TRADERS
– Percent of Open Interest Longs:45.831.217.4
– Percent of Open Interest Shorts:34.051.19.2
– Net Position:16,379-27,77811,399
– Gross Longs:63,95743,57324,323
– Gross Shorts:47,57871,35112,924
– Long to Short Ratio:1.3 to 10.6 to 11.9 to 1
NET POSITION TREND:
– COT Index Score (3 Year Range Pct):38.771.65.9
– COT Index Reading (3 Year Range):BearishBullishBearish-Extreme
NET POSITION MOVEMENT INDEX:
– 6-Week Change in Strength Index:-5.58.2-17.3


Copper Grade #1 Futures:

5-Year Treasury Bonds Futures COT ChartThe Copper Grade #1 Futures large speculator standing this week recorded a net position of 14,417 contracts in the data reported through Tuesday. This was a weekly decline of -4,160 contracts from the previous week which had a total of 18,577 net contracts.

This week’s current strength score (the trader positioning range over the past three years, measured from 0 to 100) shows the speculators are currently Bullish with a score of 52.7 percent. The commercials are Bearish with a score of 46.5 percent and the small traders (not shown in chart) are Bullish with a score of 51.3 percent.

Copper Futures StatisticsSPECULATORSCOMMERCIALSSMALL TRADERS
– Percent of Open Interest Longs:41.240.08.5
– Percent of Open Interest Shorts:33.450.26.0
– Net Position:14,417-18,9184,501
– Gross Longs:76,43774,34815,692
– Gross Shorts:62,02093,26611,191
– Long to Short Ratio:1.2 to 10.8 to 11.4 to 1
NET POSITION TREND:
– COT Index Score (3 Year Range Pct):52.746.551.3
– COT Index Reading (3 Year Range):BullishBearishBullish
NET POSITION MOVEMENT INDEX:
– 6-Week Change in Strength Index:4.2-3.6-2.8


Platinum Futures:

10-Year Treasury Notes Bonds Futures COT ChartThe Platinum Futures large speculator standing this week recorded a net position of 5,515 contracts in the data reported through Tuesday. This was a weekly lowering of -138 contracts from the previous week which had a total of 5,653 net contracts.

This week’s current strength score (the trader positioning range over the past three years, measured from 0 to 100) shows the speculators are currently Bearish-Extreme with a score of 10.3 percent. The commercials are Bullish-Extreme with a score of 94.2 percent and the small traders (not shown in chart) are Bearish with a score of 30.2 percent.

Platinum Futures StatisticsSPECULATORSCOMMERCIALSSMALL TRADERS
– Percent of Open Interest Longs:52.231.613.4
– Percent of Open Interest Shorts:43.348.45.5
– Net Position:5,515-10,4034,888
– Gross Longs:32,41419,6358,311
– Gross Shorts:26,89930,0383,423
– Long to Short Ratio:1.2 to 10.7 to 12.4 to 1
NET POSITION TREND:
– COT Index Score (3 Year Range Pct):10.394.230.2
– COT Index Reading (3 Year Range):Bearish-ExtremeBullish-ExtremeBearish
NET POSITION MOVEMENT INDEX:
– 6-Week Change in Strength Index:-5.27.0-17.9


Palladium Futures:

Ultra 10-Year Treasury Notes Bonds Futures COT ChartThe Palladium Futures large speculator standing this week recorded a net position of -3,230 contracts in the data reported through Tuesday. This was a weekly increase of 20 contracts from the previous week which had a total of -3,250 net contracts.

This week’s current strength score (the trader positioning range over the past three years, measured from 0 to 100) shows the speculators are currently Bearish-Extreme with a score of 0.1 percent. The commercials are Bullish-Extreme with a score of 99.5 percent and the small traders (not shown in chart) are Bearish with a score of 28.2 percent.

Palladium Futures StatisticsSPECULATORSCOMMERCIALSSMALL TRADERS
– Percent of Open Interest Longs:29.155.612.4
– Percent of Open Interest Shorts:62.419.415.3
– Net Position:-3,2303,510-280
– Gross Longs:2,8295,3941,205
– Gross Shorts:6,0591,8841,485
– Long to Short Ratio:0.5 to 12.9 to 10.8 to 1
NET POSITION TREND:
– COT Index Score (3 Year Range Pct):0.199.528.2
– COT Index Reading (3 Year Range):Bearish-ExtremeBullish-ExtremeBearish
NET POSITION MOVEMENT INDEX:
– 6-Week Change in Strength Index:-15.717.5-26.6


Article By InvestMacro.comReceive our weekly COT Reports by Email

*COT Report: The COT data, released weekly to the public each Friday, is updated through the most recent Tuesday (data is 3 days old) and shows a quick view of how large speculators or non-commercials (for-profit traders) were positioned in the futures markets.

The CFTC categorizes trader positions according to commercial hedgers (traders who use futures contracts for hedging as part of the business), non-commercials (large traders who speculate to realize trading profits) and nonreportable traders (usually small traders/speculators).

Find CFTC criteria here: (http://www.cftc.gov/MarketReports/CommitmentsofTraders/ExplanatoryNotes/index.htm).

COT Stock Market Charts: VIX Volatility, E-Mini Futures, SP500, Nasdaq, Russell-2000 & Dow Jones Industrial

By InvestMacro COT Home | Data Tables | Data Downloads | COT Newsletter

Here are the latest charts and statistics for the Commitment of Traders (COT) data published by the Commodities Futures Trading Commission (CFTC).

The latest COT data is updated through Tuesday October 05 2021 and shows a quick view of how large traders (for-profit speculators and commercial entities) were positioned in the futures markets.


Data Snapshot of Stock Market Traders | Columns Legend
Oct-05-2021OIOI-IndexSpec-NetSpec-IndexCom-NetCOM-IndexSmalls-NetSmalls-Index
S&P500-Mini2,437,353172,78466-96,9034924,11931
Nikkei 22522,46023-3,944402,255611,68948
Nasdaq-Mini225,15128-2,653745,45130-2,79838
DowJones-Mini96,24065-6,175281,042645,13366
VIX307,66429-69,5885775,89844-6,31032
Nikkei 225 Yen56,302384,5733419,84194-24,41431


VIX Volatility Futures:

Federal Funds 30-Day Bonds Futures COT ChartThe VIX Volatility large speculator standing this week recorded a net position of -69,588 contracts in the data reported through Tuesday. This was a weekly decline of -2,229 contracts from the previous week which had a total of -67,359 net contracts.

This week’s current strength score (the trader positioning range over the past three years, measured from 0 to 100) shows the speculators are currently Bullish with a score of 56.7 percent. The commercials are Bearish with a score of 44.4 percent and the small traders (not shown in chart) are Bearish with a score of 32.5 percent.

VIX Volatility Futures StatisticsSPECULATORSCOMMERCIALSSMALL TRADERS
– Percent of Open Interest Longs:15.553.27.3
– Percent of Open Interest Shorts:38.128.59.4
– Net Position:-69,58875,898-6,310
– Gross Longs:47,549163,65222,530
– Gross Shorts:117,13787,75428,840
– Long to Short Ratio:0.4 to 11.9 to 10.8 to 1
NET POSITION TREND:
– COT Index Score (3 Year Range Pct):56.744.432.5
– COT Index Reading (3 Year Range):BullishBearishBearish
NET POSITION MOVEMENT INDEX:
– 6-Week Change in Strength Index:1.4-1.41.0


S&P500 Mini Futures:

2-Year Treasury Bonds Futures COT ChartThe S&P500 Mini large speculator standing this week recorded a net position of 72,784 contracts in the data reported through Tuesday. This was a weekly reduction of -373 contracts from the previous week which had a total of 73,157 net contracts.

This week’s current strength score (the trader positioning range over the past three years, measured from 0 to 100) shows the speculators are currently Bullish with a score of 66.4 percent. The commercials are Bearish with a score of 48.5 percent and the small traders (not shown in chart) are Bearish with a score of 31.4 percent.

S&P500 Mini Futures StatisticsSPECULATORSCOMMERCIALSSMALL TRADERS
– Percent of Open Interest Longs:15.271.610.8
– Percent of Open Interest Shorts:12.275.69.8
– Net Position:72,784-96,90324,119
– Gross Longs:369,7311,744,827263,418
– Gross Shorts:296,9471,841,730239,299
– Long to Short Ratio:1.2 to 10.9 to 11.1 to 1
NET POSITION TREND:
– COT Index Score (3 Year Range Pct):66.448.531.4
– COT Index Reading (3 Year Range):BullishBearishBearish
NET POSITION MOVEMENT INDEX:
– 6-Week Change in Strength Index:10.25.2-18.3


Dow Jones Mini Futures:

5-Year Treasury Bonds Futures COT ChartThe Dow Jones Mini large speculator standing this week recorded a net position of -6,175 contracts in the data reported through Tuesday. This was a weekly lift of 1,506 contracts from the previous week which had a total of -7,681 net contracts.

This week’s current strength score (the trader positioning range over the past three years, measured from 0 to 100) shows the speculators are currently Bearish with a score of 28.2 percent. The commercials are Bullish with a score of 63.7 percent and the small traders (not shown in chart) are Bullish with a score of 65.9 percent.

Dow Jones Mini Futures StatisticsSPECULATORSCOMMERCIALSSMALL TRADERS
– Percent of Open Interest Longs:30.449.618.1
– Percent of Open Interest Shorts:36.948.612.8
– Net Position:-6,1751,0425,133
– Gross Longs:29,29047,77617,406
– Gross Shorts:35,46546,73412,273
– Long to Short Ratio:0.8 to 11.0 to 11.4 to 1
NET POSITION TREND:
– COT Index Score (3 Year Range Pct):28.263.765.9
– COT Index Reading (3 Year Range):BearishBullishBullish
NET POSITION MOVEMENT INDEX:
– 6-Week Change in Strength Index:-6.08.1-9.5


Nasdaq Mini Futures:

10-Year Treasury Notes Bonds Futures COT ChartThe Nasdaq Mini large speculator standing this week recorded a net position of -2,653 contracts in the data reported through Tuesday. This was a weekly reduction of -373 contracts from the previous week which had a total of -2,280 net contracts.

This week’s current strength score (the trader positioning range over the past three years, measured from 0 to 100) shows the speculators are currently Bullish with a score of 73.5 percent. The commercials are Bearish with a score of 29.9 percent and the small traders (not shown in chart) are Bearish with a score of 37.7 percent.

Nasdaq Mini Futures StatisticsSPECULATORSCOMMERCIALSSMALL TRADERS
– Percent of Open Interest Longs:26.154.317.4
– Percent of Open Interest Shorts:27.351.818.6
– Net Position:-2,6535,451-2,798
– Gross Longs:58,770122,15039,085
– Gross Shorts:61,423116,69941,883
– Long to Short Ratio:1.0 to 11.0 to 10.9 to 1
NET POSITION TREND:
– COT Index Score (3 Year Range Pct):73.529.937.7
– COT Index Reading (3 Year Range):BullishBearishBearish
NET POSITION MOVEMENT INDEX:
– 6-Week Change in Strength Index:-0.1-8.029.6


Russell 2000 Mini Futures:

Ultra 10-Year Treasury Notes Bonds Futures COT ChartThe Russell 2000 Mini large speculator standing this week recorded a net position of -58,613 contracts in the data reported through Tuesday. This was a weekly reduction of -2,970 contracts from the previous week which had a total of -55,643 net contracts.

This week’s current strength score (the trader positioning range over the past three years, measured from 0 to 100) shows the speculators are currently Bearish with a score of 20.5 percent. The commercials are Bullish with a score of 76.1 percent and the small traders (not shown in chart) are Bullish with a score of 60.0 percent.

Russell 2000 Mini Futures StatisticsSPECULATORSCOMMERCIALSSMALL TRADERS
– Percent of Open Interest Longs:13.279.06.5
– Percent of Open Interest Shorts:26.368.04.4
– Net Position:-58,61349,0789,535
– Gross Longs:58,691351,91229,146
– Gross Shorts:117,304302,83419,611
– Long to Short Ratio:0.5 to 11.2 to 11.5 to 1
NET POSITION TREND:
– COT Index Score (3 Year Range Pct):20.576.160.0
– COT Index Reading (3 Year Range):BearishBullishBullish
NET POSITION MOVEMENT INDEX:
– 6-Week Change in Strength Index:9.7-11.610.3


Nikkei Stock Average (USD) Futures:

US Year Treasury Notes Long Bonds Futures COT ChartThe Nikkei Stock Average (USD) large speculator standing this week recorded a net position of -3,944 contracts in the data reported through Tuesday. This was a weekly rise of 3,004 contracts from the previous week which had a total of -6,948 net contracts.

This week’s current strength score (the trader positioning range over the past three years, measured from 0 to 100) shows the speculators are currently Bearish with a score of 40.5 percent. The commercials are Bullish with a score of 61.1 percent and the small traders (not shown in chart) are Bearish with a score of 48.4 percent.

Nikkei Stock Average Futures StatisticsSPECULATORSCOMMERCIALSSMALL TRADERS
– Percent of Open Interest Longs:9.671.219.1
– Percent of Open Interest Shorts:27.261.111.6
– Net Position:-3,9442,2551,689
– Gross Longs:2,16615,9884,296
– Gross Shorts:6,11013,7332,607
– Long to Short Ratio:0.4 to 11.2 to 11.6 to 1
NET POSITION TREND:
– COT Index Score (3 Year Range Pct):40.561.148.4
– COT Index Reading (3 Year Range):BearishBullishBearish
NET POSITION MOVEMENT INDEX:
– 6-Week Change in Strength Index:0.5-11.743.5


MSCI EAFE Mini Futures:

Ultra US Year Treasury Notes Long Bonds Futures COT ChartThe MSCI EAFE Mini large speculator standing this week recorded a net position of 18,591 contracts in the data reported through Tuesday. This was a weekly decrease of -243 contracts from the previous week which had a total of 18,834 net contracts.

This week’s current strength score (the trader positioning range over the past three years, measured from 0 to 100) shows the speculators are currently Bearish with a score of 36.3 percent. The commercials are Bullish with a score of 58.8 percent and the small traders (not shown in chart) are Bullish with a score of 58.2 percent.

MSCI EAFE Mini Futures StatisticsSPECULATORSCOMMERCIALSSMALL TRADERS
– Percent of Open Interest Longs:8.388.52.6
– Percent of Open Interest Shorts:3.694.41.4
– Net Position:18,591-23,2554,664
– Gross Longs:32,645349,62610,285
– Gross Shorts:14,054372,8815,621
– Long to Short Ratio:2.3 to 10.9 to 11.8 to 1
NET POSITION TREND:
– COT Index Score (3 Year Range Pct):36.358.858.2
– COT Index Reading (3 Year Range):BearishBullishBullish
NET POSITION MOVEMENT INDEX:
– 6-Week Change in Strength Index:-22.920.114.5


Article By InvestMacro.comReceive our weekly COT Reports by Email

*COT Report: The COT data, released weekly to the public each Friday, is updated through the most recent Tuesday (data is 3 days old) and shows a quick view of how large speculators or non-commercials (for-profit traders) were positioned in the futures markets.

The CFTC categorizes trader positions according to commercial hedgers (traders who use futures contracts for hedging as part of the business), non-commercials (large traders who speculate to realize trading profits) and nonreportable traders (usually small traders/speculators).

Find CFTC criteria here: (http://www.cftc.gov/MarketReports/CommitmentsofTraders/ExplanatoryNotes/index.htm).

COT Currencies: US Dollar Speculators boost bullish bets higher for 14th time in 15 weeks

By InvestMacro.com COT Home | Data Tables | Data Downloads | Newsletter

Here are the latest charts and statistics for the Commitment of Traders (COT) data published by the Commodities Futures Trading Commission (CFTC).
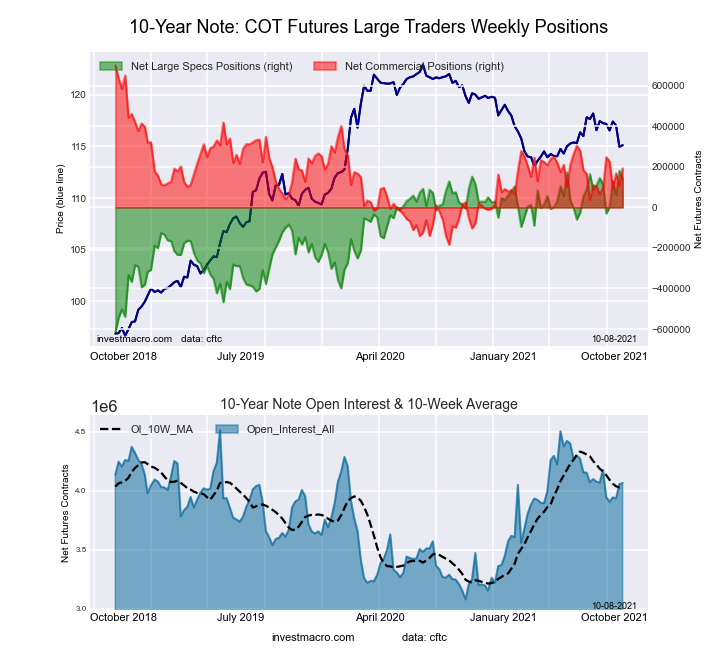
The latest COT data is updated through Tuesday September 28th 2021 and shows a quick view of how large traders (for-profit speculators and commercial entities) were positioned in the futures markets. All currency positions are in direct relation to the US dollar where, for example, a bet for the euro is a bet that the euro will rise versus the dollar while a bet against the euro will be a bet that the euro will decline versus the dollar.
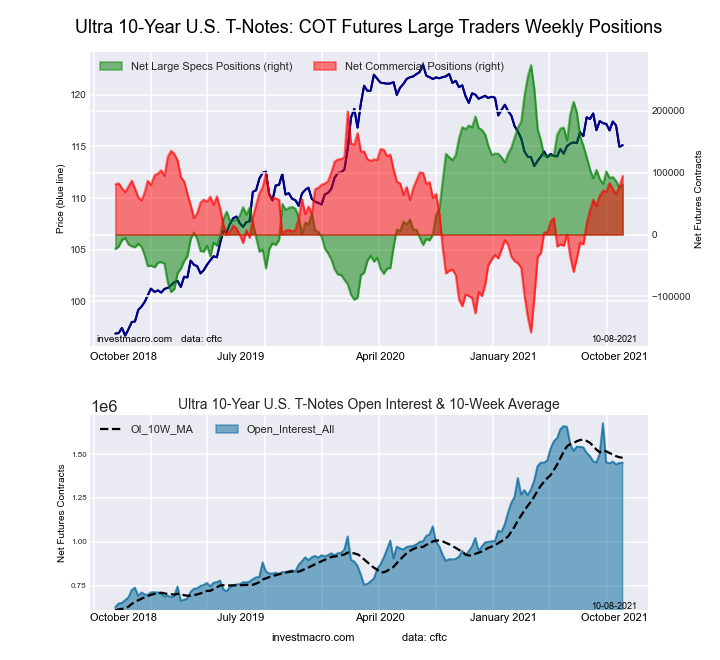
Speculative positions in the US Dollar Index have now risen to a 98-week high at over +26,000 net contracts this week. The dollar speculative bets have increased for six consecutive weeks and for fourteen out of the past fifteen week. The last time bullish bets were this high was November 12th of 2019 when positions totaled of +27,784 contracts.


US Dollar Index Futures:

Federal Funds 30-Day Bonds Futures COT ChartThe US Dollar Index large speculator standing this week equaled a net position of 26,461 contracts in the data reported through Tuesday. This was a weekly gain of 1,361 contracts from the previous week which had a total of 25,100 net contracts.

This week’s current strength score (the trader positioning range over the past three years, measured from 0 to 100) shows the speculators are currently Bullish with a score of 71.4 percent. The commercials are Bearish with a score of 21.8 percent and the small traders (not shown in chart) are Bullish-Extreme with a score of 94.4 percent.

US DOLLAR INDEX StatisticsSPECULATORSCOMMERCIALSSMALL TRADERS
– Percent of Open Interest Longs:81.42.812.9
– Percent of Open Interest Shorts:33.660.33.3
– Net Position:26,461-31,7725,311
– Gross Longs:45,0541,5657,110
– Gross Shorts:18,59333,3371,799
– Long to Short Ratio:2.4 to 10.0 to 14.0 to 1
NET POSITION TREND:
– COT Index Score (3 Year Range Pct):71.421.894.4
– COT Index Reading (3 Year Range):BullishBearishBullish-Extreme
NET POSITION MOVEMENT INDEX:
– 6-Week Change in Strength Index:12.5-12.86.0


Euro Currency Futures:

2-Year Treasury Bonds Futures COT ChartThe Euro Currency large speculator standing this week equaled a net position of 872 contracts in the data reported through Tuesday. This was a weekly decrease of -11,223 contracts from the previous week which had a total of 12,095 net contracts.

This week’s current strength score (the trader positioning range over the past three years, measured from 0 to 100) shows the speculators are currently Bearish with a score of 35.3 percent. The commercials are Bullish with a score of 67.1 percent and the small traders (not shown in chart) are Bearish with a score of 26.8 percent.

EURO Currency StatisticsSPECULATORSCOMMERCIALSSMALL TRADERS
– Percent of Open Interest Longs:29.256.713.0
– Percent of Open Interest Shorts:29.161.28.6
– Net Position:872-30,42429,552
– Gross Longs:195,043378,47687,150
– Gross Shorts:194,171408,90057,598
– Long to Short Ratio:1.0 to 10.9 to 11.5 to 1
NET POSITION TREND:
– COT Index Score (3 Year Range Pct):35.367.126.8
– COT Index Reading (3 Year Range):BearishBullishBearish
NET POSITION MOVEMENT INDEX:
– 6-Week Change in Strength Index:-17.412.122.3


British Pound Sterling Futures:

5-Year Treasury Bonds Futures COT ChartThe British Pound Sterling large speculator standing this week equaled a net position of 1,964 contracts in the data reported through Tuesday. This was a weekly lift of 2,182 contracts from the previous week which had a total of -218 net contracts.

This week’s current strength score (the trader positioning range over the past three years, measured from 0 to 100) shows the speculators are currently Bullish with a score of 75.4 percent. The commercials are Bearish with a score of 31.7 percent and the small traders (not shown in chart) are Bearish with a score of 44.5 percent.

BRITISH POUND StatisticsSPECULATORSCOMMERCIALSSMALL TRADERS
– Percent of Open Interest Longs:33.748.615.7
– Percent of Open Interest Shorts:32.646.618.8
– Net Position:1,9643,411-5,375
– Gross Longs:57,92383,47126,971
– Gross Shorts:55,95980,06032,346
– Long to Short Ratio:1.0 to 11.0 to 10.8 to 1
NET POSITION TREND:
– COT Index Score (3 Year Range Pct):75.431.744.5
– COT Index Reading (3 Year Range):BullishBearishBearish
NET POSITION MOVEMENT INDEX:
– 6-Week Change in Strength Index:-1.94.4-9.9


Japanese Yen Futures:

10-Year Treasury Notes Bonds Futures COT ChartThe Japanese Yen large speculator standing this week equaled a net position of -64,760 contracts in the data reported through Tuesday. This was a weekly fall of -8,689 contracts from the previous week which had a total of -56,071 net contracts.

This week’s current strength score (the trader positioning range over the past three years, measured from 0 to 100) shows the speculators are currently Bearish with a score of 30.4 percent. The commercials are Bullish with a score of 74.0 percent and the small traders (not shown in chart) are Bearish-Extreme with a score of 12.3 percent.

JAPANESE YEN StatisticsSPECULATORSCOMMERCIALSSMALL TRADERS
– Percent of Open Interest Longs:16.175.28.1
– Percent of Open Interest Shorts:45.637.316.5
– Net Position:-64,76083,279-18,519
– Gross Longs:35,328165,24617,806
– Gross Shorts:100,08881,96736,325
– Long to Short Ratio:0.4 to 12.0 to 10.5 to 1
NET POSITION TREND:
– COT Index Score (3 Year Range Pct):30.474.012.3
– COT Index Reading (3 Year Range):BearishBullishBearish-Extreme
NET POSITION MOVEMENT INDEX:
– 6-Week Change in Strength Index:-0.92.5-7.7


Swiss Franc Futures:

Ultra 10-Year Treasury Notes Bonds Futures COT ChartThe Swiss Franc large speculator standing this week equaled a net position of -11,587 contracts in the data reported through Tuesday. This was a weekly reduction of -2,370 contracts from the previous week which had a total of -9,217 net contracts.

This week’s current strength score (the trader positioning range over the past three years, measured from 0 to 100) shows the speculators are currently Bearish with a score of 49.7 percent. The commercials are Bullish with a score of 62.4 percent and the small traders (not shown in chart) are Bearish-Extreme with a score of 15.0 percent.

SWISS FRANC StatisticsSPECULATORSCOMMERCIALSSMALL TRADERS
– Percent of Open Interest Longs:11.572.915.5
– Percent of Open Interest Shorts:31.325.043.6
– Net Position:-11,58728,058-16,471
– Gross Longs:6,73442,6759,060
– Gross Shorts:18,32114,61725,531
– Long to Short Ratio:0.4 to 12.9 to 10.4 to 1
NET POSITION TREND:
– COT Index Score (3 Year Range Pct):49.762.415.0
– COT Index Reading (3 Year Range):BearishBullishBearish-Extreme
NET POSITION MOVEMENT INDEX:
– 6-Week Change in Strength Index:-30.028.0-22.4


Canadian Dollar Futures:

US Year Treasury Notes Long Bonds Futures COT ChartThe Canadian Dollar large speculator standing this week equaled a net position of -20,235 contracts in the data reported through Tuesday. This was a weekly rise of 7,642 contracts from the previous week which had a total of -27,877 net contracts.

This week’s current strength score (the trader positioning range over the past three years, measured from 0 to 100) shows the speculators are currently Bearish with a score of 38.1 percent. The commercials are Bullish with a score of 60.9 percent and the small traders (not shown in chart) are Bullish with a score of 54.9 percent.

CANADIAN DOLLAR StatisticsSPECULATORSCOMMERCIALSSMALL TRADERS
– Percent of Open Interest Longs:18.553.026.9
– Percent of Open Interest Shorts:35.740.422.3
– Net Position:-20,23514,8335,402
– Gross Longs:21,87362,54931,747
– Gross Shorts:42,10847,71626,345
– Long to Short Ratio:0.5 to 11.3 to 11.2 to 1
NET POSITION TREND:
– COT Index Score (3 Year Range Pct):38.160.954.9
– COT Index Reading (3 Year Range):BearishBullishBullish
NET POSITION MOVEMENT INDEX:
– 6-Week Change in Strength Index:-19.118.5-9.9


Australian Dollar Futures:

Ultra US Year Treasury Notes Long Bonds Futures COT ChartThe Australian Dollar large speculator standing this week equaled a net position of -86,383 contracts in the data reported through Tuesday. This was a weekly lowering of -799 contracts from the previous week which had a total of -85,584 net contracts.

This week’s current strength score (the trader positioning range over the past three years, measured from 0 to 100) shows the speculators are currently Bearish-Extreme with a score of 0.0 percent. The commercials are Bullish-Extreme with a score of 100.0 percent and the small traders (not shown in chart) are Bearish-Extreme with a score of 11.0 percent.

AUSTRALIAN DOLLAR StatisticsSPECULATORSCOMMERCIALSSMALL TRADERS
– Percent of Open Interest Longs:10.279.58.0
– Percent of Open Interest Shorts:57.921.718.1
– Net Position:-86,383104,698-18,315
– Gross Longs:18,407143,86314,460
– Gross Shorts:104,79039,16532,775
– Long to Short Ratio:0.2 to 13.7 to 10.4 to 1
NET POSITION TREND:
– COT Index Score (3 Year Range Pct):0.0100.011.0
– COT Index Reading (3 Year Range):Bearish-ExtremeBullish-ExtremeBearish-Extreme
NET POSITION MOVEMENT INDEX:
– 6-Week Change in Strength Index:-35.126.92.4


New Zealand Dollar Futures:

Eurodollar Bonds Futures COT ChartThe New Zealand Dollar large speculator standing this week equaled a net position of 10,246 contracts in the data reported through Tuesday. This was a weekly boost of 2,144 contracts from the previous week which had a total of 8,102 net contracts.

This week’s current strength score (the trader positioning range over the past three years, measured from 0 to 100) shows the speculators are currently Bullish-Extreme with a score of 88.5 percent. The commercials are Bearish-Extreme with a score of 14.1 percent and the small traders (not shown in chart) are Bullish with a score of 57.2 percent.

NEW ZEALAND DOLLAR StatisticsSPECULATORSCOMMERCIALSSMALL TRADERS
– Percent of Open Interest Longs:54.431.112.2
– Percent of Open Interest Shorts:24.062.611.1
– Net Position:10,246-10,598352
– Gross Longs:18,32410,4724,106
– Gross Shorts:8,07821,0703,754
– Long to Short Ratio:2.3 to 10.5 to 11.1 to 1
NET POSITION TREND:
– COT Index Score (3 Year Range Pct):88.514.157.2
– COT Index Reading (3 Year Range):Bullish-ExtremeBearish-ExtremeBullish
NET POSITION MOVEMENT INDEX:
– 6-Week Change in Strength Index:17.6-16.95.1


Mexican Peso Futures:

Ultra 10-Year Treasury Notes Bonds Futures COT ChartThe Mexican Peso large speculator standing this week equaled a net position of -19,595 contracts in the data reported through Tuesday. This was a weekly reduction of -580 contracts from the previous week which had a total of -19,015 net contracts.

This week’s current strength score (the trader positioning range over the past three years, measured from 0 to 100) shows the speculators are currently Bearish-Extreme with a score of 4.9 percent. The commercials are Bullish-Extreme with a score of 94.8 percent and the small traders (not shown in chart) are Bullish with a score of 52.0 percent.

MEXICAN PESO StatisticsSPECULATORSCOMMERCIALSSMALL TRADERS
– Percent of Open Interest Longs:53.542.33.2
– Percent of Open Interest Shorts:64.932.22.0
– Net Position:-19,59517,4872,108
– Gross Longs:92,42373,0865,510
– Gross Shorts:112,01855,5993,402
– Long to Short Ratio:0.8 to 11.3 to 11.6 to 1
NET POSITION TREND:
– COT Index Score (3 Year Range Pct):4.994.852.0
– COT Index Reading (3 Year Range):Bearish-ExtremeBullish-ExtremeBullish
NET POSITION MOVEMENT INDEX:
– 6-Week Change in Strength Index:-0.20.8-4.5


Brazilian Real Futures:

US Year Treasury Notes Long Bonds Futures COT ChartThe Brazilian Real large speculator standing this week equaled a net position of 5,086 contracts in the data reported through Tuesday. This was a weekly fall of -686 contracts from the previous week which had a total of 5,772 net contracts.

This week’s current strength score (the trader positioning range over the past three years, measured from 0 to 100) shows the speculators are currently Bullish with a score of 75.4 percent. The commercials are Bearish with a score of 25.5 percent and the small traders (not shown in chart) are Bullish with a score of 77.3 percent.

BRAZIL REAL StatisticsSPECULATORSCOMMERCIALSSMALL TRADERS
– Percent of Open Interest Longs:45.542.210.7
– Percent of Open Interest Shorts:27.363.57.6
– Net Position:5,086-5,956870
– Gross Longs:12,73711,7963,007
– Gross Shorts:7,65117,7522,137
– Long to Short Ratio:1.7 to 10.7 to 11.4 to 1
NET POSITION TREND:
– COT Index Score (3 Year Range Pct):75.425.577.3
– COT Index Reading (3 Year Range):BullishBearishBullish
NET POSITION MOVEMENT INDEX:
– 6-Week Change in Strength Index:-18.619.4-7.6


Russian Ruble Futures:

Ultra US Year Treasury Notes Long Bonds Futures COT ChartThe Russian Ruble large speculator standing this week equaled a net position of 20,828 contracts in the data reported through Tuesday. This was a weekly rise of 2,595 contracts from the previous week which had a total of 18,233 net contracts.

This week’s current strength score (the trader positioning range over the past three years, measured from 0 to 100) shows the speculators are currently Bullish with a score of 62.7 percent. The commercials are Bearish with a score of 34.3 percent and the small traders (not shown in chart) are Bullish-Extreme with a score of 85.6 percent.

RUSSIAN RUBLE StatisticsSPECULATORSCOMMERCIALSSMALL TRADERS
– Percent of Open Interest Longs:55.040.04.8
– Percent of Open Interest Shorts:14.783.21.9
– Net Position:20,828-22,3341,506
– Gross Longs:28,39720,6172,485
– Gross Shorts:7,56942,951979
– Long to Short Ratio:3.8 to 10.5 to 12.5 to 1
NET POSITION TREND:
– COT Index Score (3 Year Range Pct):62.734.385.6
– COT Index Reading (3 Year Range):BullishBearishBullish-Extreme
NET POSITION MOVEMENT INDEX:
– 6-Week Change in Strength Index:21.6-20.4-7.4


Bitcoin Futures:

Eurodollar Bonds Futures COT ChartThe Bitcoin large speculator standing this week equaled a net position of -883 contracts in the data reported through Tuesday. This was a weekly gain of 142 contracts from the previous week which had a total of -1,025 net contracts.

This week’s current strength score (the trader positioning range over the past three years, measured from 0 to 100) shows the speculators are currently Bullish with a score of 79.1 percent. The commercials are Bullish with a score of 52.6 percent and the small traders (not shown in chart) are Bearish-Extreme with a score of 12.9 percent.

BITCOIN StatisticsSPECULATORSCOMMERCIALSSMALL TRADERS
– Percent of Open Interest Longs:64.56.821.0
– Percent of Open Interest Shorts:77.04.311.0
– Net Position:-883178705
– Gross Longs:4,5394791,480
– Gross Shorts:5,422301775
– Long to Short Ratio:0.8 to 11.6 to 11.9 to 1
NET POSITION TREND:
– COT Index Score (3 Year Range Pct):79.152.612.9
– COT Index Reading (3 Year Range):BullishBullishBearish-Extreme
NET POSITION MOVEMENT INDEX:
– 6-Week Change in Strength Index:-4.452.6-11.3


Article By InvestMacro.comReceive our weekly COT Reports by Email

*COT Report: The COT data, released weekly to the public each Friday, is updated through the most recent Tuesday (data is 3 days old) and shows a quick view of how large speculators or non-commercials (for-profit traders) were positioned in the futures markets.

The CFTC categorizes trader positions according to commercial hedgers (traders who use futures contracts for hedging as part of the business), non-commercials (large traders who speculate to realize trading profits) and nonreportable traders (usually small traders/speculators).

Find CFTC criteria here: (http://www.cftc.gov/MarketReports/CommitmentsofTraders/ExplanatoryNotes/index.htm).