
By InvestMacro.com COT Home | Data Tables | Data Downloads | Newsletter
Here are the latest charts and statistics for the Commitment of Traders (COT) data published by the Commodities Futures Trading Commission (CFTC).
The latest COT data is updated through Tuesday October 12th 2021 and shows a quick view of how large traders (for-profit speculators and commercial entities) were positioned in the futures markets.
Highlighting this week’s data is Coffee which saw speculators raise their bullish net positions to the highest level in over four months. Coffee bullish bets have now increased for nine consecutive weeks and came in this week at a total of 69,085 contracts. This marks the second highest level on record and just below the all-time high set on June 1st of this year at a total of 70,773 contracts. Speculators currently have a 99 percent strength index score which means that speculative trader sentiment is at the very top of the range over the past three years.
| Oct-12-2021 | OI | OI-Index | Spec-Net | Spec-Index | Com-Net | COM-Index | Smalls-Net | Smalls-Index |
|---|---|---|---|---|---|---|---|---|
| WTI Crude | 2,231,227 | 48 | 404,776 | 41 | -453,684 | 46 | 48,908 | 84 |
| Gold | 484,382 | 21 | 185,539 | 54 | -207,614 | 46 | 22,075 | 33 |
| Silver | 139,403 | 6 | 17,987 | 40 | -30,292 | 69 | 12,305 | 11 |
| Copper | 194,817 | 23 | 22,481 | 59 | -25,867 | 42 | 3,386 | 45 |
| Palladium | 9,296 | 13 | -2,496 | 4 | 2,625 | 95 | -129 | 37 |
| Platinum | 59,344 | 21 | 10,919 | 18 | -16,756 | 85 | 5,837 | 43 |
| Natural Gas | 1,314,022 | 40 | -130,902 | 39 | 91,201 | 60 | 39,701 | 79 |
| Brent | 205,521 | 44 | -34,924 | 57 | 29,563 | 37 | 5,361 | 82 |
| Heating Oil | 429,908 | 68 | 39,137 | 100 | -65,644 | 1 | 26,507 | 90 |
| Soybeans | 759,101 | 35 | 41,990 | 41 | -9,665 | 64 | -32,325 | 18 |
| Corn | 1,400,377 | 4 | 279,288 | 66 | -223,336 | 40 | -55,952 | 11 |
| Coffee | 305,141 | 62 | 69,085 | 99 | -73,808 | 2 | 4,723 | 21 |
| Sugar | 891,672 | 25 | 246,188 | 87 | -294,674 | 12 | 48,486 | 68 |
| Wheat | 385,204 | 23 | -4,534 | 43 | 12,969 | 53 | -8,435 | 61 |
CORN Futures:
 The CORN large speculator standing this week reached a net position of 279,288 contracts in the data reported through Tuesday. This was a weekly reduction of -17,717 contracts from the previous week which had a total of 297,005 net contracts.
Free Reports:
 Download Our Metatrader 4 Indicators – Put Our Free MetaTrader 4 Custom Indicators on your charts when you join our Weekly Newsletter
 Get our Weekly Commitment of Traders Reports - See where the biggest traders (Hedge Funds and Commercial Hedgers) are positioned in the futures markets on a weekly basis.
This week’s current strength score (the trader positioning range over the past three years, measured from 0 to 100) shows the speculators are currently Bullish with a score of 65.7 percent. The commercials are Bearish with a score of 40.1 percent and the small traders (not shown in chart) are Bearish-Extreme with a score of 10.8 percent.
| CORN Futures Statistics | SPECULATORS | COMMERCIALS | SMALL TRADERS |
| – Percent of Open Interest Longs: | 28.8 | 49.0 | 9.3 |
| – Percent of Open Interest Shorts: | 8.8 | 64.9 | 13.3 |
| – Net Position: | 279,288 | -223,336 | -55,952 |
| – Gross Longs: | 402,726 | 685,667 | 130,383 |
| – Gross Shorts: | 123,438 | 909,003 | 186,335 |
| – Long to Short Ratio: | 3.3 to 1 | 0.8 to 1 | 0.7 to 1 |
| NET POSITION TREND: | |||
| – COT Index Score (3 Year Range Pct): | 65.7 | 40.1 | 10.8 |
| – COT Index Reading (3 Year Range): | Bullish | Bearish | Bearish-Extreme |
| NET POSITION MOVEMENT INDEX: | |||
| – 6-Week Change in Strength Index: | -3.2 | 1.2 | 9.4 |
SUGAR Futures:
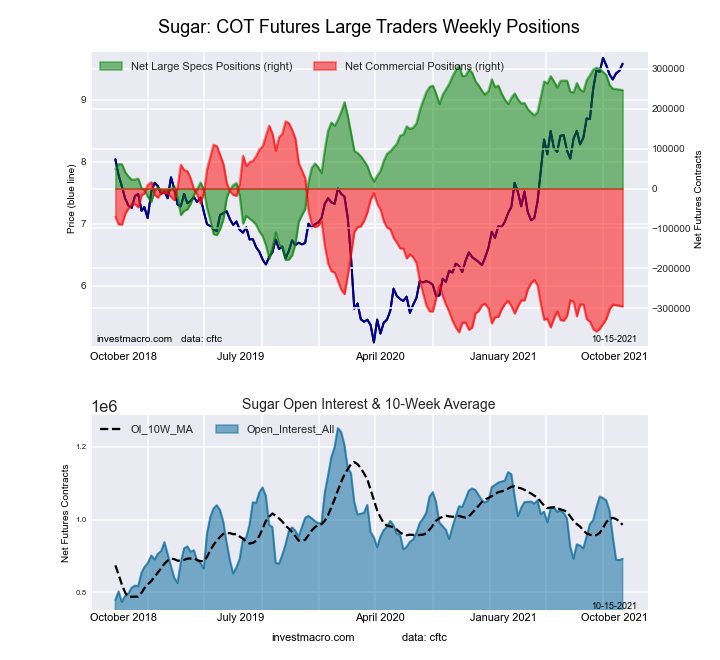 The SUGAR large speculator standing this week reached a net position of 246,188 contracts in the data reported through Tuesday. This was a weekly fall of -1,187 contracts from the previous week which had a total of 247,375 net contracts.
This week’s current strength score (the trader positioning range over the past three years, measured from 0 to 100) shows the speculators are currently Bullish-Extreme with a score of 87.2 percent. The commercials are Bearish-Extreme with a score of 12.3 percent and the small traders (not shown in chart) are Bullish with a score of 67.8 percent.
| SUGAR Futures Statistics | SPECULATORS | COMMERCIALS | SMALL TRADERS |
| – Percent of Open Interest Longs: | 33.0 | 41.9 | 10.7 |
| – Percent of Open Interest Shorts: | 5.4 | 74.9 | 5.3 |
| – Net Position: | 246,188 | -294,674 | 48,486 |
| – Gross Longs: | 294,624 | 373,277 | 95,832 |
| – Gross Shorts: | 48,436 | 667,951 | 47,346 |
| – Long to Short Ratio: | 6.1 to 1 | 0.6 to 1 | 2.0 to 1 |
| NET POSITION TREND: | |||
| – COT Index Score (3 Year Range Pct): | 87.2 | 12.3 | 67.8 |
| – COT Index Reading (3 Year Range): | Bullish-Extreme | Bearish-Extreme | Bullish |
| NET POSITION MOVEMENT INDEX: | |||
| – 6-Week Change in Strength Index: | -9.3 | 8.4 | 1.4 |
COFFEE Futures:
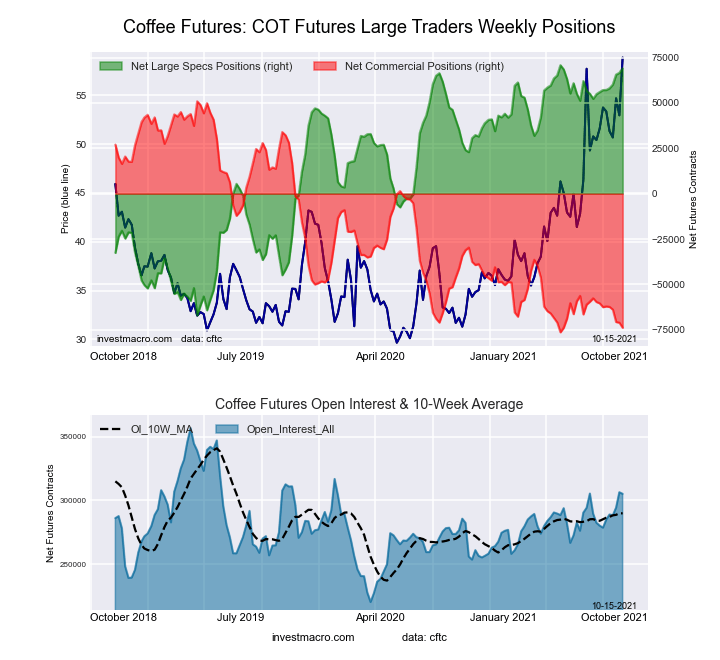 The COFFEE large speculator standing this week reached a net position of 69,085 contracts in the data reported through Tuesday. This was a weekly boost of 2,514 contracts from the previous week which had a total of 66,571 net contracts.
This week’s current strength score (the trader positioning range over the past three years, measured from 0 to 100) shows the speculators are currently Bullish-Extreme with a score of 98.8 percent. The commercials are Bearish-Extreme with a score of 2.0 percent and the small traders (not shown in chart) are Bearish with a score of 21.0 percent.
| COFFEE Futures Statistics | SPECULATORS | COMMERCIALS | SMALL TRADERS |
| – Percent of Open Interest Longs: | 27.9 | 39.7 | 3.9 |
| – Percent of Open Interest Shorts: | 5.3 | 63.9 | 2.4 |
| – Net Position: | 69,085 | -73,808 | 4,723 |
| – Gross Longs: | 85,275 | 121,291 | 12,017 |
| – Gross Shorts: | 16,190 | 195,099 | 7,294 |
| – Long to Short Ratio: | 5.3 to 1 | 0.6 to 1 | 1.6 to 1 |
| NET POSITION TREND: | |||
| – COT Index Score (3 Year Range Pct): | 98.8 | 2.0 | 21.0 |
| – COT Index Reading (3 Year Range): | Bullish-Extreme | Bearish-Extreme | Bearish |
| NET POSITION MOVEMENT INDEX: | |||
| – 6-Week Change in Strength Index: | 8.7 | -8.9 | -4.7 |
SOYBEANS Futures:
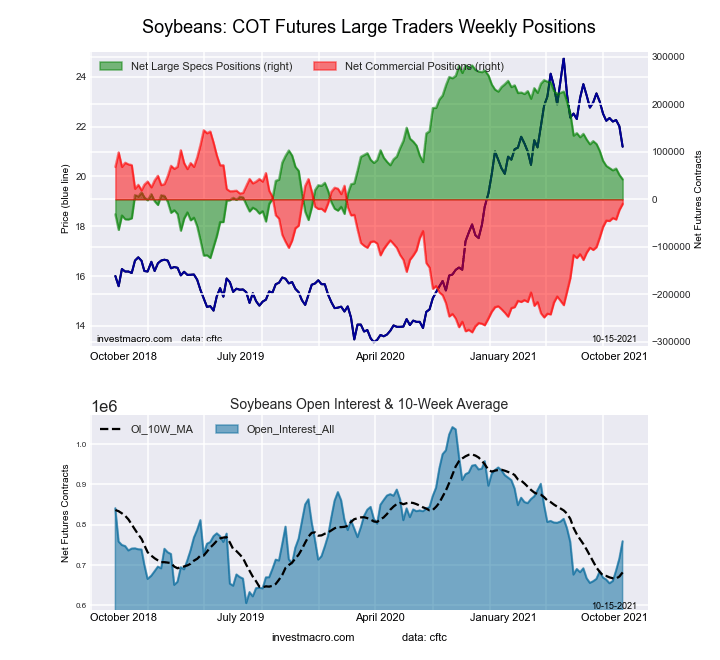 The SOYBEANS large speculator standing this week reached a net position of 41,990 contracts in the data reported through Tuesday. This was a weekly decline of -9,411 contracts from the previous week which had a total of 51,401 net contracts.
This week’s current strength score (the trader positioning range over the past three years, measured from 0 to 100) shows the speculators are currently Bearish with a score of 40.8 percent. The commercials are Bullish with a score of 63.5 percent and the small traders (not shown in chart) are Bearish-Extreme with a score of 18.1 percent.
| SOYBEANS Futures Statistics | SPECULATORS | COMMERCIALS | SMALL TRADERS |
| – Percent of Open Interest Longs: | 17.7 | 58.2 | 6.5 |
| – Percent of Open Interest Shorts: | 12.2 | 59.5 | 10.7 |
| – Net Position: | 41,990 | -9,665 | -32,325 |
| – Gross Longs: | 134,258 | 441,827 | 48,964 |
| – Gross Shorts: | 92,268 | 451,492 | 81,289 |
| – Long to Short Ratio: | 1.5 to 1 | 1.0 to 1 | 0.6 to 1 |
| NET POSITION TREND: | |||
| – COT Index Score (3 Year Range Pct): | 40.8 | 63.5 | 18.1 |
| – COT Index Reading (3 Year Range): | Bearish | Bullish | Bearish-Extreme |
| NET POSITION MOVEMENT INDEX: | |||
| – 6-Week Change in Strength Index: | -9.7 | 11.4 | -15.6 |
SOYBEAN MEAL Futures:
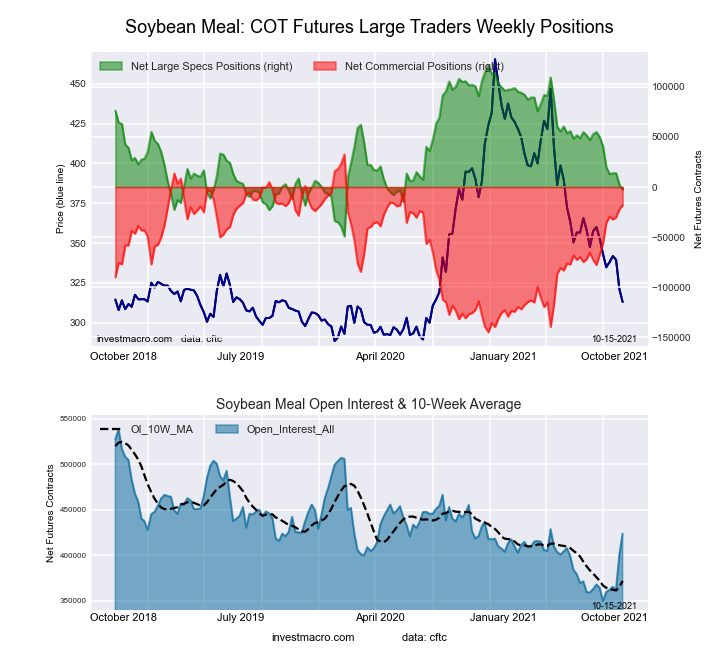 The SOYBEAN MEAL large speculator standing this week reached a net position of -2,587 contracts in the data reported through Tuesday. This was a weekly fall of -5,049 contracts from the previous week which had a total of 2,462 net contracts.
This week’s current strength score (the trader positioning range over the past three years, measured from 0 to 100) shows the speculators are currently Bearish with a score of 27.3 percent. The commercials are Bullish with a score of 71.5 percent and the small traders (not shown in chart) are Bullish with a score of 53.4 percent.
| SOYBEAN MEAL Futures Statistics | SPECULATORS | COMMERCIALS | SMALL TRADERS |
| – Percent of Open Interest Longs: | 19.7 | 49.0 | 12.2 |
| – Percent of Open Interest Shorts: | 20.3 | 53.3 | 7.3 |
| – Net Position: | -2,587 | -18,056 | 20,643 |
| – Gross Longs: | 83,287 | 207,667 | 51,696 |
| – Gross Shorts: | 85,874 | 225,723 | 31,053 |
| – Long to Short Ratio: | 1.0 to 1 | 0.9 to 1 | 1.7 to 1 |
| NET POSITION TREND: | |||
| – COT Index Score (3 Year Range Pct): | 27.3 | 71.5 | 53.4 |
| – COT Index Reading (3 Year Range): | Bearish | Bullish | Bullish |
| NET POSITION MOVEMENT INDEX: | |||
| – 6-Week Change in Strength Index: | -25.2 | 21.5 | 19.5 |
LIVE CATTLE Futures:
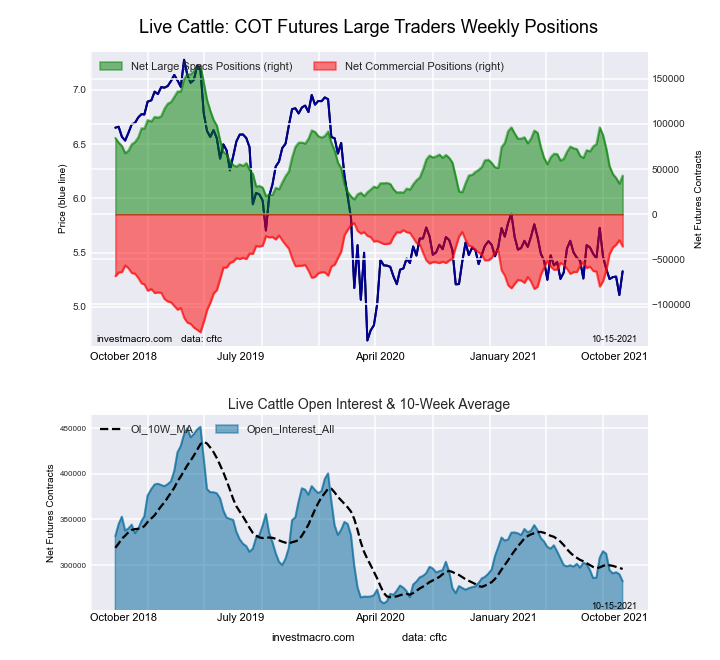 The LIVE CATTLE large speculator standing this week reached a net position of 42,789 contracts in the data reported through Tuesday. This was a weekly gain of 8,937 contracts from the previous week which had a total of 33,852 net contracts.
This week’s current strength score (the trader positioning range over the past three years, measured from 0 to 100) shows the speculators are currently Bearish-Extreme with a score of 17.7 percent. The commercials are Bullish with a score of 78.5 percent and the small traders (not shown in chart) are Bullish with a score of 70.2 percent.
| LIVE CATTLE Futures Statistics | SPECULATORS | COMMERCIALS | SMALL TRADERS |
| – Percent of Open Interest Longs: | 32.4 | 44.4 | 10.8 |
| – Percent of Open Interest Shorts: | 17.3 | 57.1 | 13.3 |
| – Net Position: | 42,789 | -35,822 | -6,967 |
| – Gross Longs: | 91,514 | 125,280 | 30,551 |
| – Gross Shorts: | 48,725 | 161,102 | 37,518 |
| – Long to Short Ratio: | 1.9 to 1 | 0.8 to 1 | 0.8 to 1 |
| NET POSITION TREND: | |||
| – COT Index Score (3 Year Range Pct): | 17.7 | 78.5 | 70.2 |
| – COT Index Reading (3 Year Range): | Bearish-Extreme | Bullish | Bullish |
| NET POSITION MOVEMENT INDEX: | |||
| – 6-Week Change in Strength Index: | -30.1 | 31.6 | 15.8 |
LEAN HOGS Futures:
 The LEAN HOGS large speculator standing this week reached a net position of 71,544 contracts in the data reported through Tuesday. This was a weekly lowering of -1,885 contracts from the previous week which had a total of 73,429 net contracts.
This week’s current strength score (the trader positioning range over the past three years, measured from 0 to 100) shows the speculators are currently Bullish-Extreme with a score of 85.3 percent. The commercials are Bearish with a score of 26.4 percent and the small traders (not shown in chart) are Bearish-Extreme with a score of 0.0 percent.
| LEAN HOGS Futures Statistics | SPECULATORS | COMMERCIALS | SMALL TRADERS |
| – Percent of Open Interest Longs: | 42.9 | 30.1 | 7.3 |
| – Percent of Open Interest Shorts: | 14.4 | 51.6 | 14.2 |
| – Net Position: | 71,544 | -54,143 | -17,401 |
| – Gross Longs: | 107,881 | 75,606 | 18,368 |
| – Gross Shorts: | 36,337 | 129,749 | 35,769 |
| – Long to Short Ratio: | 3.0 to 1 | 0.6 to 1 | 0.5 to 1 |
| NET POSITION TREND: | |||
| – COT Index Score (3 Year Range Pct): | 85.3 | 26.4 | 0.0 |
| – COT Index Reading (3 Year Range): | Bullish-Extreme | Bearish | Bearish-Extreme |
| NET POSITION MOVEMENT INDEX: | |||
| – 6-Week Change in Strength Index: | -3.1 | 5.6 | -10.6 |
COTTON Futures:
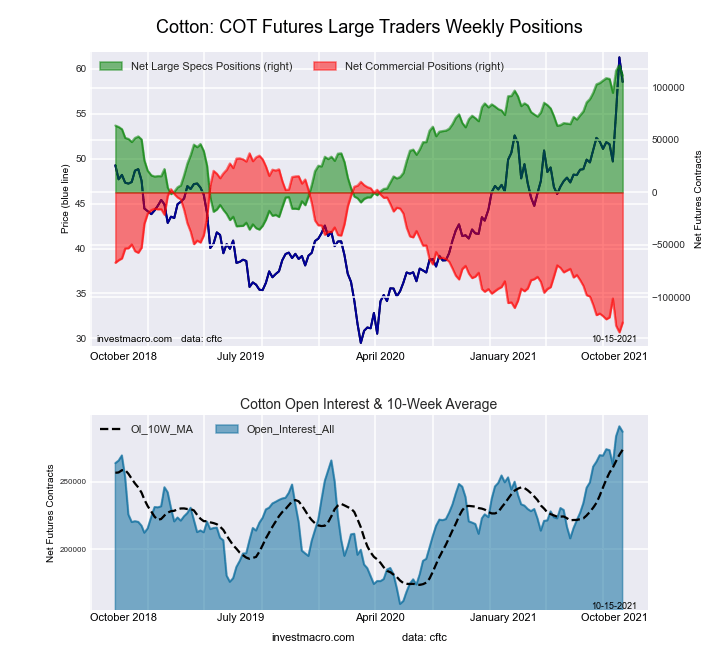 The COTTON large speculator standing this week reached a net position of 111,391 contracts in the data reported through Tuesday. This was a weekly fall of -9,895 contracts from the previous week which had a total of 121,286 net contracts.
This week’s current strength score (the trader positioning range over the past three years, measured from 0 to 100) shows the speculators are currently Bullish-Extreme with a score of 93.7 percent. The commercials are Bearish-Extreme with a score of 5.4 percent and the small traders (not shown in chart) are Bullish-Extreme with a score of 92.6 percent.
| COTTON Futures Statistics | SPECULATORS | COMMERCIALS | SMALL TRADERS |
| – Percent of Open Interest Longs: | 43.3 | 35.8 | 7.5 |
| – Percent of Open Interest Shorts: | 4.5 | 79.0 | 3.1 |
| – Net Position: | 111,391 | -124,049 | 12,658 |
| – Gross Longs: | 124,338 | 102,682 | 21,438 |
| – Gross Shorts: | 12,947 | 226,731 | 8,780 |
| – Long to Short Ratio: | 9.6 to 1 | 0.5 to 1 | 2.4 to 1 |
| NET POSITION TREND: | |||
| – COT Index Score (3 Year Range Pct): | 93.7 | 5.4 | 92.6 |
| – COT Index Reading (3 Year Range): | Bullish-Extreme | Bearish-Extreme | Bullish-Extreme |
| NET POSITION MOVEMENT INDEX: | |||
| – 6-Week Change in Strength Index: | 3.0 | -3.6 | 9.6 |
COCOA Futures:
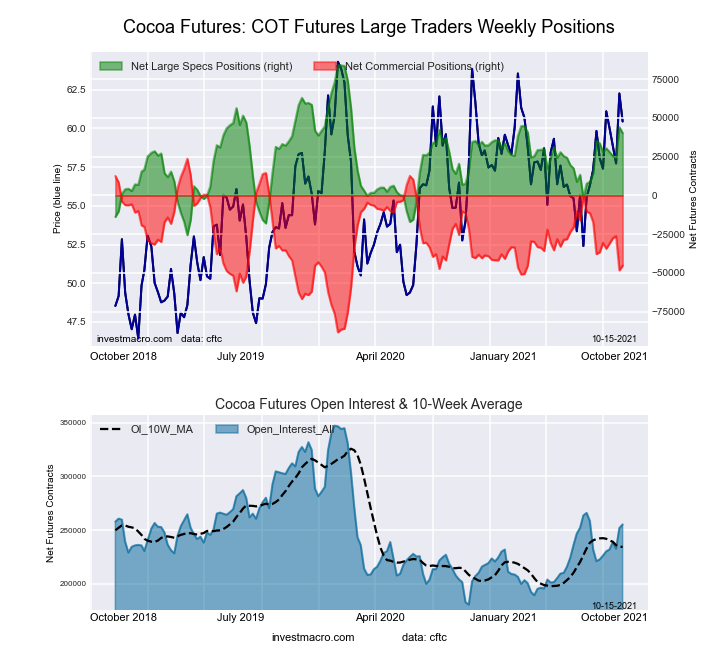 The COCOA large speculator standing this week reached a net position of 40,221 contracts in the data reported through Tuesday. This was a weekly reduction of -3,776 contracts from the previous week which had a total of 43,997 net contracts.
This week’s current strength score (the trader positioning range over the past three years, measured from 0 to 100) shows the speculators are currently Bullish with a score of 60.0 percent. The commercials are Bearish with a score of 38.4 percent and the small traders (not shown in chart) are Bullish with a score of 66.2 percent.
| COCOA Futures Statistics | SPECULATORS | COMMERCIALS | SMALL TRADERS |
| – Percent of Open Interest Longs: | 30.8 | 45.1 | 5.2 |
| – Percent of Open Interest Shorts: | 15.0 | 62.9 | 3.2 |
| – Net Position: | 40,221 | -45,299 | 5,078 |
| – Gross Longs: | 78,546 | 115,118 | 13,171 |
| – Gross Shorts: | 38,325 | 160,417 | 8,093 |
| – Long to Short Ratio: | 2.0 to 1 | 0.7 to 1 | 1.6 to 1 |
| NET POSITION TREND: | |||
| – COT Index Score (3 Year Range Pct): | 60.0 | 38.4 | 66.2 |
| – COT Index Reading (3 Year Range): | Bullish | Bearish | Bullish |
| NET POSITION MOVEMENT INDEX: | |||
| – 6-Week Change in Strength Index: | 11.2 | -13.1 | 27.2 |
WHEAT Futures:
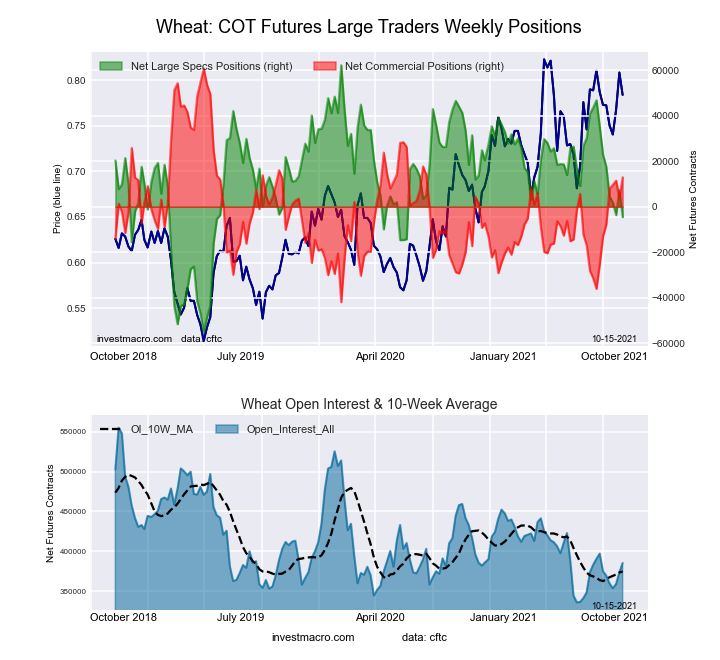 The WHEAT large speculator standing this week reached a net position of -4,534 contracts in the data reported through Tuesday. This was a weekly fall of -11,846 contracts from the previous week which had a total of 7,312 net contracts.
This week’s current strength score (the trader positioning range over the past three years, measured from 0 to 100) shows the speculators are currently Bearish with a score of 43.1 percent. The commercials are Bullish with a score of 53.5 percent and the small traders (not shown in chart) are Bullish with a score of 61.3 percent.
| WHEAT Futures Statistics | SPECULATORS | COMMERCIALS | SMALL TRADERS |
| – Percent of Open Interest Longs: | 24.6 | 41.3 | 8.1 |
| – Percent of Open Interest Shorts: | 25.8 | 37.9 | 10.3 |
| – Net Position: | -4,534 | 12,969 | -8,435 |
| – Gross Longs: | 94,728 | 159,131 | 31,296 |
| – Gross Shorts: | 99,262 | 146,162 | 39,731 |
| – Long to Short Ratio: | 1.0 to 1 | 1.1 to 1 | 0.8 to 1 |
| NET POSITION TREND: | |||
| – COT Index Score (3 Year Range Pct): | 43.1 | 53.5 | 61.3 |
| – COT Index Reading (3 Year Range): | Bearish | Bullish | Bullish |
| NET POSITION MOVEMENT INDEX: | |||
| – 6-Week Change in Strength Index: | -23.3 | 25.2 | 6.8 |
Article By InvestMacro.com – Receive our weekly COT Reports by Email
*COT Report: The COT data, released weekly to the public each Friday, is updated through the most recent Tuesday (data is 3 days old) and shows a quick view of how large speculators or non-commercials (for-profit traders) were positioned in the futures markets.
The CFTC categorizes trader positions according to commercial hedgers (traders who use futures contracts for hedging as part of the business), non-commercials (large traders who speculate to realize trading profits) and nonreportable traders (usually small traders/speculators).
Find CFTC criteria here: (http://www.cftc.gov/MarketReports/CommitmentsofTraders/ExplanatoryNotes/index.htm).

- Geopolitical and macroeconomic conditions continue to pressure market sentiment Jul 20, 2026
- USD/JPY Poised to Continue Gains as Expensive Oil and Lack of Support Weigh on Yen Jul 20, 2026
- COT Metals Charts: Weekly Speculator Bets led by Copper & Steel Jul 18, 2026
- COT Bonds Charts: Weekly Speculator Bets led by 2-Year, SOFR 3M & 5-Year Bonds Jul 18, 2026
- COT Energy Charts: Weekly Speculator Bets led by Brent Oil & Heating Oil Jul 18, 2026
- COT Soft Commodities Charts: Weekly Speculator Bets led by Wheat, Corn & Soybean Meal Jul 18, 2026
- The Bank of Canada kept its interest rate unchanged. Platinum prices reached a three‑week high Jul 16, 2026
- Stock indices rose after the release of US inflation data. China’s GDP slowed sharply Jul 15, 2026
- GBP/USD Awaits Political News: What Will Happen Next Jul 15, 2026
- USD/JPY Holds at Highs: Pressure Lingers on Yen Jul 14, 2026