
By InvestMacro COT Home | COT Tables | Data Downloads | Newsletter
Here are the latest charts and statistics for the Commitment of Traders (COT) data published by the Commodities Futures Trading Commission (CFTC).
The latest COT data is updated through Tuesday October 5th 2021 and shows a quick view of how large traders (for-profit speculators and commercial entities) were positioned in the futures markets.
| Oct-05-2021 | OI | OI-Index | Spec-Net | Spec-Index | Com-Net | COM-Index | Smalls-Net | Smalls-Index |
|---|---|---|---|---|---|---|---|---|
| Eurodollar | 12,461,197 | 64 | -760,843 | 36 | 996,972 | 58 | -236,129 | 72 |
| FedFunds | 1,112,644 | 11 | -78,348 | 30 | 89,978 | 71 | -11,630 | 40 |
| 2-Year | 1,773,474 | 0 | -42,527 | 83 | 53,740 | 28 | -11,213 | 19 |
| Long T-Bond | 1,232,198 | 56 | -98,649 | 58 | 109,987 | 55 | -11,338 | 44 |
| 10-Year | 4,063,952 | 69 | 141,333 | 95 | 192,710 | 43 | -334,043 | 0 |
| 5-Year | 3,571,119 | 24 | -314,824 | 55 | 547,985 | 62 | -233,161 | 0 |
3-Month Eurodollars Futures:
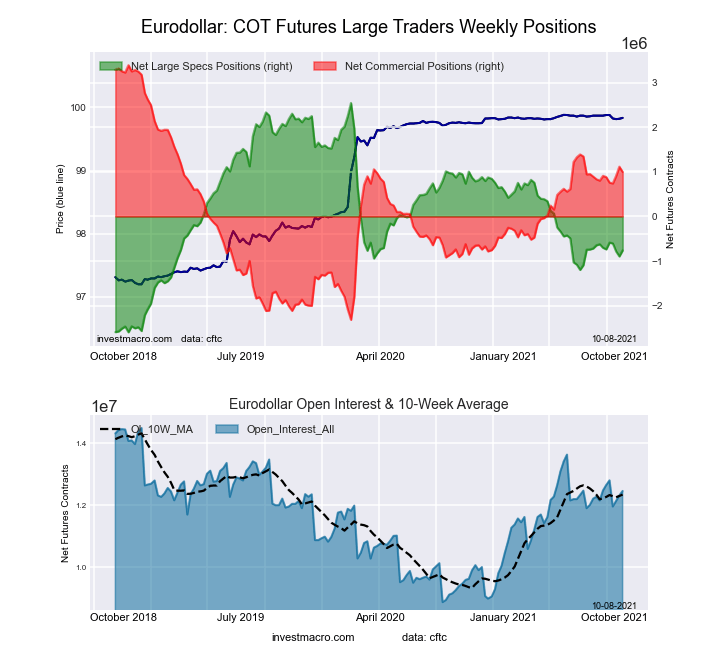 The 3-Month Eurodollars large speculator standing this week reached a net position of -760,843 contracts in the data reported through Tuesday. This was a weekly lift of 134,187 contracts from the previous week which had a total of -895,030 net contracts.
This week’s current strength score (the trader positioning range over the past three years, measured from 0 to 100) shows the speculators are currently Bearish with a score of 35.7 percent. The commercials are Bullish with a score of 58.1 percent and the small traders (not shown in chart) are Bullish with a score of 72.1 percent.
Free Reports:
 Download Our Metatrader 4 Indicators – Put Our Free MetaTrader 4 Custom Indicators on your charts when you join our Weekly Newsletter
 Get our Weekly Commitment of Traders Reports - See where the biggest traders (Hedge Funds and Commercial Hedgers) are positioned in the futures markets on a weekly basis.
| 3-Month Eurodollars Statistics | SPECULATORS | COMMERCIALS | SMALL TRADERS |
| – Percent of Open Interest Longs: | 14.0 | 60.7 | 4.8 |
| – Percent of Open Interest Shorts: | 20.1 | 52.7 | 6.7 |
| – Net Position: | -760,843 | 996,972 | -236,129 |
| – Gross Longs: | 1,746,555 | 7,566,476 | 594,467 |
| – Gross Shorts: | 2,507,398 | 6,569,504 | 830,596 |
| – Long to Short Ratio: | 0.7 to 1 | 1.2 to 1 | 0.7 to 1 |
| NET POSITION TREND: | |||
| – COT Index Score (3 Year Range Pct): | 35.7 | 58.1 | 72.1 |
| – COT Index Reading (3 Year Range): | Bearish | Bullish | Bullish |
| NET POSITION MOVEMENT INDEX: | |||
| – 6-Week Change in Strength Index: | -1.1 | 1.5 | -3.7 |
30-Day Federal Funds Futures:
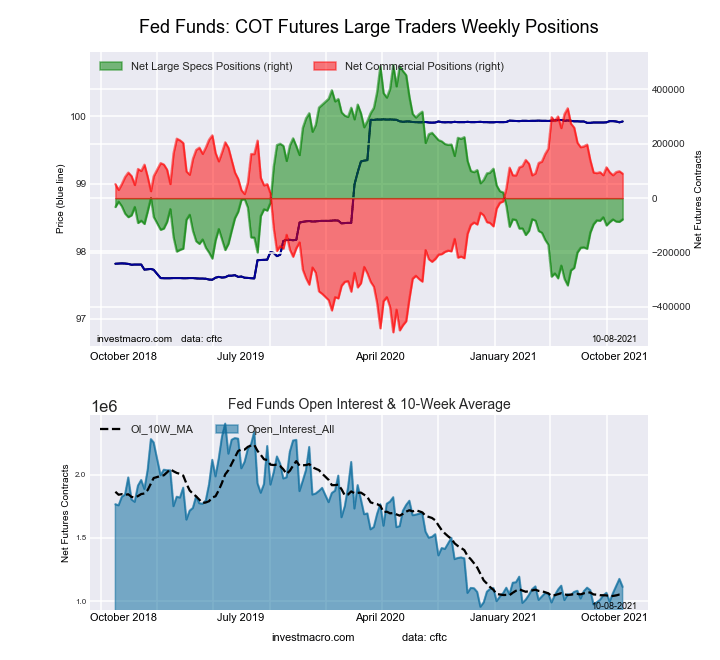 The 30-Day Federal Funds large speculator standing this week reached a net position of -78,348 contracts in the data reported through Tuesday. This was a weekly rise of 8,633 contracts from the previous week which had a total of -86,981 net contracts.
This week’s current strength score (the trader positioning range over the past three years, measured from 0 to 100) shows the speculators are currently Bearish with a score of 29.9 percent. The commercials are Bullish with a score of 70.8 percent and the small traders (not shown in chart) are Bearish with a score of 40.2 percent.
| 30-Day Federal Funds Statistics | SPECULATORS | COMMERCIALS | SMALL TRADERS |
| – Percent of Open Interest Longs: | 5.4 | 77.0 | 2.2 |
| – Percent of Open Interest Shorts: | 12.4 | 68.9 | 3.2 |
| – Net Position: | -78,348 | 89,978 | -11,630 |
| – Gross Longs: | 59,841 | 856,937 | 24,136 |
| – Gross Shorts: | 138,189 | 766,959 | 35,766 |
| – Long to Short Ratio: | 0.4 to 1 | 1.1 to 1 | 0.7 to 1 |
| NET POSITION TREND: | |||
| – COT Index Score (3 Year Range Pct): | 29.9 | 70.8 | 40.2 |
| – COT Index Reading (3 Year Range): | Bearish | Bullish | Bearish |
| NET POSITION MOVEMENT INDEX: | |||
| – 6-Week Change in Strength Index: | -1.0 | 0.7 | 5.3 |
2-Year Treasury Note Futures:
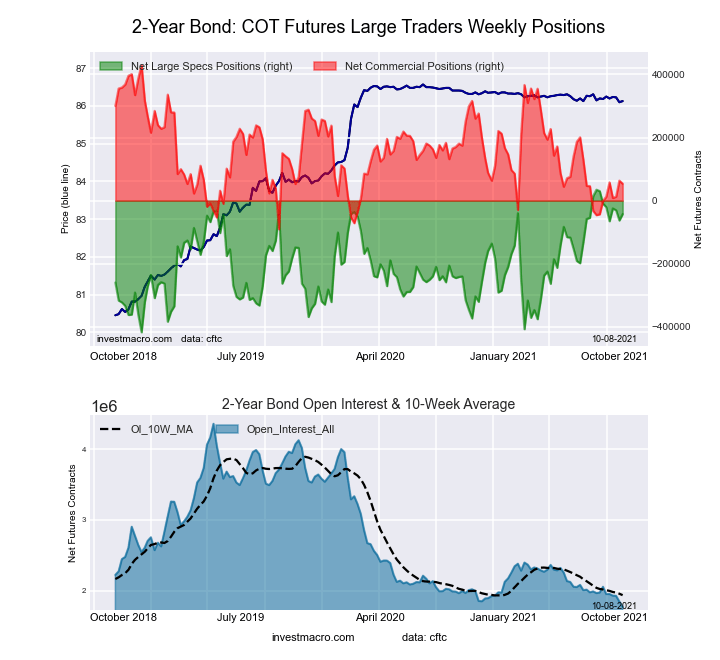 The 2-Year Treasury Note large speculator standing this week reached a net position of -42,527 contracts in the data reported through Tuesday. This was a weekly boost of 20,302 contracts from the previous week which had a total of -62,829 net contracts.
This week’s current strength score (the trader positioning range over the past three years, measured from 0 to 100) shows the speculators are currently Bullish-Extreme with a score of 82.9 percent. The commercials are Bearish with a score of 27.8 percent and the small traders (not shown in chart) are Bearish-Extreme with a score of 19.3 percent.
| 2-Year Treasury Note Statistics | SPECULATORS | COMMERCIALS | SMALL TRADERS |
| – Percent of Open Interest Longs: | 17.5 | 72.0 | 7.7 |
| – Percent of Open Interest Shorts: | 19.9 | 69.0 | 8.3 |
| – Net Position: | -42,527 | 53,740 | -11,213 |
| – Gross Longs: | 310,731 | 1,277,218 | 136,061 |
| – Gross Shorts: | 353,258 | 1,223,478 | 147,274 |
| – Long to Short Ratio: | 0.9 to 1 | 1.0 to 1 | 0.9 to 1 |
| NET POSITION TREND: | |||
| – COT Index Score (3 Year Range Pct): | 82.9 | 27.8 | 19.3 |
| – COT Index Reading (3 Year Range): | Bullish-Extreme | Bearish | Bearish-Extreme |
| NET POSITION MOVEMENT INDEX: | |||
| – 6-Week Change in Strength Index: | -7.3 | 10.5 | -12.8 |
5-Year Treasury Note Futures:
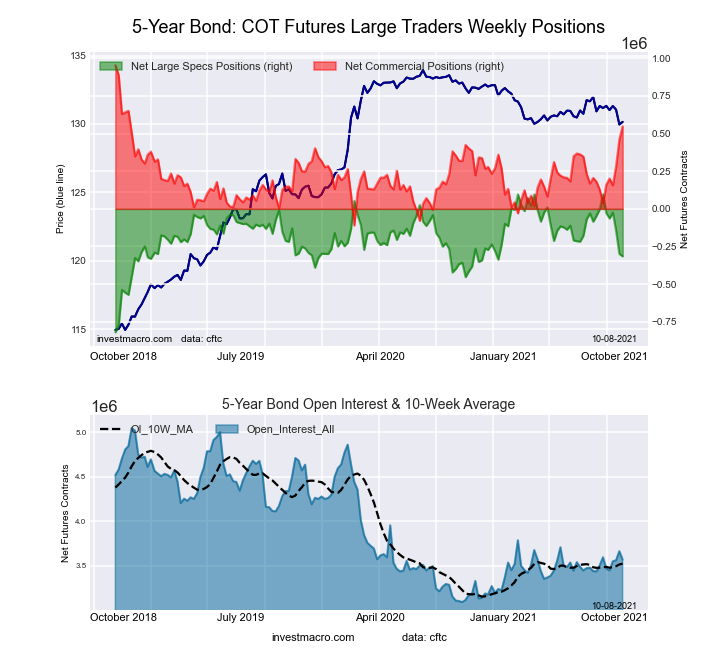 The 5-Year Treasury Note large speculator standing this week reached a net position of -314,824 contracts in the data reported through Tuesday. This was a weekly lowering of -15,628 contracts from the previous week which had a total of -299,196 net contracts.
This week’s current strength score (the trader positioning range over the past three years, measured from 0 to 100) shows the speculators are currently Bullish with a score of 55.2 percent. The commercials are Bullish with a score of 61.8 percent and the small traders (not shown in chart) are Bearish-Extreme with a score of 0.0 percent.
| 5-Year Treasury Note Statistics | SPECULATORS | COMMERCIALS | SMALL TRADERS |
| – Percent of Open Interest Longs: | 9.7 | 79.6 | 7.0 |
| – Percent of Open Interest Shorts: | 18.5 | 64.3 | 13.5 |
| – Net Position: | -314,824 | 547,985 | -233,161 |
| – Gross Longs: | 345,060 | 2,842,467 | 248,462 |
| – Gross Shorts: | 659,884 | 2,294,482 | 481,623 |
| – Long to Short Ratio: | 0.5 to 1 | 1.2 to 1 | 0.5 to 1 |
| NET POSITION TREND: | |||
| – COT Index Score (3 Year Range Pct): | 55.2 | 61.8 | 0.0 |
| – COT Index Reading (3 Year Range): | Bullish | Bullish | Bearish-Extreme |
| NET POSITION MOVEMENT INDEX: | |||
| – 6-Week Change in Strength Index: | -44.8 | 48.0 | -33.1 |
10-Year Treasury Note Futures:
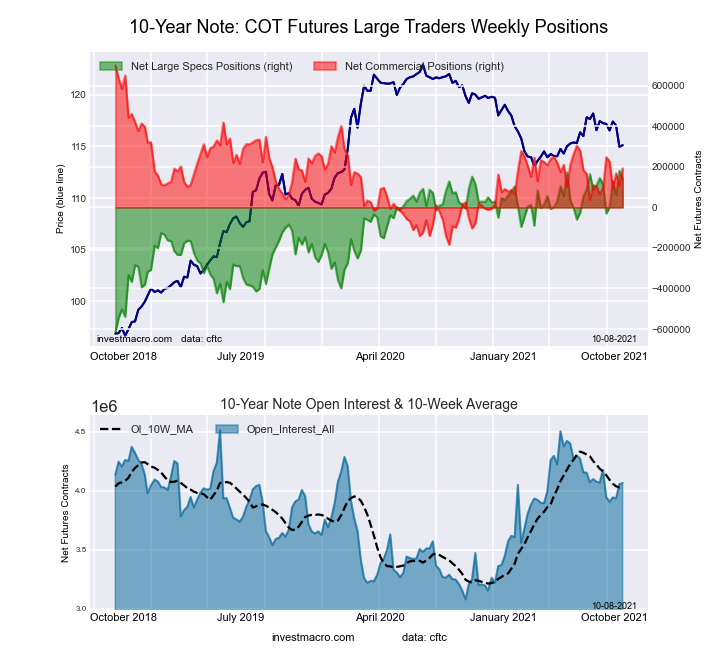 The 10-Year Treasury Note large speculator standing this week reached a net position of 141,333 contracts in the data reported through Tuesday. This was a weekly lowering of -39,874 contracts from the previous week which had a total of 181,207 net contracts.
This week’s current strength score (the trader positioning range over the past three years, measured from 0 to 100) shows the speculators are currently Bullish-Extreme with a score of 95.0 percent. The commercials are Bearish with a score of 42.6 percent and the small traders (not shown in chart) are Bearish-Extreme with a score of 0.0 percent.
| 10-Year Treasury Note Statistics | SPECULATORS | COMMERCIALS | SMALL TRADERS |
| – Percent of Open Interest Longs: | 20.9 | 69.1 | 7.1 |
| – Percent of Open Interest Shorts: | 17.4 | 64.4 | 15.3 |
| – Net Position: | 141,333 | 192,710 | -334,043 |
| – Gross Longs: | 848,256 | 2,808,775 | 289,697 |
| – Gross Shorts: | 706,923 | 2,616,065 | 623,740 |
| – Long to Short Ratio: | 1.2 to 1 | 1.1 to 1 | 0.5 to 1 |
| NET POSITION TREND: | |||
| – COT Index Score (3 Year Range Pct): | 95.0 | 42.6 | 0.0 |
| – COT Index Reading (3 Year Range): | Bullish-Extreme | Bearish | Bearish-Extreme |
| NET POSITION MOVEMENT INDEX: | |||
| – 6-Week Change in Strength Index: | 3.5 | 11.1 | -29.7 |
Ultra 10-Year Notes Futures:
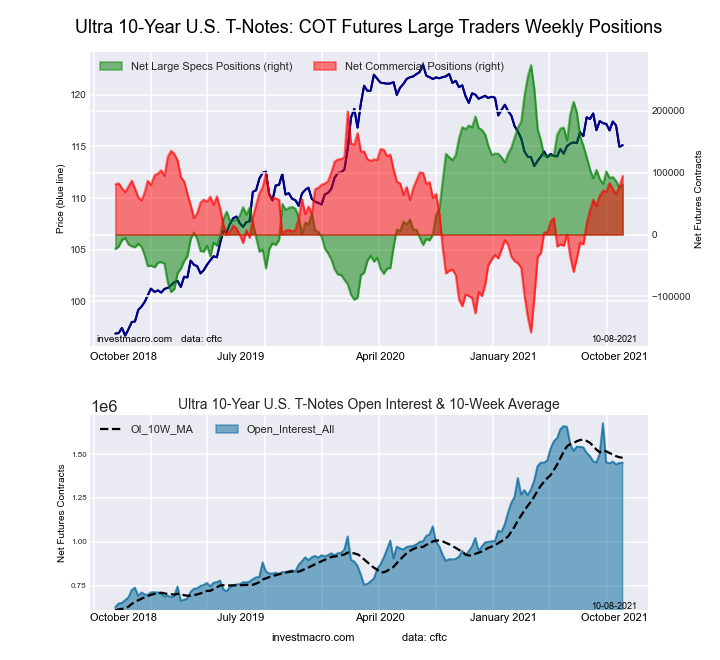 The Ultra 10-Year Notes large speculator standing this week reached a net position of 80,879 contracts in the data reported through Tuesday. This was a weekly increase of 5,032 contracts from the previous week which had a total of 75,847 net contracts.
This week’s current strength score (the trader positioning range over the past three years, measured from 0 to 100) shows the speculators are currently Bearish with a score of 49.1 percent. The commercials are Bullish with a score of 70.8 percent and the small traders (not shown in chart) are Bearish-Extreme with a score of 0.0 percent.
| Ultra 10-Year Notes Statistics | SPECULATORS | COMMERCIALS | SMALL TRADERS |
| – Percent of Open Interest Longs: | 17.1 | 74.9 | 7.6 |
| – Percent of Open Interest Shorts: | 11.5 | 68.4 | 19.7 |
| – Net Position: | 80,879 | 94,700 | -175,579 |
| – Gross Longs: | 248,258 | 1,087,022 | 110,087 |
| – Gross Shorts: | 167,379 | 992,322 | 285,666 |
| – Long to Short Ratio: | 1.5 to 1 | 1.1 to 1 | 0.4 to 1 |
| NET POSITION TREND: | |||
| – COT Index Score (3 Year Range Pct): | 49.1 | 70.8 | 0.0 |
| – COT Index Reading (3 Year Range): | Bearish | Bullish | Bearish-Extreme |
| NET POSITION MOVEMENT INDEX: | |||
| – 6-Week Change in Strength Index: | -0.3 | 6.6 | -15.1 |
US Treasury Bonds Futures:
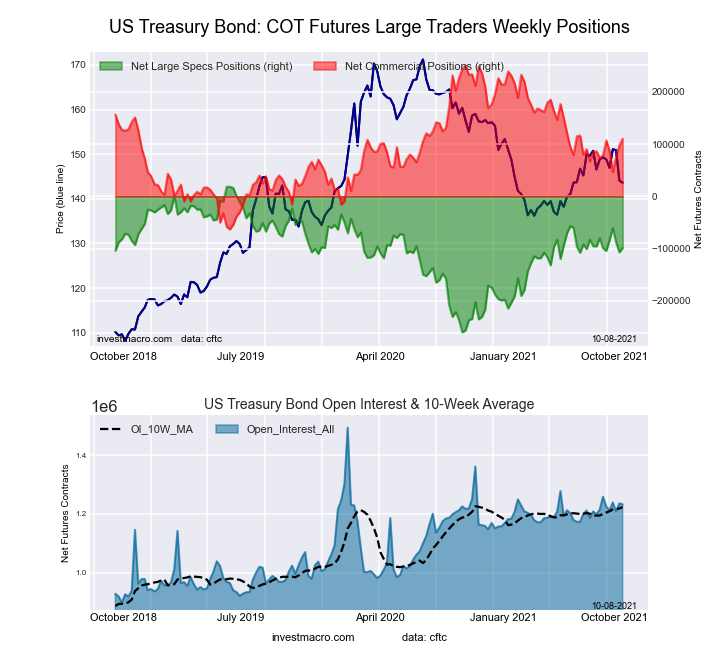 The US Treasury Bonds large speculator standing this week reached a net position of -98,649 contracts in the data reported through Tuesday. This was a weekly lift of 8,291 contracts from the previous week which had a total of -106,940 net contracts.
This week’s current strength score (the trader positioning range over the past three years, measured from 0 to 100) shows the speculators are currently Bullish with a score of 58.0 percent. The commercials are Bullish with a score of 55.2 percent and the small traders (not shown in chart) are Bearish with a score of 43.6 percent.
| US Treasury Bonds Statistics | SPECULATORS | COMMERCIALS | SMALL TRADERS |
| – Percent of Open Interest Longs: | 8.7 | 75.2 | 13.9 |
| – Percent of Open Interest Shorts: | 16.7 | 66.3 | 14.8 |
| – Net Position: | -98,649 | 109,987 | -11,338 |
| – Gross Longs: | 107,189 | 927,032 | 171,374 |
| – Gross Shorts: | 205,838 | 817,045 | 182,712 |
| – Long to Short Ratio: | 0.5 to 1 | 1.1 to 1 | 0.9 to 1 |
| NET POSITION TREND: | |||
| – COT Index Score (3 Year Range Pct): | 58.0 | 55.2 | 43.6 |
| – COT Index Reading (3 Year Range): | Bullish | Bullish | Bearish |
| NET POSITION MOVEMENT INDEX: | |||
| – 6-Week Change in Strength Index: | 0.2 | 10.0 | -25.5 |
Ultra US Treasury Bonds Futures:
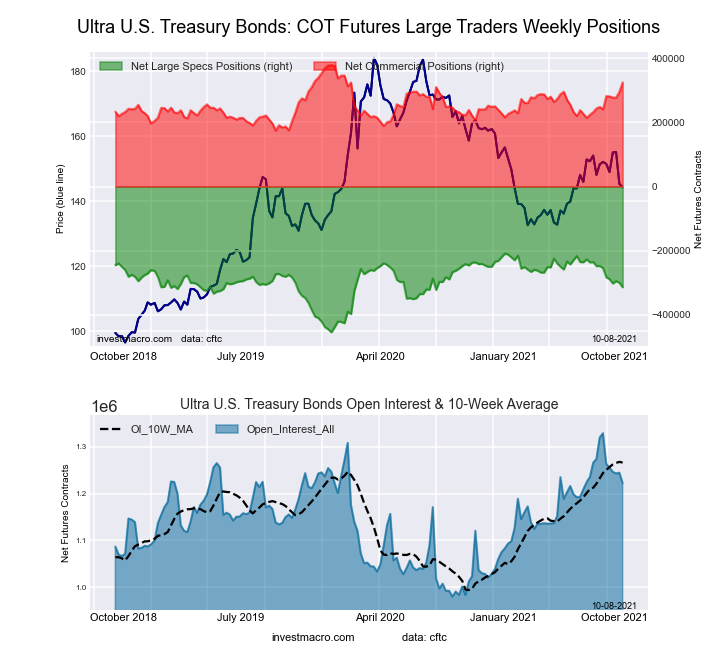 The Ultra US Treasury Bonds large speculator standing this week reached a net position of -313,634 contracts in the data reported through Tuesday. This was a weekly decline of -13,841 contracts from the previous week which had a total of -299,793 net contracts.
This week’s current strength score (the trader positioning range over the past three years, measured from 0 to 100) shows the speculators are currently Bullish with a score of 57.3 percent. The commercials are Bullish with a score of 73.6 percent and the small traders (not shown in chart) are Bearish with a score of 20.7 percent.
| Ultra US Treasury Bonds Statistics | SPECULATORS | COMMERCIALS | SMALL TRADERS |
| – Percent of Open Interest Longs: | 4.6 | 82.5 | 12.0 |
| – Percent of Open Interest Shorts: | 30.2 | 56.0 | 12.9 |
| – Net Position: | -313,634 | 324,157 | -10,523 |
| – Gross Longs: | 55,695 | 1,008,685 | 146,619 |
| – Gross Shorts: | 369,329 | 684,528 | 157,142 |
| – Long to Short Ratio: | 0.2 to 1 | 1.5 to 1 | 0.9 to 1 |
| NET POSITION TREND: | |||
| – COT Index Score (3 Year Range Pct): | 57.3 | 73.6 | 20.7 |
| – COT Index Reading (3 Year Range): | Bullish | Bullish | Bearish |
| NET POSITION MOVEMENT INDEX: | |||
| – 6-Week Change in Strength Index: | -24.3 | 41.0 | -17.1 |
Article By InvestMacro.com – Receive our weekly COT Reports by Email
*COT Report: The COT data, released weekly to the public each Friday, is updated through the most recent Tuesday (data is 3 days old) and shows a quick view of how large speculators or non-commercials (for-profit traders) were positioned in the futures markets.
The CFTC categorizes trader positions according to commercial hedgers (traders who use futures contracts for hedging as part of the business), non-commercials (large traders who speculate to realize trading profits) and nonreportable traders (usually small traders/speculators).
Find CFTC criteria here: (http://www.cftc.gov/MarketReports/CommitmentsofTraders/ExplanatoryNotes/index.htm).

- COT Metals Charts: Weekly Speculator Bets led by Copper & Steel Jul 18, 2026
- COT Bonds Charts: Weekly Speculator Bets led by 2-Year, SOFR 3M & 5-Year Bonds Jul 18, 2026
- COT Energy Charts: Weekly Speculator Bets led by Brent Oil & Heating Oil Jul 18, 2026
- COT Soft Commodities Charts: Weekly Speculator Bets led by Wheat, Corn & Soybean Meal Jul 18, 2026
- The Bank of Canada kept its interest rate unchanged. Platinum prices reached a three‑week high Jul 16, 2026
- Stock indices rose after the release of US inflation data. China’s GDP slowed sharply Jul 15, 2026
- GBP/USD Awaits Political News: What Will Happen Next Jul 15, 2026
- USD/JPY Holds at Highs: Pressure Lingers on Yen Jul 14, 2026
- Oil prices jumped 4% amid a new wave of escalation between the US and Iran Jul 13, 2026
- EUR/USD: US Inflation Will Determine Everything Jul 13, 2026