
By InvestMacro.com COT Home | Data Tables | Data Downloads | Newsletter
Here are the latest charts and statistics for the Commitment of Traders (COT) data published by the Commodities Futures Trading Commission (CFTC).
The latest COT data is updated through Tuesday October 12th 2021 and shows a quick view of how large traders (for-profit speculators and commercial entities) were positioned in the futures markets.
Highlighting this week’s data is the Heating Oil bullish speculator positions which rose to the highest level in the past 156 weeks at a total of 39,137 contracts. This is the most bullish level dating back to October 16th of 2018 when the net position totaled 43,385 contracts. Heating Oil speculative contracts have increased for four straight weeks and for ten out of the last thirteen weeks. The speculator strength score is currently at 100 percent showing that speculator sentiment is at a three-year high.
| Oct-12-2021 | OI | OI-Index | Spec-Net | Spec-Index | Com-Net | COM-Index | Smalls-Net | Smalls-Index |
|---|---|---|---|---|---|---|---|---|
| WTI Crude | 2,231,227 | 48 | 404,776 | 41 | -453,684 | 46 | 48,908 | 84 |
| Gold | 484,382 | 21 | 185,539 | 54 | -207,614 | 46 | 22,075 | 33 |
| Silver | 139,403 | 6 | 17,987 | 40 | -30,292 | 69 | 12,305 | 11 |
| Copper | 194,817 | 23 | 22,481 | 59 | -25,867 | 42 | 3,386 | 45 |
| Palladium | 9,296 | 13 | -2,496 | 4 | 2,625 | 95 | -129 | 37 |
| Platinum | 59,344 | 21 | 10,919 | 18 | -16,756 | 85 | 5,837 | 43 |
| Natural Gas | 1,314,022 | 40 | -130,902 | 39 | 91,201 | 60 | 39,701 | 79 |
| Brent | 205,521 | 44 | -34,924 | 57 | 29,563 | 37 | 5,361 | 82 |
| Heating Oil | 429,908 | 68 | 39,137 | 100 | -65,644 | 1 | 26,507 | 90 |
| Soybeans | 759,101 | 35 | 41,990 | 41 | -9,665 | 64 | -32,325 | 18 |
| Corn | 1,400,377 | 4 | 279,288 | 66 | -223,336 | 40 | -55,952 | 11 |
| Coffee | 305,141 | 62 | 69,085 | 99 | -73,808 | 2 | 4,723 | 21 |
| Sugar | 891,672 | 25 | 246,188 | 87 | -294,674 | 12 | 48,486 | 68 |
| Wheat | 385,204 | 23 | -4,534 | 43 | 12,969 | 53 | -8,435 | 61 |
WTI Crude Oil Futures:
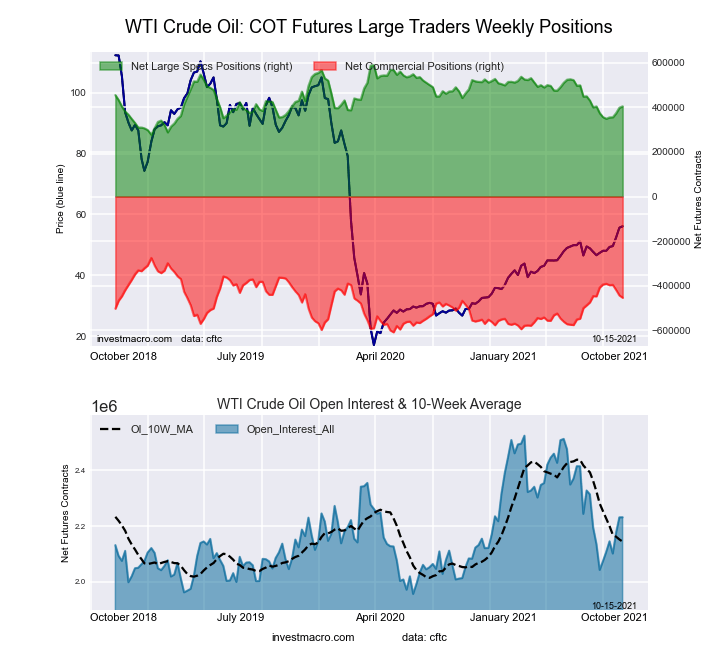 The WTI Crude Oil Futures large speculator standing this week came in at a net position of 404,776 contracts in the data reported through Tuesday. This was a weekly advance of 6,469 contracts from the previous week which had a total of 398,307 net contracts.
Free Reports:
 Sign Up for Our Stock Market Newsletter – Get updated on News, Charts & Rankings of Public Companies when you join our Stocks Newsletter
 Get our Weekly Commitment of Traders Reports - See where the biggest traders (Hedge Funds and Commercial Hedgers) are positioned in the futures markets on a weekly basis.
This week’s current strength score (the trader positioning range over the past three years, measured from 0 to 100) shows the speculators are currently Bearish with a score of 40.9 percent. The commercials are Bearish with a score of 46.5 percent and the small traders (not shown in chart) are Bullish-Extreme with a score of 83.9 percent.
| WTI Crude Oil Futures Statistics | SPECULATORS | COMMERCIALS | SMALL TRADERS |
| – Percent of Open Interest Longs: | 25.3 | 32.3 | 4.7 |
| – Percent of Open Interest Shorts: | 7.1 | 52.7 | 2.5 |
| – Net Position: | 404,776 | -453,684 | 48,908 |
| – Gross Longs: | 564,001 | 721,614 | 105,276 |
| – Gross Shorts: | 159,225 | 1,175,298 | 56,368 |
| – Long to Short Ratio: | 3.5 to 1 | 0.6 to 1 | 1.9 to 1 |
| NET POSITION TREND: | |||
| – COT Index Score (3 Year Range Pct): | 40.9 | 46.5 | 83.9 |
| – COT Index Reading (3 Year Range): | Bearish | Bearish | Bullish-Extreme |
| NET POSITION MOVEMENT INDEX: | |||
| – 6-Week Change in Strength Index: | 15.5 | -17.8 | 15.7 |
Brent Crude Oil Futures:
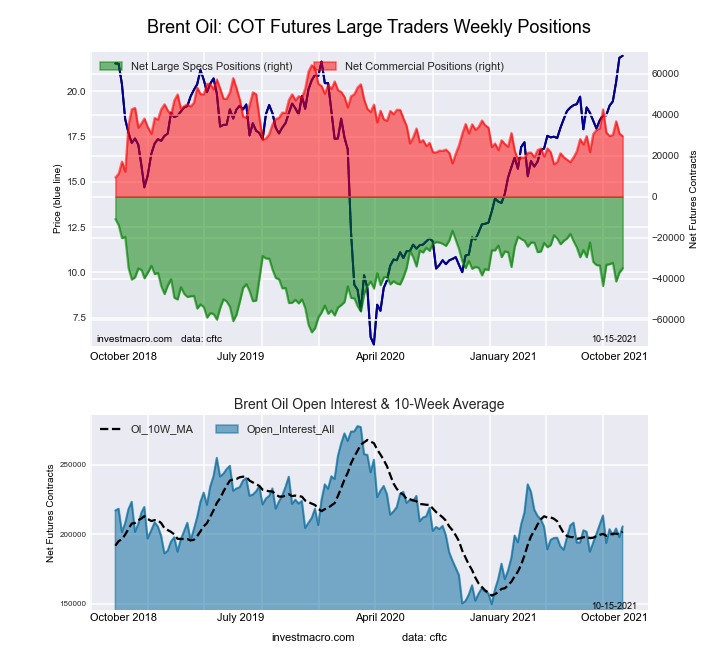 The Brent Crude Oil Futures large speculator standing this week came in at a net position of -34,924 contracts in the data reported through Tuesday. This was a weekly rise of 2,097 contracts from the previous week which had a total of -37,021 net contracts.
This week’s current strength score (the trader positioning range over the past three years, measured from 0 to 100) shows the speculators are currently Bullish with a score of 56.6 percent. The commercials are Bearish with a score of 36.8 percent and the small traders (not shown in chart) are Bullish-Extreme with a score of 82.4 percent.
| Brent Crude Oil Futures Statistics | SPECULATORS | COMMERCIALS | SMALL TRADERS |
| – Percent of Open Interest Longs: | 15.9 | 49.6 | 4.9 |
| – Percent of Open Interest Shorts: | 32.9 | 35.2 | 2.3 |
| – Net Position: | -34,924 | 29,563 | 5,361 |
| – Gross Longs: | 32,761 | 101,894 | 10,063 |
| – Gross Shorts: | 67,685 | 72,331 | 4,702 |
| – Long to Short Ratio: | 0.5 to 1 | 1.4 to 1 | 2.1 to 1 |
| NET POSITION TREND: | |||
| – COT Index Score (3 Year Range Pct): | 56.6 | 36.8 | 82.4 |
| – COT Index Reading (3 Year Range): | Bullish | Bearish | Bullish-Extreme |
| NET POSITION MOVEMENT INDEX: | |||
| – 6-Week Change in Strength Index: | 15.6 | -23.8 | 38.5 |
Natural Gas Futures:
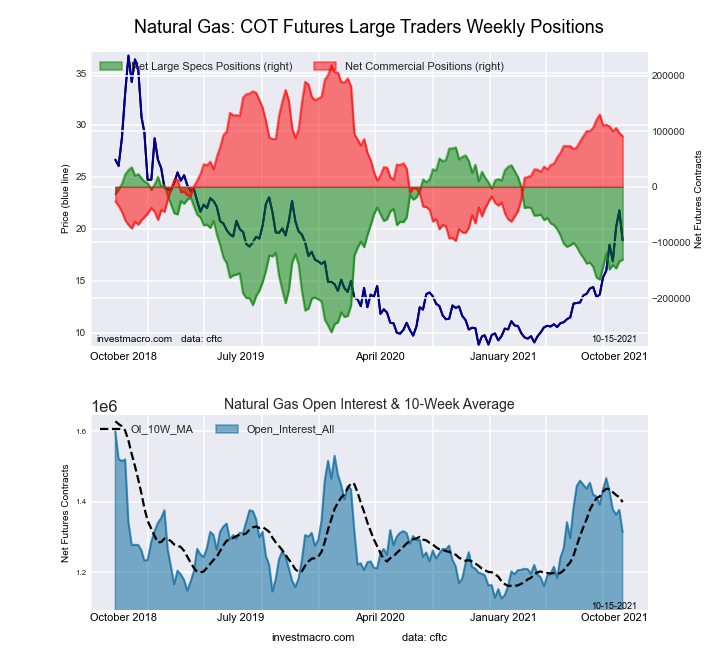 The Natural Gas Futures large speculator standing this week came in at a net position of -130,902 contracts in the data reported through Tuesday. This was a weekly boost of 2,806 contracts from the previous week which had a total of -133,708 net contracts.
This week’s current strength score (the trader positioning range over the past three years, measured from 0 to 100) shows the speculators are currently Bearish with a score of 39.3 percent. The commercials are Bullish with a score of 59.6 percent and the small traders (not shown in chart) are Bullish with a score of 79.5 percent.
| Natural Gas Futures Statistics | SPECULATORS | COMMERCIALS | SMALL TRADERS |
| – Percent of Open Interest Longs: | 20.7 | 44.3 | 5.0 |
| – Percent of Open Interest Shorts: | 30.7 | 37.4 | 2.0 |
| – Net Position: | -130,902 | 91,201 | 39,701 |
| – Gross Longs: | 272,106 | 582,327 | 65,639 |
| – Gross Shorts: | 403,008 | 491,126 | 25,938 |
| – Long to Short Ratio: | 0.7 to 1 | 1.2 to 1 | 2.5 to 1 |
| NET POSITION TREND: | |||
| – COT Index Score (3 Year Range Pct): | 39.3 | 59.6 | 79.5 |
| – COT Index Reading (3 Year Range): | Bearish | Bullish | Bullish |
| NET POSITION MOVEMENT INDEX: | |||
| – 6-Week Change in Strength Index: | 4.1 | -6.0 | 13.4 |
Gasoline Blendstock Futures:
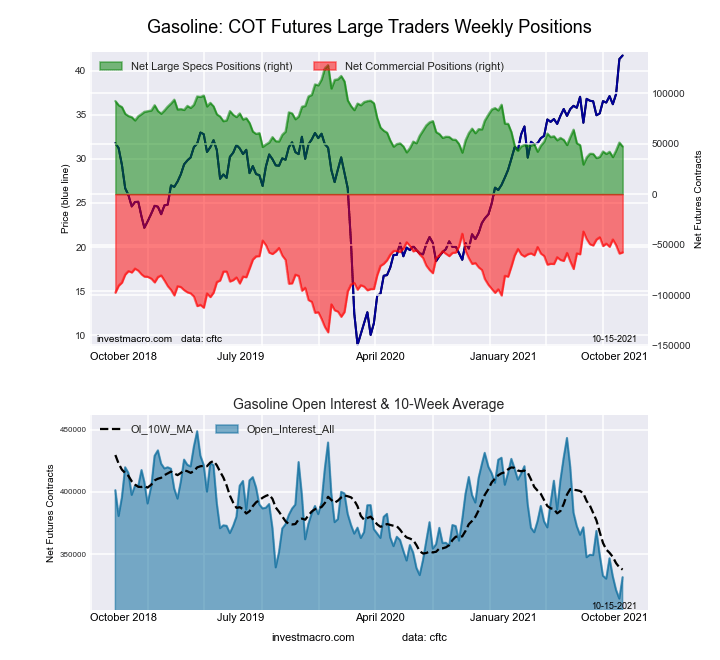 The Gasoline Blendstock Futures large speculator standing this week came in at a net position of 47,193 contracts in the data reported through Tuesday. This was a weekly fall of -3,859 contracts from the previous week which had a total of 51,052 net contracts.
This week’s current strength score (the trader positioning range over the past three years, measured from 0 to 100) shows the speculators are currently Bearish-Extreme with a score of 18.1 percent. The commercials are Bullish with a score of 79.3 percent and the small traders (not shown in chart) are Bullish with a score of 74.7 percent.
| Nasdaq Mini Futures Statistics | SPECULATORS | COMMERCIALS | SMALL TRADERS |
| – Percent of Open Interest Longs: | 28.7 | 45.7 | 7.6 |
| – Percent of Open Interest Shorts: | 14.5 | 63.1 | 4.4 |
| – Net Position: | 47,193 | -57,753 | 10,560 |
| – Gross Longs: | 95,137 | 151,406 | 25,077 |
| – Gross Shorts: | 47,944 | 209,159 | 14,517 |
| – Long to Short Ratio: | 2.0 to 1 | 0.7 to 1 | 1.7 to 1 |
| NET POSITION TREND: | |||
| – COT Index Score (3 Year Range Pct): | 18.1 | 79.3 | 74.7 |
| – COT Index Reading (3 Year Range): | Bearish-Extreme | Bullish | Bullish |
| NET POSITION MOVEMENT INDEX: | |||
| – 6-Week Change in Strength Index: | 5.1 | -6.4 | 8.2 |
#2 Heating Oil NY-Harbor Futures:
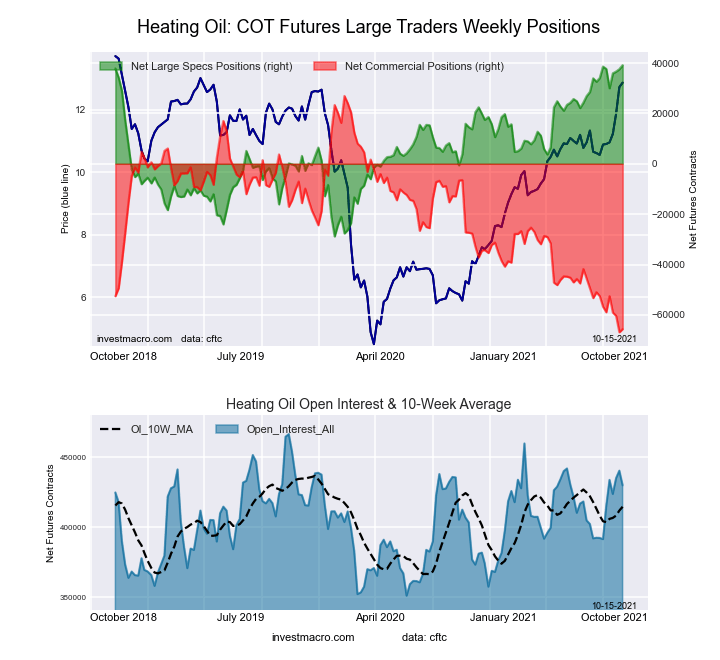 The #2 Heating Oil NY-Harbor Futures large speculator standing this week came in at a net position of 39,137 contracts in the cot data reported through Tuesday. This was a weekly gain of 1,589 contracts from the previous week which had a total of 37,548 net contracts.
This week’s current strength score (the trader positioning range over the past three years, measured from 0 to 100) shows the speculators are currently Bullish-Extreme with a score of 100.0 percent. The commercials are Bearish-Extreme with a score of 1.3 percent and the small traders (not shown in chart) are Bullish-Extreme with a score of 90.2 percent.
| Heating Oil Futures Statistics | SPECULATORS | COMMERCIALS | SMALL TRADERS |
| – Percent of Open Interest Longs: | 16.9 | 49.7 | 11.6 |
| – Percent of Open Interest Shorts: | 7.8 | 65.0 | 5.4 |
| – Net Position: | 39,137 | -65,644 | 26,507 |
| – Gross Longs: | 72,833 | 213,808 | 49,877 |
| – Gross Shorts: | 33,696 | 279,452 | 23,370 |
| – Long to Short Ratio: | 2.2 to 1 | 0.8 to 1 | 2.1 to 1 |
| NET POSITION TREND: | |||
| – COT Index Score (3 Year Range Pct): | 100.0 | 1.3 | 90.2 |
| – COT Index Reading (3 Year Range): | Bullish-Extreme | Bearish-Extreme | Bullish-Extreme |
| NET POSITION MOVEMENT INDEX: | |||
| – 6-Week Change in Strength Index: | 0.8 | -9.5 | 29.1 |
Bloomberg Commodity Index Futures:
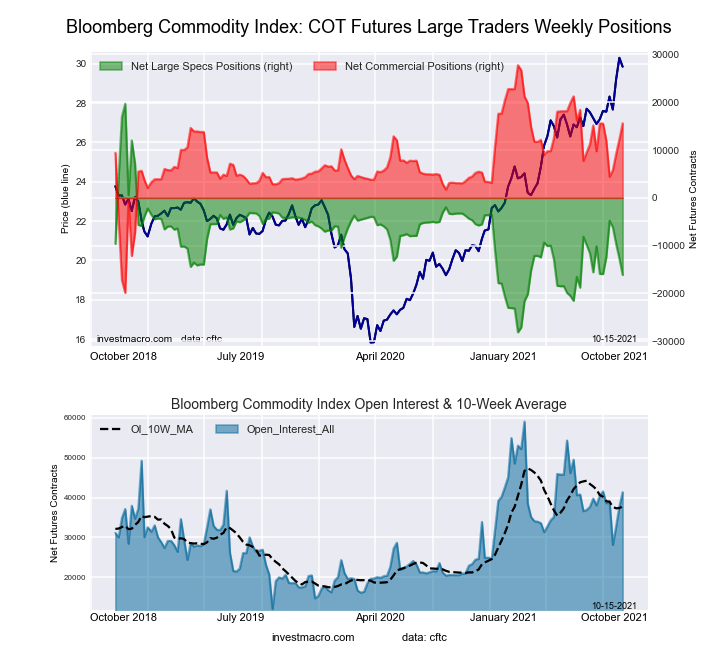 The Bloomberg Commodity Index Futures large speculator standing this week came in at a net position of -16,117 contracts in the data reported through Tuesday. This was a weekly reduction of -3,443 contracts from the previous week which had a total of -12,674 net contracts.
This week’s current strength score (the trader positioning range over the past three years, measured from 0 to 100) shows the speculators are currently Bearish with a score of 25.1 percent. The commercials are Bullish with a score of 74.5 percent and the small traders (not shown in chart) are Bearish with a score of 47.3 percent.
| Bloomberg Index Futures Statistics | SPECULATORS | COMMERCIALS | SMALL TRADERS |
| – Percent of Open Interest Longs: | 51.2 | 42.6 | 1.5 |
| – Percent of Open Interest Shorts: | 90.2 | 4.9 | 0.2 |
| – Net Position: | -16,117 | 15,593 | 524 |
| – Gross Longs: | 21,178 | 17,609 | 621 |
| – Gross Shorts: | 37,295 | 2,016 | 97 |
| – Long to Short Ratio: | 0.6 to 1 | 8.7 to 1 | 6.4 to 1 |
| NET POSITION TREND: | |||
| – COT Index Score (3 Year Range Pct): | 25.1 | 74.5 | 47.3 |
| – COT Index Reading (3 Year Range): | Bearish | Bullish | Bearish |
| NET POSITION MOVEMENT INDEX: | |||
| – 6-Week Change in Strength Index: | -0.4 | 0.1 | 7.1 |
Article By InvestMacro.com – Receive our weekly COT Reports by Email
*COT Report: The COT data, released weekly to the public each Friday, is updated through the most recent Tuesday (data is 3 days old) and shows a quick view of how large speculators or non-commercials (for-profit traders) were positioned in the futures markets.
The CFTC categorizes trader positions according to commercial hedgers (traders who use futures contracts for hedging as part of the business), non-commercials (large traders who speculate to realize trading profits) and nonreportable traders (usually small traders/speculators).
Find CFTC criteria here: (http://www.cftc.gov/MarketReports/CommitmentsofTraders/ExplanatoryNotes/index.htm).

- COT Metals Charts: Weekly Speculator Bets led by Copper & Steel Jul 18, 2026
- COT Bonds Charts: Weekly Speculator Bets led by 2-Year, SOFR 3M & 5-Year Bonds Jul 18, 2026
- COT Energy Charts: Weekly Speculator Bets led by Brent Oil & Heating Oil Jul 18, 2026
- COT Soft Commodities Charts: Weekly Speculator Bets led by Wheat, Corn & Soybean Meal Jul 18, 2026
- The Bank of Canada kept its interest rate unchanged. Platinum prices reached a three‑week high Jul 16, 2026
- Stock indices rose after the release of US inflation data. China’s GDP slowed sharply Jul 15, 2026
- GBP/USD Awaits Political News: What Will Happen Next Jul 15, 2026
- USD/JPY Holds at Highs: Pressure Lingers on Yen Jul 14, 2026
- Oil prices jumped 4% amid a new wave of escalation between the US and Iran Jul 13, 2026
- EUR/USD: US Inflation Will Determine Everything Jul 13, 2026