
By InvestMacro COT Home | Data Tables | Data Downloads | COT Newsletter
Here are the latest charts and statistics for the Commitment of Traders (COT) data published by the Commodities Futures Trading Commission (CFTC).
The latest COT data is updated through Tuesday October 05 2021 and shows a quick view of how large traders (for-profit speculators and commercial entities) were positioned in the futures markets.
| Oct-05-2021 | OI | OI-Index | Spec-Net | Spec-Index | Com-Net | COM-Index | Smalls-Net | Smalls-Index |
|---|---|---|---|---|---|---|---|---|
| S&P500-Mini | 2,437,353 | 1 | 72,784 | 66 | -96,903 | 49 | 24,119 | 31 |
| Nikkei 225 | 22,460 | 23 | -3,944 | 40 | 2,255 | 61 | 1,689 | 48 |
| Nasdaq-Mini | 225,151 | 28 | -2,653 | 74 | 5,451 | 30 | -2,798 | 38 |
| DowJones-Mini | 96,240 | 65 | -6,175 | 28 | 1,042 | 64 | 5,133 | 66 |
| VIX | 307,664 | 29 | -69,588 | 57 | 75,898 | 44 | -6,310 | 32 |
| Nikkei 225 Yen | 56,302 | 38 | 4,573 | 34 | 19,841 | 94 | -24,414 | 31 |
VIX Volatility Futures:
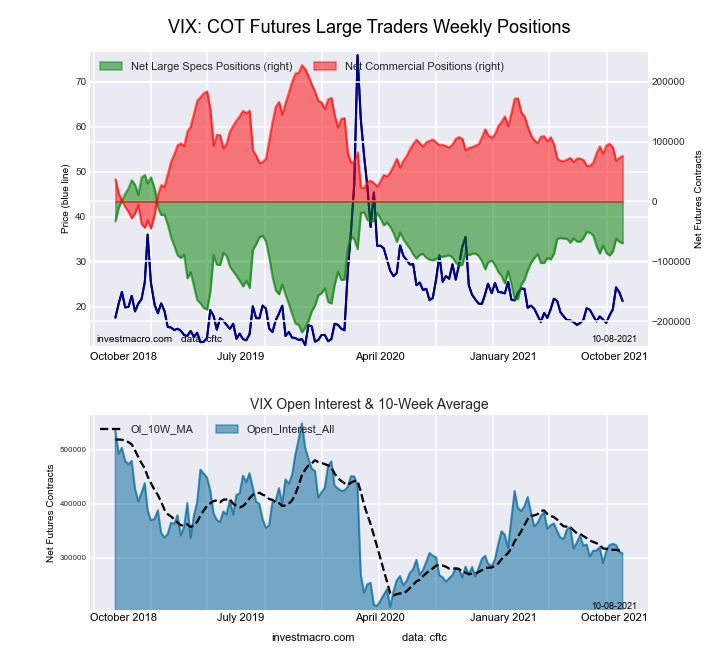 The VIX Volatility large speculator standing this week recorded a net position of -69,588 contracts in the data reported through Tuesday. This was a weekly decline of -2,229 contracts from the previous week which had a total of -67,359 net contracts.
This week’s current strength score (the trader positioning range over the past three years, measured from 0 to 100) shows the speculators are currently Bullish with a score of 56.7 percent. The commercials are Bearish with a score of 44.4 percent and the small traders (not shown in chart) are Bearish with a score of 32.5 percent.
Free Reports:
 Get our Weekly Commitment of Traders Reports - See where the biggest traders (Hedge Funds and Commercial Hedgers) are positioned in the futures markets on a weekly basis.
 Download Our Metatrader 4 Indicators – Put Our Free MetaTrader 4 Custom Indicators on your charts when you join our Weekly Newsletter
| VIX Volatility Futures Statistics | SPECULATORS | COMMERCIALS | SMALL TRADERS |
| – Percent of Open Interest Longs: | 15.5 | 53.2 | 7.3 |
| – Percent of Open Interest Shorts: | 38.1 | 28.5 | 9.4 |
| – Net Position: | -69,588 | 75,898 | -6,310 |
| – Gross Longs: | 47,549 | 163,652 | 22,530 |
| – Gross Shorts: | 117,137 | 87,754 | 28,840 |
| – Long to Short Ratio: | 0.4 to 1 | 1.9 to 1 | 0.8 to 1 |
| NET POSITION TREND: | |||
| – COT Index Score (3 Year Range Pct): | 56.7 | 44.4 | 32.5 |
| – COT Index Reading (3 Year Range): | Bullish | Bearish | Bearish |
| NET POSITION MOVEMENT INDEX: | |||
| – 6-Week Change in Strength Index: | 1.4 | -1.4 | 1.0 |
S&P500 Mini Futures:
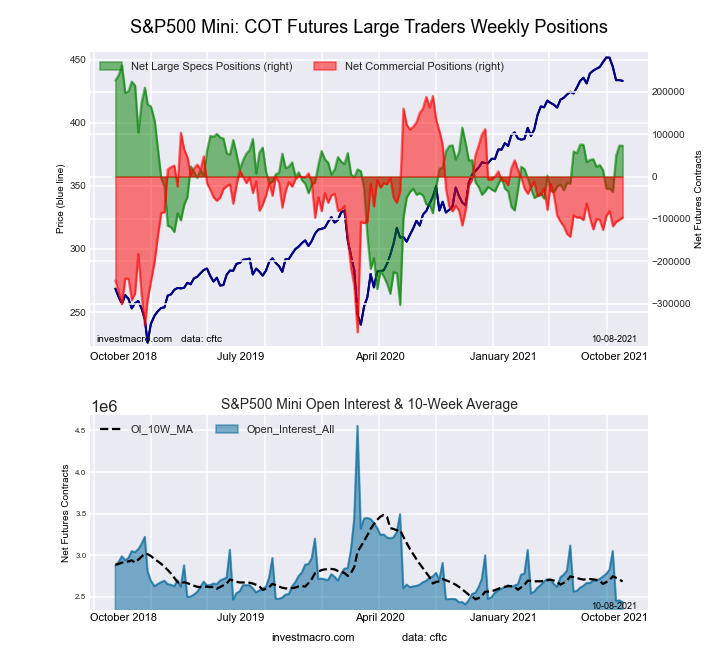 The S&P500 Mini large speculator standing this week recorded a net position of 72,784 contracts in the data reported through Tuesday. This was a weekly reduction of -373 contracts from the previous week which had a total of 73,157 net contracts.
This week’s current strength score (the trader positioning range over the past three years, measured from 0 to 100) shows the speculators are currently Bullish with a score of 66.4 percent. The commercials are Bearish with a score of 48.5 percent and the small traders (not shown in chart) are Bearish with a score of 31.4 percent.
| S&P500 Mini Futures Statistics | SPECULATORS | COMMERCIALS | SMALL TRADERS |
| – Percent of Open Interest Longs: | 15.2 | 71.6 | 10.8 |
| – Percent of Open Interest Shorts: | 12.2 | 75.6 | 9.8 |
| – Net Position: | 72,784 | -96,903 | 24,119 |
| – Gross Longs: | 369,731 | 1,744,827 | 263,418 |
| – Gross Shorts: | 296,947 | 1,841,730 | 239,299 |
| – Long to Short Ratio: | 1.2 to 1 | 0.9 to 1 | 1.1 to 1 |
| NET POSITION TREND: | |||
| – COT Index Score (3 Year Range Pct): | 66.4 | 48.5 | 31.4 |
| – COT Index Reading (3 Year Range): | Bullish | Bearish | Bearish |
| NET POSITION MOVEMENT INDEX: | |||
| – 6-Week Change in Strength Index: | 10.2 | 5.2 | -18.3 |
Dow Jones Mini Futures:
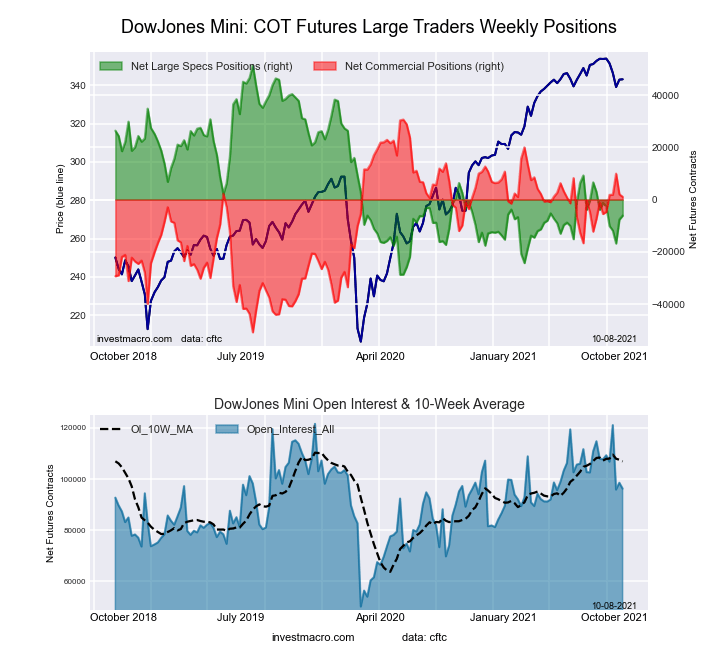 The Dow Jones Mini large speculator standing this week recorded a net position of -6,175 contracts in the data reported through Tuesday. This was a weekly lift of 1,506 contracts from the previous week which had a total of -7,681 net contracts.
This week’s current strength score (the trader positioning range over the past three years, measured from 0 to 100) shows the speculators are currently Bearish with a score of 28.2 percent. The commercials are Bullish with a score of 63.7 percent and the small traders (not shown in chart) are Bullish with a score of 65.9 percent.
| Dow Jones Mini Futures Statistics | SPECULATORS | COMMERCIALS | SMALL TRADERS |
| – Percent of Open Interest Longs: | 30.4 | 49.6 | 18.1 |
| – Percent of Open Interest Shorts: | 36.9 | 48.6 | 12.8 |
| – Net Position: | -6,175 | 1,042 | 5,133 |
| – Gross Longs: | 29,290 | 47,776 | 17,406 |
| – Gross Shorts: | 35,465 | 46,734 | 12,273 |
| – Long to Short Ratio: | 0.8 to 1 | 1.0 to 1 | 1.4 to 1 |
| NET POSITION TREND: | |||
| – COT Index Score (3 Year Range Pct): | 28.2 | 63.7 | 65.9 |
| – COT Index Reading (3 Year Range): | Bearish | Bullish | Bullish |
| NET POSITION MOVEMENT INDEX: | |||
| – 6-Week Change in Strength Index: | -6.0 | 8.1 | -9.5 |
Nasdaq Mini Futures:
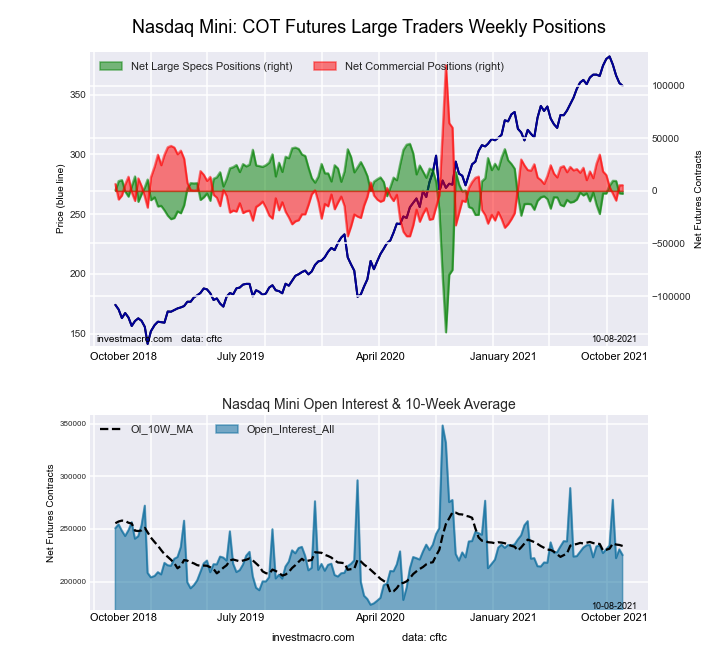 The Nasdaq Mini large speculator standing this week recorded a net position of -2,653 contracts in the data reported through Tuesday. This was a weekly reduction of -373 contracts from the previous week which had a total of -2,280 net contracts.
This week’s current strength score (the trader positioning range over the past three years, measured from 0 to 100) shows the speculators are currently Bullish with a score of 73.5 percent. The commercials are Bearish with a score of 29.9 percent and the small traders (not shown in chart) are Bearish with a score of 37.7 percent.
| Nasdaq Mini Futures Statistics | SPECULATORS | COMMERCIALS | SMALL TRADERS |
| – Percent of Open Interest Longs: | 26.1 | 54.3 | 17.4 |
| – Percent of Open Interest Shorts: | 27.3 | 51.8 | 18.6 |
| – Net Position: | -2,653 | 5,451 | -2,798 |
| – Gross Longs: | 58,770 | 122,150 | 39,085 |
| – Gross Shorts: | 61,423 | 116,699 | 41,883 |
| – Long to Short Ratio: | 1.0 to 1 | 1.0 to 1 | 0.9 to 1 |
| NET POSITION TREND: | |||
| – COT Index Score (3 Year Range Pct): | 73.5 | 29.9 | 37.7 |
| – COT Index Reading (3 Year Range): | Bullish | Bearish | Bearish |
| NET POSITION MOVEMENT INDEX: | |||
| – 6-Week Change in Strength Index: | -0.1 | -8.0 | 29.6 |
Russell 2000 Mini Futures:
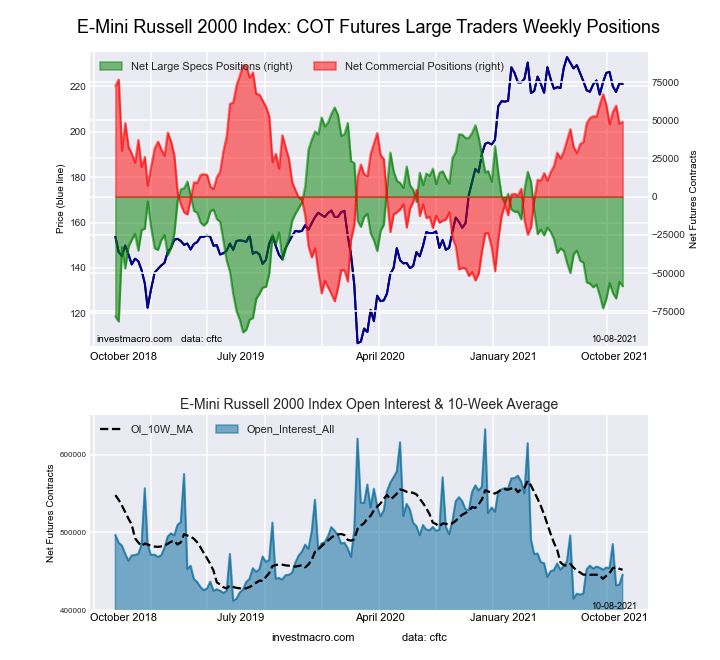 The Russell 2000 Mini large speculator standing this week recorded a net position of -58,613 contracts in the data reported through Tuesday. This was a weekly reduction of -2,970 contracts from the previous week which had a total of -55,643 net contracts.
This week’s current strength score (the trader positioning range over the past three years, measured from 0 to 100) shows the speculators are currently Bearish with a score of 20.5 percent. The commercials are Bullish with a score of 76.1 percent and the small traders (not shown in chart) are Bullish with a score of 60.0 percent.
| Russell 2000 Mini Futures Statistics | SPECULATORS | COMMERCIALS | SMALL TRADERS |
| – Percent of Open Interest Longs: | 13.2 | 79.0 | 6.5 |
| – Percent of Open Interest Shorts: | 26.3 | 68.0 | 4.4 |
| – Net Position: | -58,613 | 49,078 | 9,535 |
| – Gross Longs: | 58,691 | 351,912 | 29,146 |
| – Gross Shorts: | 117,304 | 302,834 | 19,611 |
| – Long to Short Ratio: | 0.5 to 1 | 1.2 to 1 | 1.5 to 1 |
| NET POSITION TREND: | |||
| – COT Index Score (3 Year Range Pct): | 20.5 | 76.1 | 60.0 |
| – COT Index Reading (3 Year Range): | Bearish | Bullish | Bullish |
| NET POSITION MOVEMENT INDEX: | |||
| – 6-Week Change in Strength Index: | 9.7 | -11.6 | 10.3 |
Nikkei Stock Average (USD) Futures:
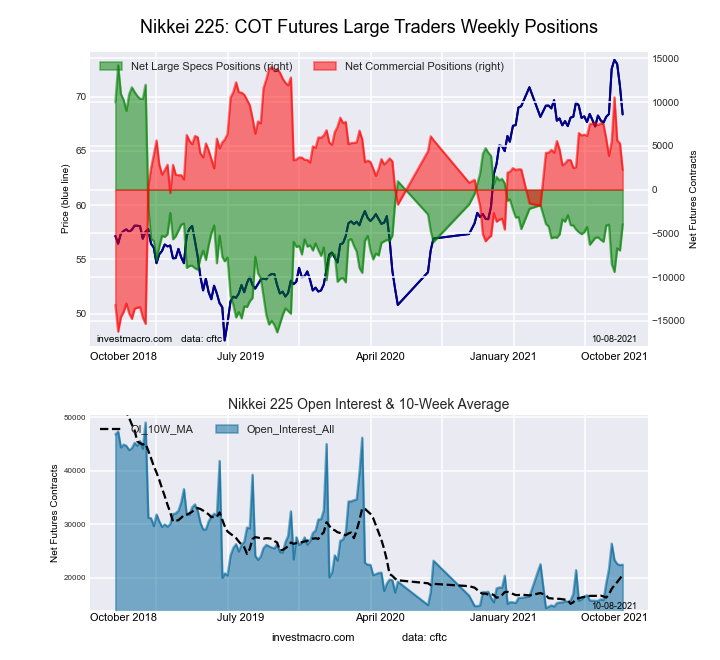 The Nikkei Stock Average (USD) large speculator standing this week recorded a net position of -3,944 contracts in the data reported through Tuesday. This was a weekly rise of 3,004 contracts from the previous week which had a total of -6,948 net contracts.
This week’s current strength score (the trader positioning range over the past three years, measured from 0 to 100) shows the speculators are currently Bearish with a score of 40.5 percent. The commercials are Bullish with a score of 61.1 percent and the small traders (not shown in chart) are Bearish with a score of 48.4 percent.
| Nikkei Stock Average Futures Statistics | SPECULATORS | COMMERCIALS | SMALL TRADERS |
| – Percent of Open Interest Longs: | 9.6 | 71.2 | 19.1 |
| – Percent of Open Interest Shorts: | 27.2 | 61.1 | 11.6 |
| – Net Position: | -3,944 | 2,255 | 1,689 |
| – Gross Longs: | 2,166 | 15,988 | 4,296 |
| – Gross Shorts: | 6,110 | 13,733 | 2,607 |
| – Long to Short Ratio: | 0.4 to 1 | 1.2 to 1 | 1.6 to 1 |
| NET POSITION TREND: | |||
| – COT Index Score (3 Year Range Pct): | 40.5 | 61.1 | 48.4 |
| – COT Index Reading (3 Year Range): | Bearish | Bullish | Bearish |
| NET POSITION MOVEMENT INDEX: | |||
| – 6-Week Change in Strength Index: | 0.5 | -11.7 | 43.5 |
MSCI EAFE Mini Futures:
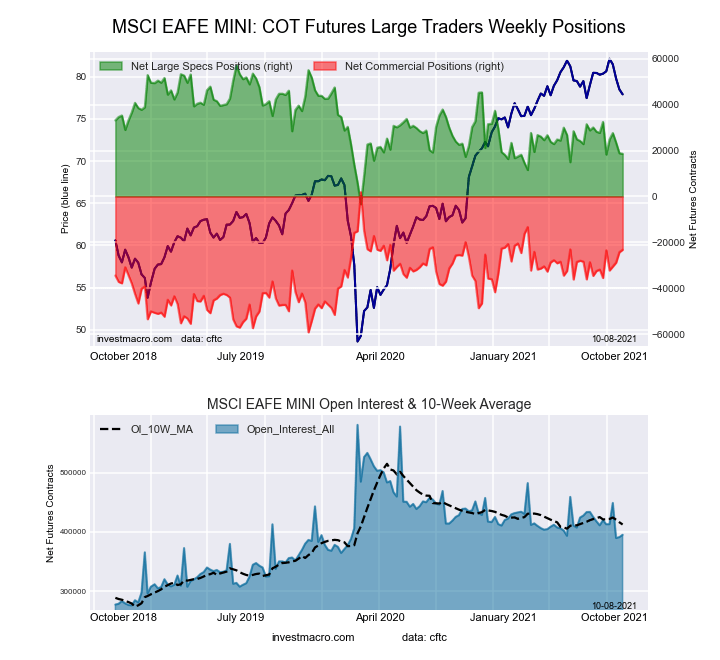 The MSCI EAFE Mini large speculator standing this week recorded a net position of 18,591 contracts in the data reported through Tuesday. This was a weekly decrease of -243 contracts from the previous week which had a total of 18,834 net contracts.
This week’s current strength score (the trader positioning range over the past three years, measured from 0 to 100) shows the speculators are currently Bearish with a score of 36.3 percent. The commercials are Bullish with a score of 58.8 percent and the small traders (not shown in chart) are Bullish with a score of 58.2 percent.
| MSCI EAFE Mini Futures Statistics | SPECULATORS | COMMERCIALS | SMALL TRADERS |
| – Percent of Open Interest Longs: | 8.3 | 88.5 | 2.6 |
| – Percent of Open Interest Shorts: | 3.6 | 94.4 | 1.4 |
| – Net Position: | 18,591 | -23,255 | 4,664 |
| – Gross Longs: | 32,645 | 349,626 | 10,285 |
| – Gross Shorts: | 14,054 | 372,881 | 5,621 |
| – Long to Short Ratio: | 2.3 to 1 | 0.9 to 1 | 1.8 to 1 |
| NET POSITION TREND: | |||
| – COT Index Score (3 Year Range Pct): | 36.3 | 58.8 | 58.2 |
| – COT Index Reading (3 Year Range): | Bearish | Bullish | Bullish |
| NET POSITION MOVEMENT INDEX: | |||
| – 6-Week Change in Strength Index: | -22.9 | 20.1 | 14.5 |
Article By InvestMacro.com – Receive our weekly COT Reports by Email
*COT Report: The COT data, released weekly to the public each Friday, is updated through the most recent Tuesday (data is 3 days old) and shows a quick view of how large speculators or non-commercials (for-profit traders) were positioned in the futures markets.
The CFTC categorizes trader positions according to commercial hedgers (traders who use futures contracts for hedging as part of the business), non-commercials (large traders who speculate to realize trading profits) and nonreportable traders (usually small traders/speculators).
Find CFTC criteria here: (http://www.cftc.gov/MarketReports/CommitmentsofTraders/ExplanatoryNotes/index.htm).

- COT Metals Charts: Weekly Speculator Bets led by Copper & Steel Jul 18, 2026
- COT Bonds Charts: Weekly Speculator Bets led by 2-Year, SOFR 3M & 5-Year Bonds Jul 18, 2026
- COT Energy Charts: Weekly Speculator Bets led by Brent Oil & Heating Oil Jul 18, 2026
- COT Soft Commodities Charts: Weekly Speculator Bets led by Wheat, Corn & Soybean Meal Jul 18, 2026
- The Bank of Canada kept its interest rate unchanged. Platinum prices reached a three‑week high Jul 16, 2026
- Stock indices rose after the release of US inflation data. China’s GDP slowed sharply Jul 15, 2026
- GBP/USD Awaits Political News: What Will Happen Next Jul 15, 2026
- USD/JPY Holds at Highs: Pressure Lingers on Yen Jul 14, 2026
- Oil prices jumped 4% amid a new wave of escalation between the US and Iran Jul 13, 2026
- EUR/USD: US Inflation Will Determine Everything Jul 13, 2026