
By InvestMacro COT Home | Data Tables | Data Downloads | COT Newsletter
Here are the latest charts and statistics for the Commitment of Traders (COT) data published by the Commodities Futures Trading Commission (CFTC).
The latest COT data is updated through Tuesday October 5th 2021 and shows a quick view of how large traders (for-profit speculators and commercial entities) were positioned in the futures markets.
Cotton speculative positions continued to draw higher this week with a gain of +5,154 contracts. This is the eleventh rise in the past thirteen weeks to bring the speculator level to over a 3-year high dating back to June 12th of 2018. Cotton prices have been surging as well with prices reaching the highest thresholds since 2011. Needless to say that the Cotton Speculator Strength Index is currently at a 100 percent score again this week (meaning the highest level of bullish speculator positioning over the past three-year range). Joining Cotton with bullish-extreme strength readings this week are Lean Hogs, COFFEE and Sugar among the soft commodities.
| Oct-05-2021 | OI | OI-Index | Spec-Net | Spec-Index | Com-Net | COM-Index | Smalls-Net | Smalls-Index |
|---|---|---|---|---|---|---|---|---|
| WTI Crude | 2,230,794 | 48 | 398,307 | 39 | -443,259 | 50 | 44,952 | 78 |
| Gold | 483,789 | 21 | 182,582 | 53 | -203,702 | 47 | 21,120 | 31 |
| Silver | 139,763 | 7 | 16,379 | 39 | -27,778 | 72 | 11,399 | 6 |
| Copper | 185,655 | 16 | 14,417 | 53 | -18,918 | 46 | 4,501 | 51 |
| Palladium | 9,705 | 14 | -3,230 | 0 | 3,510 | 99 | -280 | 28 |
| Platinum | 62,109 | 25 | 5,515 | 10 | -10,403 | 94 | 4,888 | 30 |
| Natural Gas | 1,376,788 | 50 | -133,708 | 38 | 96,637 | 61 | 37,071 | 73 |
| Brent | 197,795 | 38 | -37,021 | 51 | 30,935 | 42 | 6,086 | 89 |
| Heating Oil | 440,286 | 77 | 37,548 | 92 | -66,885 | 0 | 29,337 | 100 |
| Soybeans | 715,835 | 25 | 51,401 | 43 | -22,592 | 61 | -28,809 | 24 |
| Corn | 1,397,458 | 4 | 297,005 | 68 | -237,593 | 38 | -59,412 | 9 |
| Coffee | 306,363 | 63 | 66,571 | 97 | -71,022 | 4 | 4,451 | 19 |
| Sugar | 888,354 | 28 | 247,375 | 87 | -293,135 | 13 | 45,760 | 64 |
| Wheat | 373,320 | 17 | 7,312 | 53 | 3,695 | 44 | -11,007 | 49 |
CORN Futures:
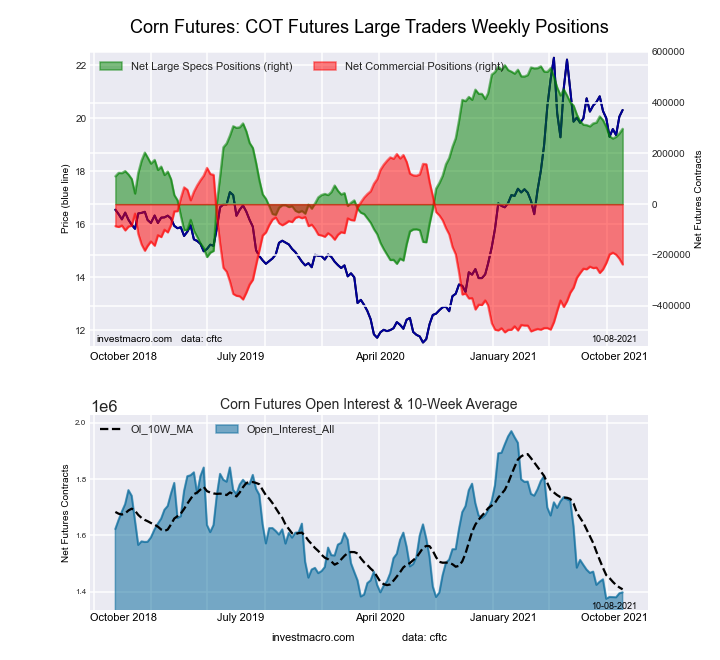 The CORN large speculator standing this week recorded a net position of 297,005 contracts in the data reported through Tuesday. This was a weekly boost of 18,459 contracts from the previous week which had a total of 278,546 net contracts.
Free Reports:
 Download Our Metatrader 4 Indicators – Put Our Free MetaTrader 4 Custom Indicators on your charts when you join our Weekly Newsletter
 Get our Weekly Commitment of Traders Reports - See where the biggest traders (Hedge Funds and Commercial Hedgers) are positioned in the futures markets on a weekly basis.
This week’s current strength score (the trader positioning range over the past three years, measured from 0 to 100) shows the speculators are currently Bullish with a score of 68.0 percent. The commercials are Bearish with a score of 38.1 percent and the small traders (not shown in chart) are Bearish-Extreme with a score of 8.9 percent.
| CORN Futures Statistics | SPECULATORS | COMMERCIALS | SMALL TRADERS |
| – Percent of Open Interest Longs: | 29.4 | 48.0 | 9.0 |
| – Percent of Open Interest Shorts: | 8.1 | 65.0 | 13.3 |
| – Net Position: | 297,005 | -237,593 | -59,412 |
| – Gross Longs: | 410,799 | 670,303 | 126,389 |
| – Gross Shorts: | 113,794 | 907,896 | 185,801 |
| – Long to Short Ratio: | 3.6 to 1 | 0.7 to 1 | 0.7 to 1 |
| NET POSITION TREND: | |||
| – COT Index Score (3 Year Range Pct): | 68.0 | 38.1 | 8.9 |
| – COT Index Reading (3 Year Range): | Bullish | Bearish | Bearish-Extreme |
| NET POSITION MOVEMENT INDEX: | |||
| – 6-Week Change in Strength Index: | -4.3 | 2.7 | 8.5 |
SUGAR Futures:
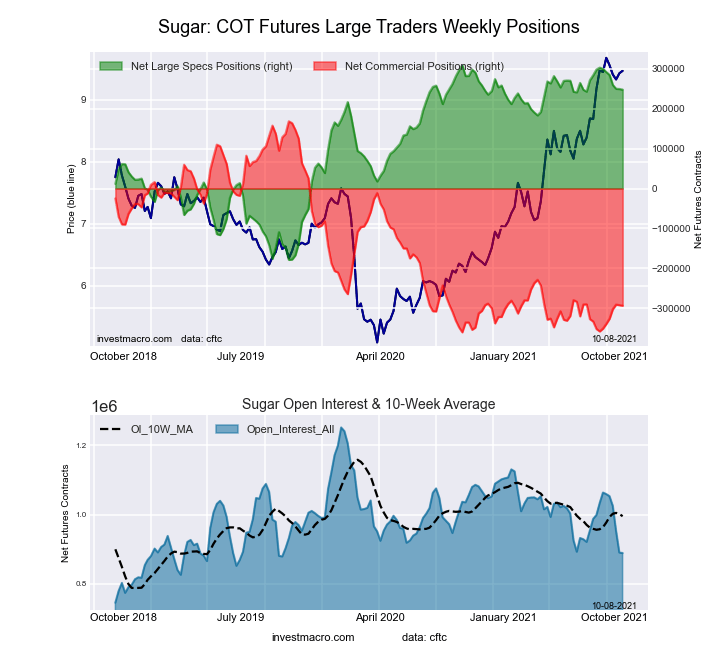 The SUGAR large speculator standing this week recorded a net position of 247,375 contracts in the data reported through Tuesday. This was a weekly fall of -1,540 contracts from the previous week which had a total of 248,915 net contracts.
This week’s current strength score (the trader positioning range over the past three years, measured from 0 to 100) shows the speculators are currently Bullish-Extreme with a score of 87.5 percent. The commercials are Bearish-Extreme with a score of 12.6 percent and the small traders (not shown in chart) are Bullish with a score of 64.4 percent.
| SUGAR Futures Statistics | SPECULATORS | COMMERCIALS | SMALL TRADERS |
| – Percent of Open Interest Longs: | 33.4 | 41.9 | 10.0 |
| – Percent of Open Interest Shorts: | 5.6 | 74.9 | 4.8 |
| – Net Position: | 247,375 | -293,135 | 45,760 |
| – Gross Longs: | 296,884 | 372,006 | 88,637 |
| – Gross Shorts: | 49,509 | 665,141 | 42,877 |
| – Long to Short Ratio: | 6.0 to 1 | 0.6 to 1 | 2.1 to 1 |
| NET POSITION TREND: | |||
| – COT Index Score (3 Year Range Pct): | 87.5 | 12.6 | 64.4 |
| – COT Index Reading (3 Year Range): | Bullish-Extreme | Bearish-Extreme | Bullish |
| NET POSITION MOVEMENT INDEX: | |||
| – 6-Week Change in Strength Index: | -10.6 | 10.9 | -6.9 |
COFFEE Futures:
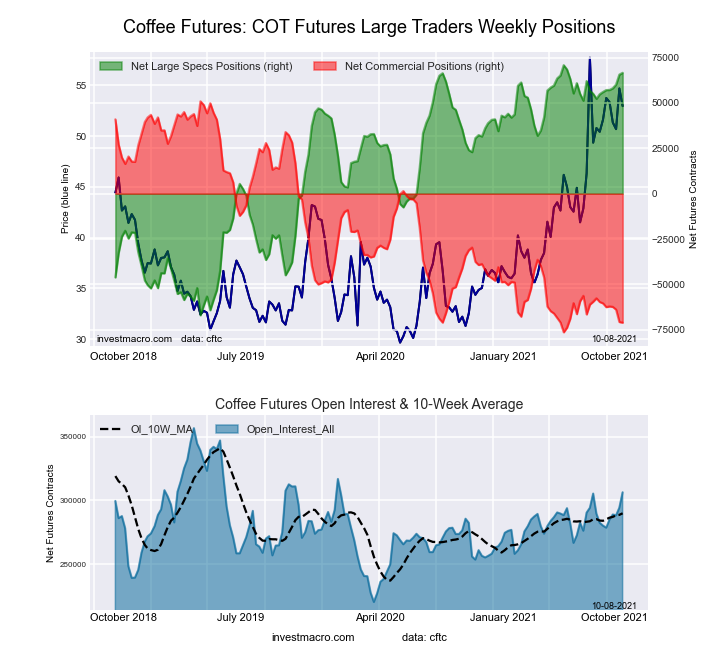 The COFFEE large speculator standing this week recorded a net position of 66,571 contracts in the data reported through Tuesday. This was a weekly lift of 996 contracts from the previous week which had a total of 65,575 net contracts.
This week’s current strength score (the trader positioning range over the past three years, measured from 0 to 100) shows the speculators are currently Bullish-Extreme with a score of 96.9 percent. The commercials are Bearish-Extreme with a score of 4.2 percent and the small traders (not shown in chart) are Bearish-Extreme with a score of 19.1 percent.
| COFFEE Futures Statistics | SPECULATORS | COMMERCIALS | SMALL TRADERS |
| – Percent of Open Interest Longs: | 27.6 | 39.6 | 3.8 |
| – Percent of Open Interest Shorts: | 5.9 | 62.8 | 2.4 |
| – Net Position: | 66,571 | -71,022 | 4,451 |
| – Gross Longs: | 84,602 | 121,365 | 11,705 |
| – Gross Shorts: | 18,031 | 192,387 | 7,254 |
| – Long to Short Ratio: | 4.7 to 1 | 0.6 to 1 | 1.6 to 1 |
| NET POSITION TREND: | |||
| – COT Index Score (3 Year Range Pct): | 96.9 | 4.2 | 19.1 |
| – COT Index Reading (3 Year Range): | Bullish-Extreme | Bearish-Extreme | Bearish-Extreme |
| NET POSITION MOVEMENT INDEX: | |||
| – 6-Week Change in Strength Index: | 7.7 | -8.4 | 0.5 |
SOYBEANS Futures:
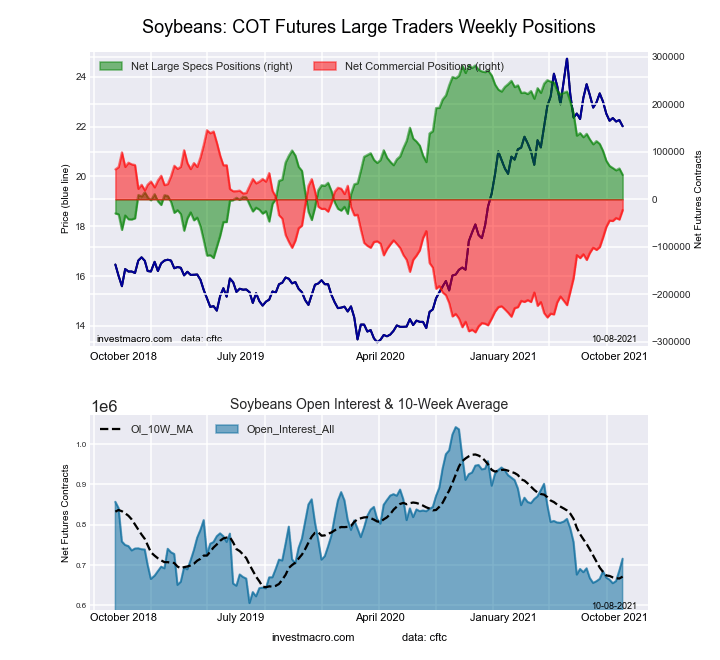 The SOYBEANS large speculator standing this week recorded a net position of 51,401 contracts in the data reported through Tuesday. This was a weekly reduction of -13,319 contracts from the previous week which had a total of 64,720 net contracts.
This week’s current strength score (the trader positioning range over the past three years, measured from 0 to 100) shows the speculators are currently Bearish with a score of 43.1 percent. The commercials are Bullish with a score of 60.5 percent and the small traders (not shown in chart) are Bearish with a score of 23.9 percent.
| SOYBEANS Futures Statistics | SPECULATORS | COMMERCIALS | SMALL TRADERS |
| – Percent of Open Interest Longs: | 19.2 | 56.2 | 6.7 |
| – Percent of Open Interest Shorts: | 12.0 | 59.4 | 10.8 |
| – Net Position: | 51,401 | -22,592 | -28,809 |
| – Gross Longs: | 137,547 | 402,376 | 48,264 |
| – Gross Shorts: | 86,146 | 424,968 | 77,073 |
| – Long to Short Ratio: | 1.6 to 1 | 0.9 to 1 | 0.6 to 1 |
| NET POSITION TREND: | |||
| – COT Index Score (3 Year Range Pct): | 43.1 | 60.5 | 23.9 |
| – COT Index Reading (3 Year Range): | Bearish | Bullish | Bearish |
| NET POSITION MOVEMENT INDEX: | |||
| – 6-Week Change in Strength Index: | -12.4 | 13.6 | -12.6 |
SOYBEAN MEAL Futures:
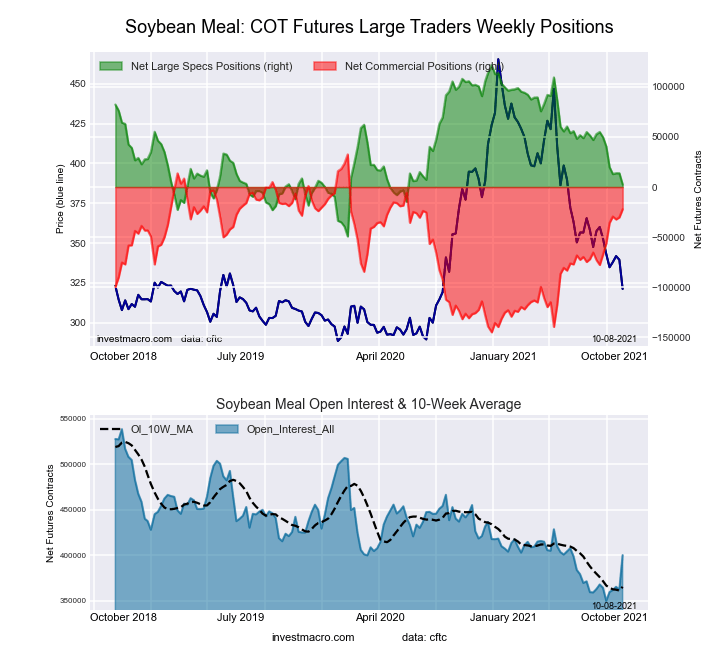 The SOYBEAN MEAL large speculator standing this week recorded a net position of 2,462 contracts in the data reported through Tuesday. This was a weekly fall of -11,337 contracts from the previous week which had a total of 13,799 net contracts.
This week’s current strength score (the trader positioning range over the past three years, measured from 0 to 100) shows the speculators are currently Bearish with a score of 30.3 percent. The commercials are Bullish with a score of 69.2 percent and the small traders (not shown in chart) are Bearish with a score of 49.5 percent.
| SOYBEAN MEAL Futures Statistics | SPECULATORS | COMMERCIALS | SMALL TRADERS |
| – Percent of Open Interest Longs: | 20.1 | 49.0 | 11.9 |
| – Percent of Open Interest Shorts: | 19.5 | 54.6 | 7.0 |
| – Net Position: | 2,462 | -22,153 | 19,691 |
| – Gross Longs: | 80,454 | 196,027 | 47,656 |
| – Gross Shorts: | 77,992 | 218,180 | 27,965 |
| – Long to Short Ratio: | 1.0 to 1 | 0.9 to 1 | 1.7 to 1 |
| NET POSITION TREND: | |||
| – COT Index Score (3 Year Range Pct): | 30.3 | 69.2 | 49.5 |
| – COT Index Reading (3 Year Range): | Bearish | Bullish | Bearish |
| NET POSITION MOVEMENT INDEX: | |||
| – 6-Week Change in Strength Index: | -27.6 | 25.5 | 8.0 |
LIVE CATTLE Futures:
 The LIVE CATTLE large speculator standing this week recorded a net position of 33,852 contracts in the data reported through Tuesday. This was a weekly fall of -6,311 contracts from the previous week which had a total of 40,163 net contracts.
This week’s current strength score (the trader positioning range over the past three years, measured from 0 to 100) shows the speculators are currently Bearish-Extreme with a score of 11.7 percent. The commercials are Bullish-Extreme with a score of 84.3 percent and the small traders (not shown in chart) are Bullish with a score of 74.6 percent.
| LIVE CATTLE Futures Statistics | SPECULATORS | COMMERCIALS | SMALL TRADERS |
| – Percent of Open Interest Longs: | 30.7 | 44.9 | 10.8 |
| – Percent of Open Interest Shorts: | 19.0 | 54.8 | 12.6 |
| – Net Position: | 33,852 | -28,700 | -5,152 |
| – Gross Longs: | 88,928 | 130,125 | 31,412 |
| – Gross Shorts: | 55,076 | 158,825 | 36,564 |
| – Long to Short Ratio: | 1.6 to 1 | 0.8 to 1 | 0.9 to 1 |
| NET POSITION TREND: | |||
| – COT Index Score (3 Year Range Pct): | 11.7 | 84.3 | 74.6 |
| – COT Index Reading (3 Year Range): | Bearish-Extreme | Bullish-Extreme | Bullish |
| NET POSITION MOVEMENT INDEX: | |||
| – 6-Week Change in Strength Index: | -41.9 | 42.5 | 26.7 |
LEAN HOGS Futures:
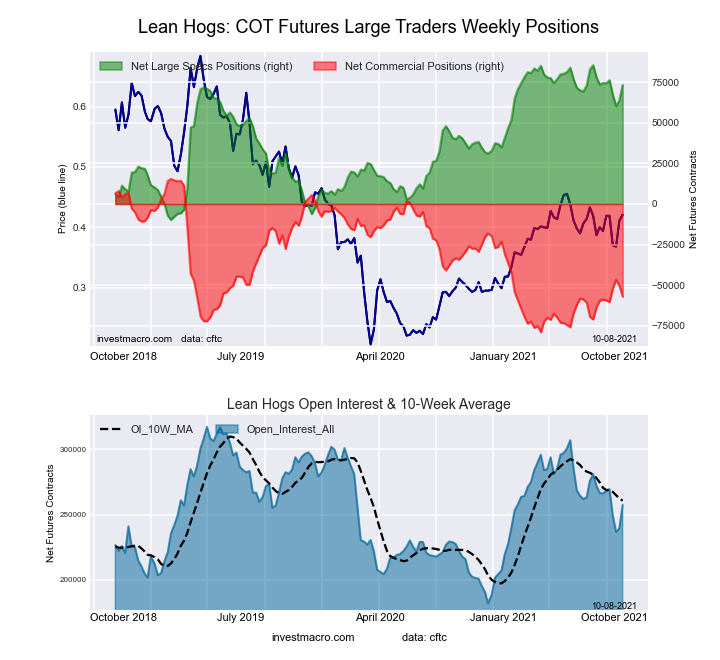 The LEAN HOGS large speculator standing this week recorded a net position of 73,429 contracts in the data reported through Tuesday. This was a weekly rise of 9,406 contracts from the previous week which had a total of 64,023 net contracts.
This week’s current strength score (the trader positioning range over the past three years, measured from 0 to 100) shows the speculators are currently Bullish-Extreme with a score of 87.2 percent. The commercials are Bearish with a score of 23.2 percent and the small traders (not shown in chart) are Bearish-Extreme with a score of 0.7 percent.
| LEAN HOGS Futures Statistics | SPECULATORS | COMMERCIALS | SMALL TRADERS |
| – Percent of Open Interest Longs: | 42.7 | 30.0 | 7.3 |
| – Percent of Open Interest Shorts: | 14.2 | 52.2 | 13.7 |
| – Net Position: | 73,429 | -57,148 | -16,281 |
| – Gross Longs: | 109,947 | 77,177 | 18,907 |
| – Gross Shorts: | 36,518 | 134,325 | 35,188 |
| – Long to Short Ratio: | 3.0 to 1 | 0.6 to 1 | 0.5 to 1 |
| NET POSITION TREND: | |||
| – COT Index Score (3 Year Range Pct): | 87.2 | 23.2 | 0.7 |
| – COT Index Reading (3 Year Range): | Bullish-Extreme | Bearish | Bearish-Extreme |
| NET POSITION MOVEMENT INDEX: | |||
| – 6-Week Change in Strength Index: | -1.3 | 1.9 | -2.8 |
COTTON Futures:
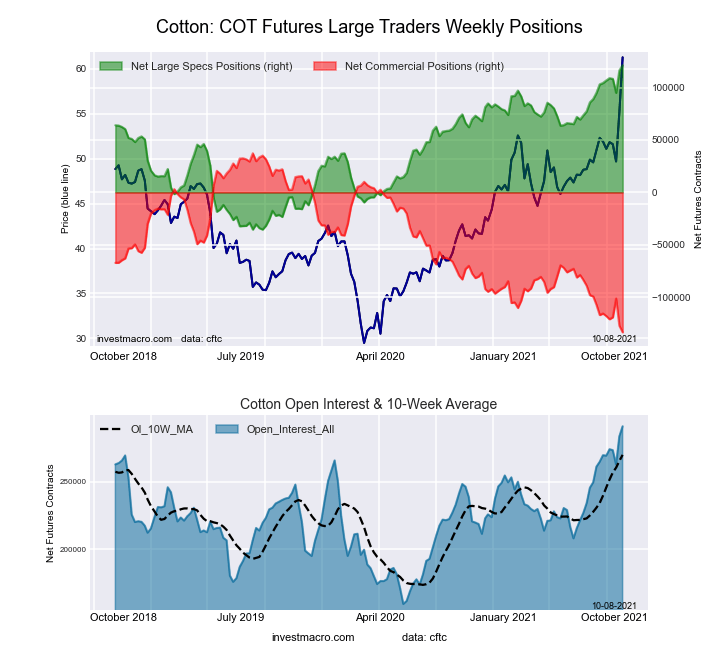 The COTTON large speculator standing this week recorded a net position of 121,286 contracts in the data reported through Tuesday. This was a weekly advance of 5,154 contracts from the previous week which had a total of 116,132 net contracts.
This week’s current strength score (the trader positioning range over the past three years, measured from 0 to 100) shows the speculators are currently Bullish-Extreme with a score of 100.0 percent. The commercials are Bearish-Extreme with a score of 0.0 percent and the small traders (not shown in chart) are Bullish-Extreme with a score of 88.5 percent.
| COTTON Futures Statistics | SPECULATORS | COMMERCIALS | SMALL TRADERS |
| – Percent of Open Interest Longs: | 46.2 | 32.9 | 7.3 |
| – Percent of Open Interest Shorts: | 4.5 | 78.7 | 3.2 |
| – Net Position: | 121,286 | -133,285 | 11,999 |
| – Gross Longs: | 134,307 | 95,687 | 21,371 |
| – Gross Shorts: | 13,021 | 228,972 | 9,372 |
| – Long to Short Ratio: | 10.3 to 1 | 0.4 to 1 | 2.3 to 1 |
| NET POSITION TREND: | |||
| – COT Index Score (3 Year Range Pct): | 100.0 | 0.0 | 88.5 |
| – COT Index Reading (3 Year Range): | Bullish-Extreme | Bearish-Extreme | Bullish-Extreme |
| NET POSITION MOVEMENT INDEX: | |||
| – 6-Week Change in Strength Index: | 10.8 | -10.5 | 5.4 |
COCOA Futures:
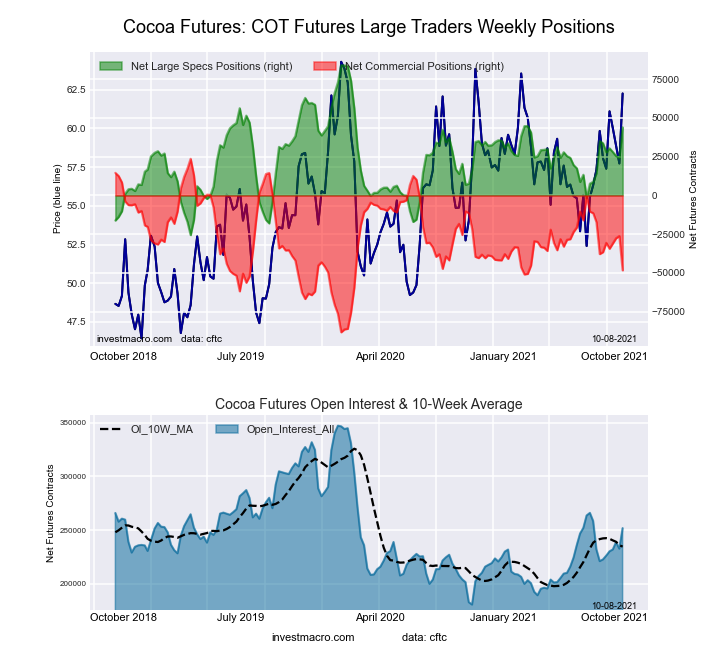 The COCOA large speculator standing this week recorded a net position of 43,997 contracts in the data reported through Tuesday. This was a weekly gain of 19,721 contracts from the previous week which had a total of 24,276 net contracts.
This week’s current strength score (the trader positioning range over the past three years, measured from 0 to 100) shows the speculators are currently Bullish with a score of 63.5 percent. The commercials are Bearish with a score of 35.7 percent and the small traders (not shown in chart) are Bullish with a score of 57.4 percent.
| COCOA Futures Statistics | SPECULATORS | COMMERCIALS | SMALL TRADERS |
| – Percent of Open Interest Longs: | 31.5 | 46.4 | 4.9 |
| – Percent of Open Interest Shorts: | 14.0 | 65.6 | 3.2 |
| – Net Position: | 43,997 | -48,301 | 4,304 |
| – Gross Longs: | 79,217 | 116,792 | 12,283 |
| – Gross Shorts: | 35,220 | 165,093 | 7,979 |
| – Long to Short Ratio: | 2.2 to 1 | 0.7 to 1 | 1.5 to 1 |
| NET POSITION TREND: | |||
| – COT Index Score (3 Year Range Pct): | 63.5 | 35.7 | 57.4 |
| – COT Index Reading (3 Year Range): | Bullish | Bearish | Bullish |
| NET POSITION MOVEMENT INDEX: | |||
| – 6-Week Change in Strength Index: | 9.4 | -10.5 | 15.7 |
WHEAT Futures:
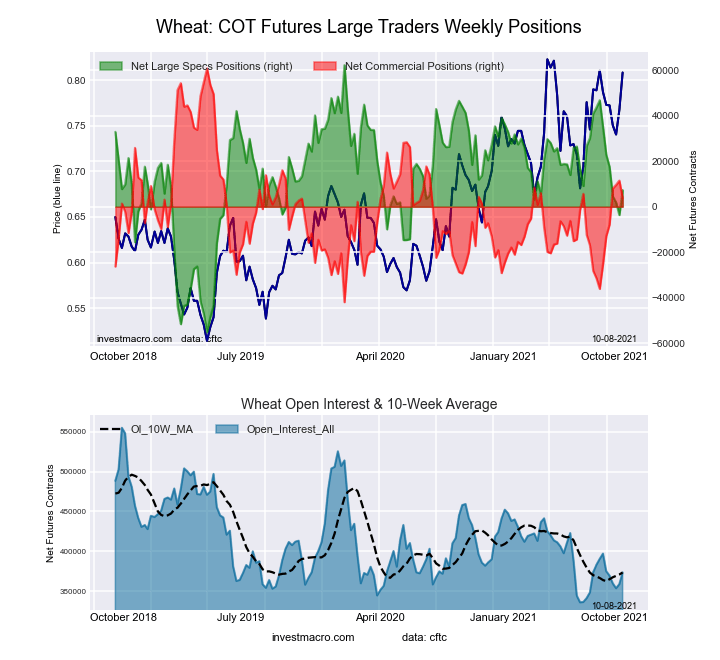 The WHEAT large speculator standing this week recorded a net position of 7,312 contracts in the data reported through Tuesday. This was a weekly rise of 10,957 contracts from the previous week which had a total of -3,645 net contracts.
This week’s current strength score (the trader positioning range over the past three years, measured from 0 to 100) shows the speculators are currently Bullish with a score of 53.2 percent. The commercials are Bearish with a score of 44.4 percent and the small traders (not shown in chart) are Bearish with a score of 49.0 percent.
| WHEAT Futures Statistics | SPECULATORS | COMMERCIALS | SMALL TRADERS |
| – Percent of Open Interest Longs: | 25.8 | 41.2 | 8.1 |
| – Percent of Open Interest Shorts: | 23.8 | 40.2 | 11.0 |
| – Net Position: | 7,312 | 3,695 | -11,007 |
| – Gross Longs: | 96,203 | 153,942 | 30,210 |
| – Gross Shorts: | 88,891 | 150,247 | 41,217 |
| – Long to Short Ratio: | 1.1 to 1 | 1.0 to 1 | 0.7 to 1 |
| NET POSITION TREND: | |||
| – COT Index Score (3 Year Range Pct): | 53.2 | 44.4 | 49.0 |
| – COT Index Reading (3 Year Range): | Bullish | Bearish | Bearish |
| NET POSITION MOVEMENT INDEX: | |||
| – 6-Week Change in Strength Index: | -23.6 | 28.1 | -5.6 |
Article By InvestMacro.com – Receive our weekly COT Reports by Email
*COT Report: The COT data, released weekly to the public each Friday, is updated through the most recent Tuesday (data is 3 days old) and shows a quick view of how large speculators or non-commercials (for-profit traders) were positioned in the futures markets.
The CFTC categorizes trader positions according to commercial hedgers (traders who use futures contracts for hedging as part of the business), non-commercials (large traders who speculate to realize trading profits) and nonreportable traders (usually small traders/speculators).
Find CFTC criteria here: (http://www.cftc.gov/MarketReports/CommitmentsofTraders/ExplanatoryNotes/index.htm).

- COT Metals Charts: Weekly Speculator Bets led by Copper & Steel Jul 18, 2026
- COT Bonds Charts: Weekly Speculator Bets led by 2-Year, SOFR 3M & 5-Year Bonds Jul 18, 2026
- COT Energy Charts: Weekly Speculator Bets led by Brent Oil & Heating Oil Jul 18, 2026
- COT Soft Commodities Charts: Weekly Speculator Bets led by Wheat, Corn & Soybean Meal Jul 18, 2026
- The Bank of Canada kept its interest rate unchanged. Platinum prices reached a three‑week high Jul 16, 2026
- Stock indices rose after the release of US inflation data. China’s GDP slowed sharply Jul 15, 2026
- GBP/USD Awaits Political News: What Will Happen Next Jul 15, 2026
- USD/JPY Holds at Highs: Pressure Lingers on Yen Jul 14, 2026
- Oil prices jumped 4% amid a new wave of escalation between the US and Iran Jul 13, 2026
- EUR/USD: US Inflation Will Determine Everything Jul 13, 2026