
By InvestMacro.com COT Home | Data Tables | Data Downloads | Newsletter
Here are the latest charts and statistics for the Commitment of Traders (COT) data published by the Commodities Futures Trading Commission (CFTC).
The latest COT data is updated through Tuesday September 28th 2021 and shows a quick view of how large traders (for-profit speculators and commercial entities) were positioned in the futures markets. All currency positions are in direct relation to the US dollar where, for example, a bet for the euro is a bet that the euro will rise versus the dollar while a bet against the euro will be a bet that the euro will decline versus the dollar.
Speculative positions in the US Dollar Index have now risen to a 98-week high at over +26,000 net contracts this week. The dollar speculative bets have increased for six consecutive weeks and for fourteen out of the past fifteen week. The last time bullish bets were this high was November 12th of 2019 when positions totaled of +27,784 contracts.
US Dollar Index Futures:
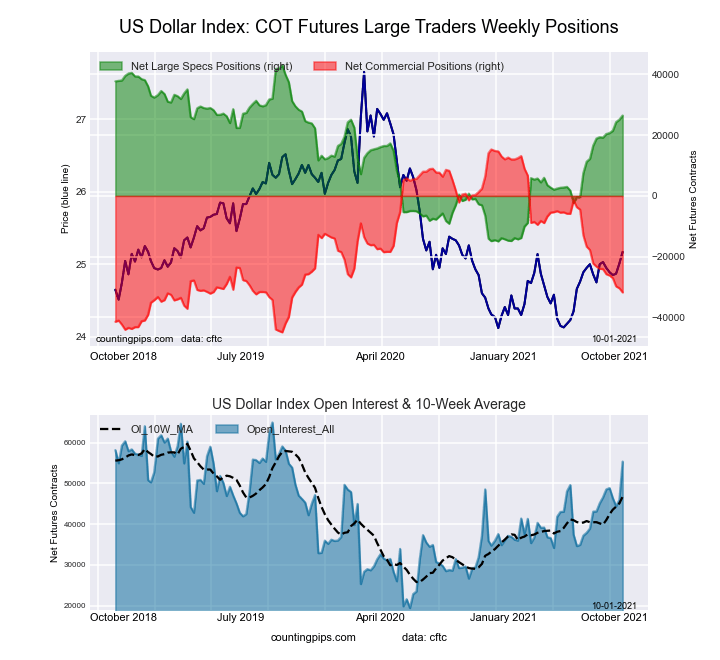 The US Dollar Index large speculator standing this week equaled a net position of 26,461 contracts in the data reported through Tuesday. This was a weekly gain of 1,361 contracts from the previous week which had a total of 25,100 net contracts.
This week’s current strength score (the trader positioning range over the past three years, measured from 0 to 100) shows the speculators are currently Bullish with a score of 71.4 percent. The commercials are Bearish with a score of 21.8 percent and the small traders (not shown in chart) are Bullish-Extreme with a score of 94.4 percent.
Free Reports:
 Get our Weekly Commitment of Traders Reports - See where the biggest traders (Hedge Funds and Commercial Hedgers) are positioned in the futures markets on a weekly basis.
 Download Our Metatrader 4 Indicators – Put Our Free MetaTrader 4 Custom Indicators on your charts when you join our Weekly Newsletter
| US DOLLAR INDEX Statistics | SPECULATORS | COMMERCIALS | SMALL TRADERS |
| – Percent of Open Interest Longs: | 81.4 | 2.8 | 12.9 |
| – Percent of Open Interest Shorts: | 33.6 | 60.3 | 3.3 |
| – Net Position: | 26,461 | -31,772 | 5,311 |
| – Gross Longs: | 45,054 | 1,565 | 7,110 |
| – Gross Shorts: | 18,593 | 33,337 | 1,799 |
| – Long to Short Ratio: | 2.4 to 1 | 0.0 to 1 | 4.0 to 1 |
| NET POSITION TREND: | |||
| – COT Index Score (3 Year Range Pct): | 71.4 | 21.8 | 94.4 |
| – COT Index Reading (3 Year Range): | Bullish | Bearish | Bullish-Extreme |
| NET POSITION MOVEMENT INDEX: | |||
| – 6-Week Change in Strength Index: | 12.5 | -12.8 | 6.0 |
Euro Currency Futures:
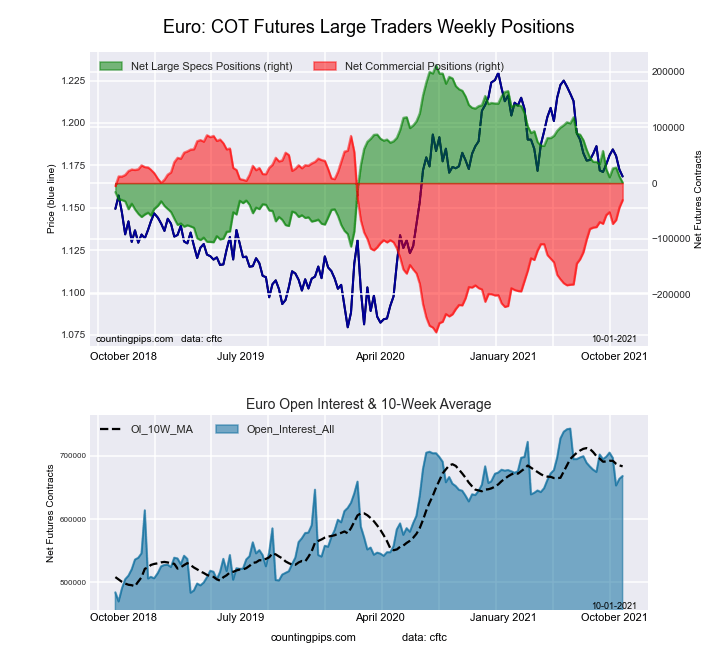 The Euro Currency large speculator standing this week equaled a net position of 872 contracts in the data reported through Tuesday. This was a weekly decrease of -11,223 contracts from the previous week which had a total of 12,095 net contracts.
This week’s current strength score (the trader positioning range over the past three years, measured from 0 to 100) shows the speculators are currently Bearish with a score of 35.3 percent. The commercials are Bullish with a score of 67.1 percent and the small traders (not shown in chart) are Bearish with a score of 26.8 percent.
| EURO Currency Statistics | SPECULATORS | COMMERCIALS | SMALL TRADERS |
| – Percent of Open Interest Longs: | 29.2 | 56.7 | 13.0 |
| – Percent of Open Interest Shorts: | 29.1 | 61.2 | 8.6 |
| – Net Position: | 872 | -30,424 | 29,552 |
| – Gross Longs: | 195,043 | 378,476 | 87,150 |
| – Gross Shorts: | 194,171 | 408,900 | 57,598 |
| – Long to Short Ratio: | 1.0 to 1 | 0.9 to 1 | 1.5 to 1 |
| NET POSITION TREND: | |||
| – COT Index Score (3 Year Range Pct): | 35.3 | 67.1 | 26.8 |
| – COT Index Reading (3 Year Range): | Bearish | Bullish | Bearish |
| NET POSITION MOVEMENT INDEX: | |||
| – 6-Week Change in Strength Index: | -17.4 | 12.1 | 22.3 |
British Pound Sterling Futures:
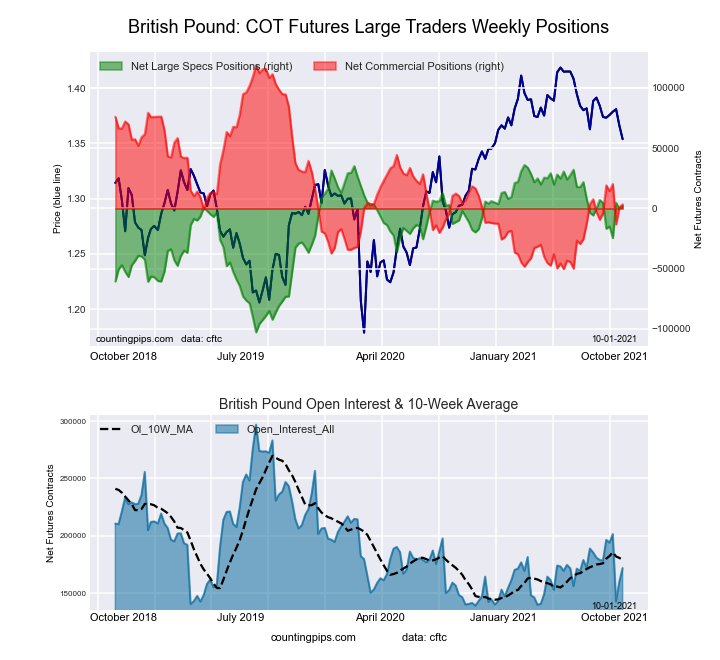 The British Pound Sterling large speculator standing this week equaled a net position of 1,964 contracts in the data reported through Tuesday. This was a weekly lift of 2,182 contracts from the previous week which had a total of -218 net contracts.
This week’s current strength score (the trader positioning range over the past three years, measured from 0 to 100) shows the speculators are currently Bullish with a score of 75.4 percent. The commercials are Bearish with a score of 31.7 percent and the small traders (not shown in chart) are Bearish with a score of 44.5 percent.
| BRITISH POUND Statistics | SPECULATORS | COMMERCIALS | SMALL TRADERS |
| – Percent of Open Interest Longs: | 33.7 | 48.6 | 15.7 |
| – Percent of Open Interest Shorts: | 32.6 | 46.6 | 18.8 |
| – Net Position: | 1,964 | 3,411 | -5,375 |
| – Gross Longs: | 57,923 | 83,471 | 26,971 |
| – Gross Shorts: | 55,959 | 80,060 | 32,346 |
| – Long to Short Ratio: | 1.0 to 1 | 1.0 to 1 | 0.8 to 1 |
| NET POSITION TREND: | |||
| – COT Index Score (3 Year Range Pct): | 75.4 | 31.7 | 44.5 |
| – COT Index Reading (3 Year Range): | Bullish | Bearish | Bearish |
| NET POSITION MOVEMENT INDEX: | |||
| – 6-Week Change in Strength Index: | -1.9 | 4.4 | -9.9 |
Japanese Yen Futures:
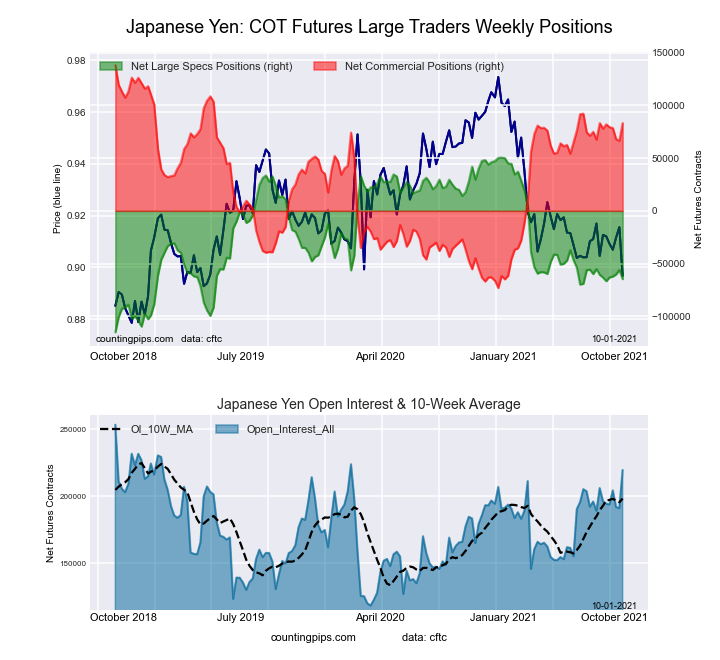 The Japanese Yen large speculator standing this week equaled a net position of -64,760 contracts in the data reported through Tuesday. This was a weekly fall of -8,689 contracts from the previous week which had a total of -56,071 net contracts.
This week’s current strength score (the trader positioning range over the past three years, measured from 0 to 100) shows the speculators are currently Bearish with a score of 30.4 percent. The commercials are Bullish with a score of 74.0 percent and the small traders (not shown in chart) are Bearish-Extreme with a score of 12.3 percent.
| JAPANESE YEN Statistics | SPECULATORS | COMMERCIALS | SMALL TRADERS |
| – Percent of Open Interest Longs: | 16.1 | 75.2 | 8.1 |
| – Percent of Open Interest Shorts: | 45.6 | 37.3 | 16.5 |
| – Net Position: | -64,760 | 83,279 | -18,519 |
| – Gross Longs: | 35,328 | 165,246 | 17,806 |
| – Gross Shorts: | 100,088 | 81,967 | 36,325 |
| – Long to Short Ratio: | 0.4 to 1 | 2.0 to 1 | 0.5 to 1 |
| NET POSITION TREND: | |||
| – COT Index Score (3 Year Range Pct): | 30.4 | 74.0 | 12.3 |
| – COT Index Reading (3 Year Range): | Bearish | Bullish | Bearish-Extreme |
| NET POSITION MOVEMENT INDEX: | |||
| – 6-Week Change in Strength Index: | -0.9 | 2.5 | -7.7 |
Swiss Franc Futures:
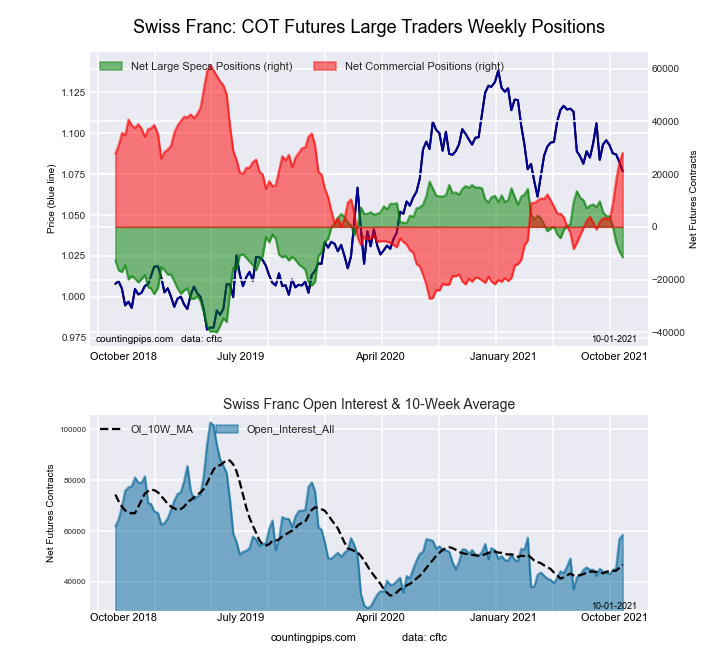 The Swiss Franc large speculator standing this week equaled a net position of -11,587 contracts in the data reported through Tuesday. This was a weekly reduction of -2,370 contracts from the previous week which had a total of -9,217 net contracts.
This week’s current strength score (the trader positioning range over the past three years, measured from 0 to 100) shows the speculators are currently Bearish with a score of 49.7 percent. The commercials are Bullish with a score of 62.4 percent and the small traders (not shown in chart) are Bearish-Extreme with a score of 15.0 percent.
| SWISS FRANC Statistics | SPECULATORS | COMMERCIALS | SMALL TRADERS |
| – Percent of Open Interest Longs: | 11.5 | 72.9 | 15.5 |
| – Percent of Open Interest Shorts: | 31.3 | 25.0 | 43.6 |
| – Net Position: | -11,587 | 28,058 | -16,471 |
| – Gross Longs: | 6,734 | 42,675 | 9,060 |
| – Gross Shorts: | 18,321 | 14,617 | 25,531 |
| – Long to Short Ratio: | 0.4 to 1 | 2.9 to 1 | 0.4 to 1 |
| NET POSITION TREND: | |||
| – COT Index Score (3 Year Range Pct): | 49.7 | 62.4 | 15.0 |
| – COT Index Reading (3 Year Range): | Bearish | Bullish | Bearish-Extreme |
| NET POSITION MOVEMENT INDEX: | |||
| – 6-Week Change in Strength Index: | -30.0 | 28.0 | -22.4 |
Canadian Dollar Futures:
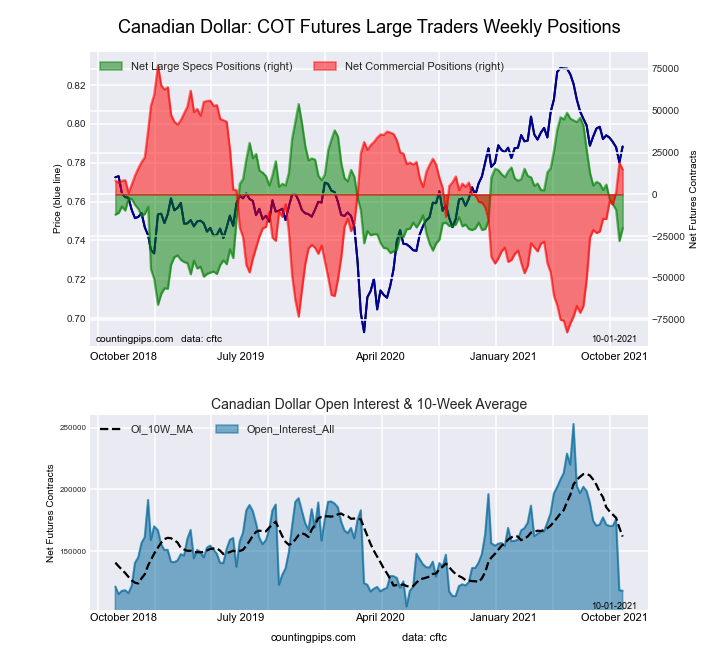 The Canadian Dollar large speculator standing this week equaled a net position of -20,235 contracts in the data reported through Tuesday. This was a weekly rise of 7,642 contracts from the previous week which had a total of -27,877 net contracts.
This week’s current strength score (the trader positioning range over the past three years, measured from 0 to 100) shows the speculators are currently Bearish with a score of 38.1 percent. The commercials are Bullish with a score of 60.9 percent and the small traders (not shown in chart) are Bullish with a score of 54.9 percent.
| CANADIAN DOLLAR Statistics | SPECULATORS | COMMERCIALS | SMALL TRADERS |
| – Percent of Open Interest Longs: | 18.5 | 53.0 | 26.9 |
| – Percent of Open Interest Shorts: | 35.7 | 40.4 | 22.3 |
| – Net Position: | -20,235 | 14,833 | 5,402 |
| – Gross Longs: | 21,873 | 62,549 | 31,747 |
| – Gross Shorts: | 42,108 | 47,716 | 26,345 |
| – Long to Short Ratio: | 0.5 to 1 | 1.3 to 1 | 1.2 to 1 |
| NET POSITION TREND: | |||
| – COT Index Score (3 Year Range Pct): | 38.1 | 60.9 | 54.9 |
| – COT Index Reading (3 Year Range): | Bearish | Bullish | Bullish |
| NET POSITION MOVEMENT INDEX: | |||
| – 6-Week Change in Strength Index: | -19.1 | 18.5 | -9.9 |
Australian Dollar Futures:
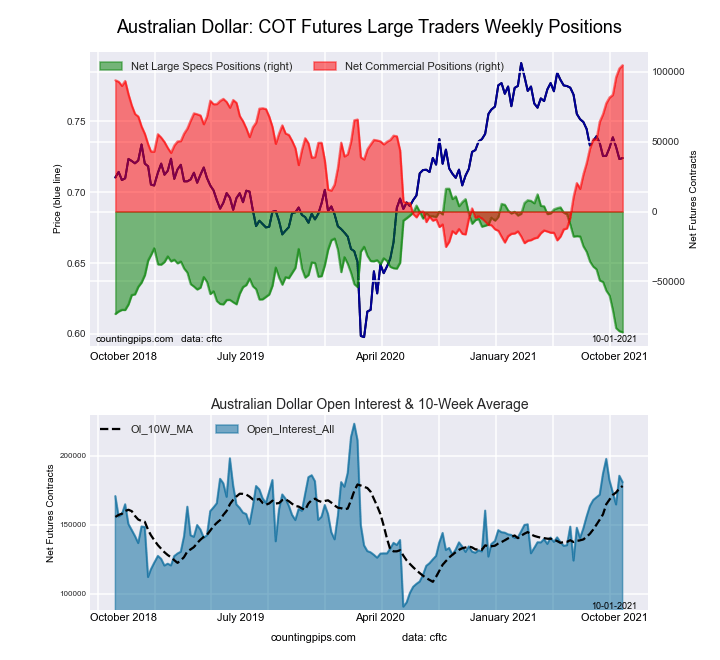 The Australian Dollar large speculator standing this week equaled a net position of -86,383 contracts in the data reported through Tuesday. This was a weekly lowering of -799 contracts from the previous week which had a total of -85,584 net contracts.
This week’s current strength score (the trader positioning range over the past three years, measured from 0 to 100) shows the speculators are currently Bearish-Extreme with a score of 0.0 percent. The commercials are Bullish-Extreme with a score of 100.0 percent and the small traders (not shown in chart) are Bearish-Extreme with a score of 11.0 percent.
| AUSTRALIAN DOLLAR Statistics | SPECULATORS | COMMERCIALS | SMALL TRADERS |
| – Percent of Open Interest Longs: | 10.2 | 79.5 | 8.0 |
| – Percent of Open Interest Shorts: | 57.9 | 21.7 | 18.1 |
| – Net Position: | -86,383 | 104,698 | -18,315 |
| – Gross Longs: | 18,407 | 143,863 | 14,460 |
| – Gross Shorts: | 104,790 | 39,165 | 32,775 |
| – Long to Short Ratio: | 0.2 to 1 | 3.7 to 1 | 0.4 to 1 |
| NET POSITION TREND: | |||
| – COT Index Score (3 Year Range Pct): | 0.0 | 100.0 | 11.0 |
| – COT Index Reading (3 Year Range): | Bearish-Extreme | Bullish-Extreme | Bearish-Extreme |
| NET POSITION MOVEMENT INDEX: | |||
| – 6-Week Change in Strength Index: | -35.1 | 26.9 | 2.4 |
New Zealand Dollar Futures:
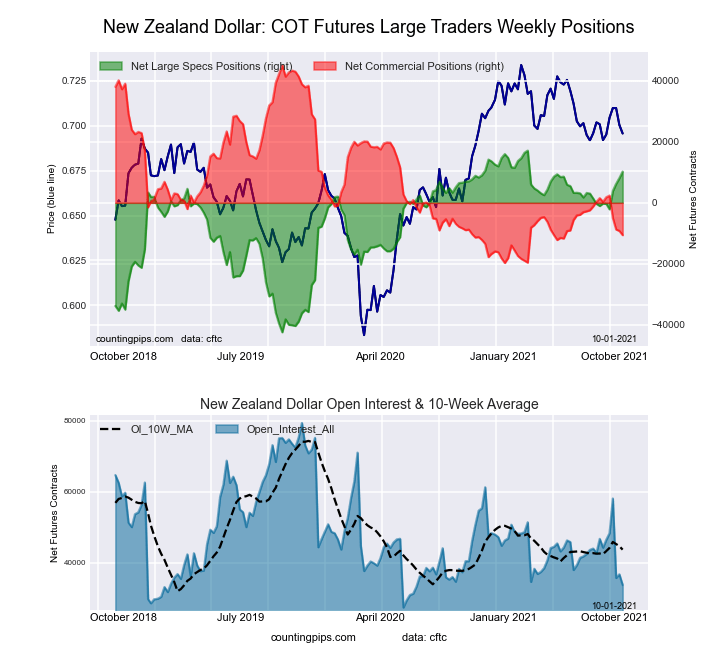 The New Zealand Dollar large speculator standing this week equaled a net position of 10,246 contracts in the data reported through Tuesday. This was a weekly boost of 2,144 contracts from the previous week which had a total of 8,102 net contracts.
This week’s current strength score (the trader positioning range over the past three years, measured from 0 to 100) shows the speculators are currently Bullish-Extreme with a score of 88.5 percent. The commercials are Bearish-Extreme with a score of 14.1 percent and the small traders (not shown in chart) are Bullish with a score of 57.2 percent.
| NEW ZEALAND DOLLAR Statistics | SPECULATORS | COMMERCIALS | SMALL TRADERS |
| – Percent of Open Interest Longs: | 54.4 | 31.1 | 12.2 |
| – Percent of Open Interest Shorts: | 24.0 | 62.6 | 11.1 |
| – Net Position: | 10,246 | -10,598 | 352 |
| – Gross Longs: | 18,324 | 10,472 | 4,106 |
| – Gross Shorts: | 8,078 | 21,070 | 3,754 |
| – Long to Short Ratio: | 2.3 to 1 | 0.5 to 1 | 1.1 to 1 |
| NET POSITION TREND: | |||
| – COT Index Score (3 Year Range Pct): | 88.5 | 14.1 | 57.2 |
| – COT Index Reading (3 Year Range): | Bullish-Extreme | Bearish-Extreme | Bullish |
| NET POSITION MOVEMENT INDEX: | |||
| – 6-Week Change in Strength Index: | 17.6 | -16.9 | 5.1 |
Mexican Peso Futures:
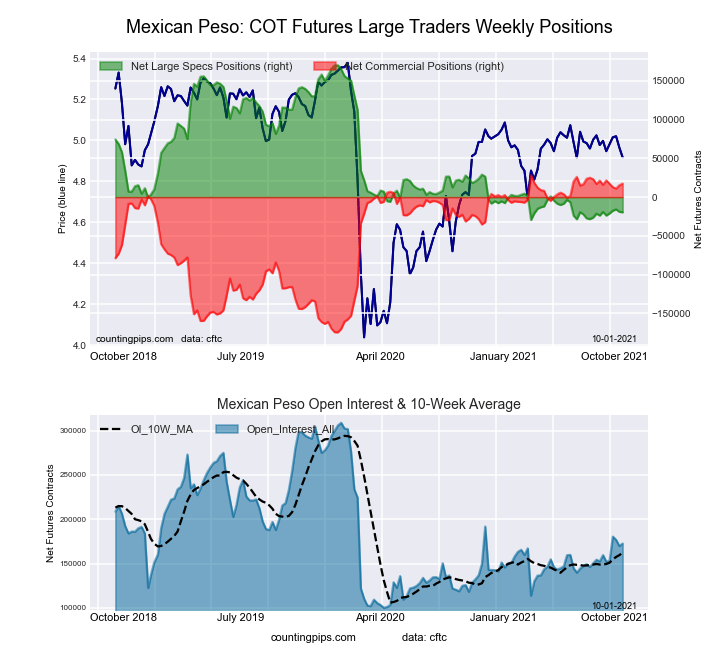 The Mexican Peso large speculator standing this week equaled a net position of -19,595 contracts in the data reported through Tuesday. This was a weekly reduction of -580 contracts from the previous week which had a total of -19,015 net contracts.
This week’s current strength score (the trader positioning range over the past three years, measured from 0 to 100) shows the speculators are currently Bearish-Extreme with a score of 4.9 percent. The commercials are Bullish-Extreme with a score of 94.8 percent and the small traders (not shown in chart) are Bullish with a score of 52.0 percent.
| MEXICAN PESO Statistics | SPECULATORS | COMMERCIALS | SMALL TRADERS |
| – Percent of Open Interest Longs: | 53.5 | 42.3 | 3.2 |
| – Percent of Open Interest Shorts: | 64.9 | 32.2 | 2.0 |
| – Net Position: | -19,595 | 17,487 | 2,108 |
| – Gross Longs: | 92,423 | 73,086 | 5,510 |
| – Gross Shorts: | 112,018 | 55,599 | 3,402 |
| – Long to Short Ratio: | 0.8 to 1 | 1.3 to 1 | 1.6 to 1 |
| NET POSITION TREND: | |||
| – COT Index Score (3 Year Range Pct): | 4.9 | 94.8 | 52.0 |
| – COT Index Reading (3 Year Range): | Bearish-Extreme | Bullish-Extreme | Bullish |
| NET POSITION MOVEMENT INDEX: | |||
| – 6-Week Change in Strength Index: | -0.2 | 0.8 | -4.5 |
Brazilian Real Futures:
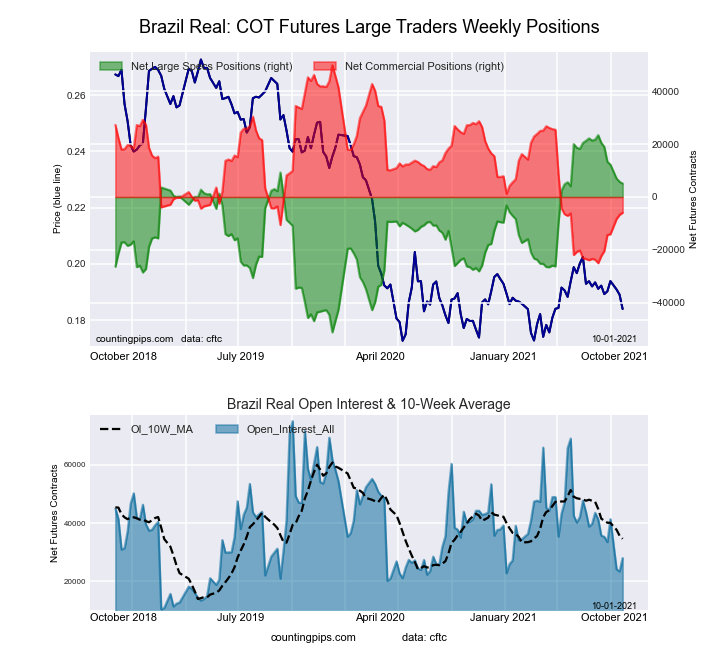 The Brazilian Real large speculator standing this week equaled a net position of 5,086 contracts in the data reported through Tuesday. This was a weekly fall of -686 contracts from the previous week which had a total of 5,772 net contracts.
This week’s current strength score (the trader positioning range over the past three years, measured from 0 to 100) shows the speculators are currently Bullish with a score of 75.4 percent. The commercials are Bearish with a score of 25.5 percent and the small traders (not shown in chart) are Bullish with a score of 77.3 percent.
| BRAZIL REAL Statistics | SPECULATORS | COMMERCIALS | SMALL TRADERS |
| – Percent of Open Interest Longs: | 45.5 | 42.2 | 10.7 |
| – Percent of Open Interest Shorts: | 27.3 | 63.5 | 7.6 |
| – Net Position: | 5,086 | -5,956 | 870 |
| – Gross Longs: | 12,737 | 11,796 | 3,007 |
| – Gross Shorts: | 7,651 | 17,752 | 2,137 |
| – Long to Short Ratio: | 1.7 to 1 | 0.7 to 1 | 1.4 to 1 |
| NET POSITION TREND: | |||
| – COT Index Score (3 Year Range Pct): | 75.4 | 25.5 | 77.3 |
| – COT Index Reading (3 Year Range): | Bullish | Bearish | Bullish |
| NET POSITION MOVEMENT INDEX: | |||
| – 6-Week Change in Strength Index: | -18.6 | 19.4 | -7.6 |
Russian Ruble Futures:
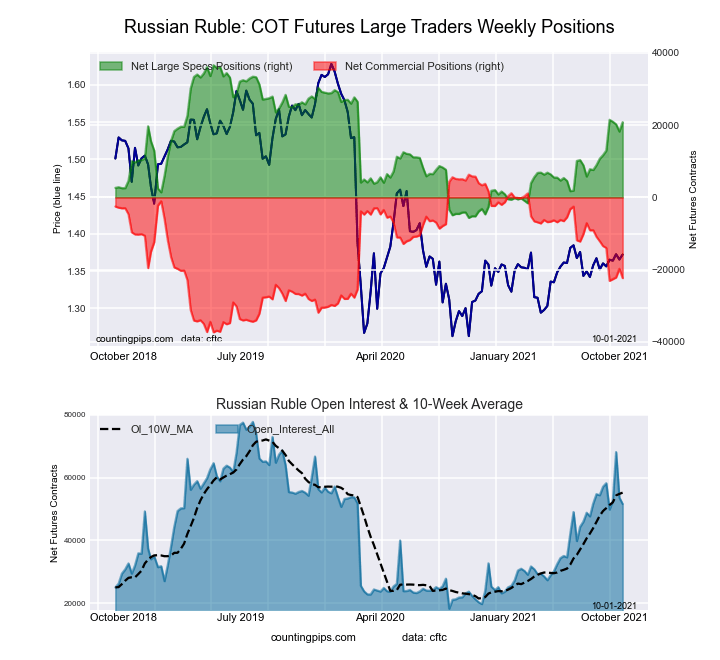 The Russian Ruble large speculator standing this week equaled a net position of 20,828 contracts in the data reported through Tuesday. This was a weekly rise of 2,595 contracts from the previous week which had a total of 18,233 net contracts.
This week’s current strength score (the trader positioning range over the past three years, measured from 0 to 100) shows the speculators are currently Bullish with a score of 62.7 percent. The commercials are Bearish with a score of 34.3 percent and the small traders (not shown in chart) are Bullish-Extreme with a score of 85.6 percent.
| RUSSIAN RUBLE Statistics | SPECULATORS | COMMERCIALS | SMALL TRADERS |
| – Percent of Open Interest Longs: | 55.0 | 40.0 | 4.8 |
| – Percent of Open Interest Shorts: | 14.7 | 83.2 | 1.9 |
| – Net Position: | 20,828 | -22,334 | 1,506 |
| – Gross Longs: | 28,397 | 20,617 | 2,485 |
| – Gross Shorts: | 7,569 | 42,951 | 979 |
| – Long to Short Ratio: | 3.8 to 1 | 0.5 to 1 | 2.5 to 1 |
| NET POSITION TREND: | |||
| – COT Index Score (3 Year Range Pct): | 62.7 | 34.3 | 85.6 |
| – COT Index Reading (3 Year Range): | Bullish | Bearish | Bullish-Extreme |
| NET POSITION MOVEMENT INDEX: | |||
| – 6-Week Change in Strength Index: | 21.6 | -20.4 | -7.4 |
Bitcoin Futures:
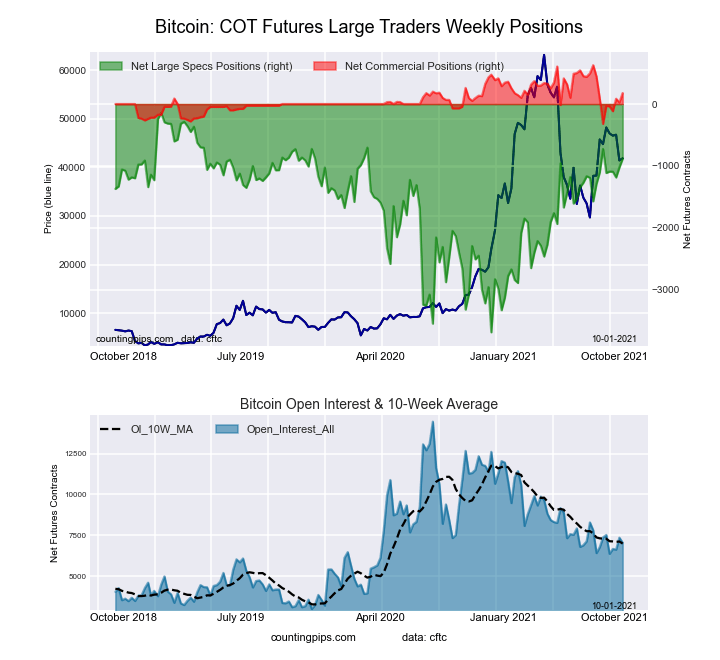 The Bitcoin large speculator standing this week equaled a net position of -883 contracts in the data reported through Tuesday. This was a weekly gain of 142 contracts from the previous week which had a total of -1,025 net contracts.
This week’s current strength score (the trader positioning range over the past three years, measured from 0 to 100) shows the speculators are currently Bullish with a score of 79.1 percent. The commercials are Bullish with a score of 52.6 percent and the small traders (not shown in chart) are Bearish-Extreme with a score of 12.9 percent.
| BITCOIN Statistics | SPECULATORS | COMMERCIALS | SMALL TRADERS |
| – Percent of Open Interest Longs: | 64.5 | 6.8 | 21.0 |
| – Percent of Open Interest Shorts: | 77.0 | 4.3 | 11.0 |
| – Net Position: | -883 | 178 | 705 |
| – Gross Longs: | 4,539 | 479 | 1,480 |
| – Gross Shorts: | 5,422 | 301 | 775 |
| – Long to Short Ratio: | 0.8 to 1 | 1.6 to 1 | 1.9 to 1 |
| NET POSITION TREND: | |||
| – COT Index Score (3 Year Range Pct): | 79.1 | 52.6 | 12.9 |
| – COT Index Reading (3 Year Range): | Bullish | Bullish | Bearish-Extreme |
| NET POSITION MOVEMENT INDEX: | |||
| – 6-Week Change in Strength Index: | -4.4 | 52.6 | -11.3 |
Article By InvestMacro.com – Receive our weekly COT Reports by Email
*COT Report: The COT data, released weekly to the public each Friday, is updated through the most recent Tuesday (data is 3 days old) and shows a quick view of how large speculators or non-commercials (for-profit traders) were positioned in the futures markets.
The CFTC categorizes trader positions according to commercial hedgers (traders who use futures contracts for hedging as part of the business), non-commercials (large traders who speculate to realize trading profits) and nonreportable traders (usually small traders/speculators).
Find CFTC criteria here: (http://www.cftc.gov/MarketReports/CommitmentsofTraders/ExplanatoryNotes/index.htm).

- COT Metals Charts: Weekly Speculator Bets led by Copper & Steel Jul 18, 2026
- COT Bonds Charts: Weekly Speculator Bets led by 2-Year, SOFR 3M & 5-Year Bonds Jul 18, 2026
- COT Energy Charts: Weekly Speculator Bets led by Brent Oil & Heating Oil Jul 18, 2026
- COT Soft Commodities Charts: Weekly Speculator Bets led by Wheat, Corn & Soybean Meal Jul 18, 2026
- The Bank of Canada kept its interest rate unchanged. Platinum prices reached a three‑week high Jul 16, 2026
- Stock indices rose after the release of US inflation data. China’s GDP slowed sharply Jul 15, 2026
- GBP/USD Awaits Political News: What Will Happen Next Jul 15, 2026
- USD/JPY Holds at Highs: Pressure Lingers on Yen Jul 14, 2026
- Oil prices jumped 4% amid a new wave of escalation between the US and Iran Jul 13, 2026
- EUR/USD: US Inflation Will Determine Everything Jul 13, 2026