Archive for CountingPips Forex Blog – Page 18

COT Forex Speculators edged US Dollar Index bullish bets to 115-week high

By InvestMacro | COT | Data Tables | COT Leaders | Downloads | COT Newsletter

Here are the latest charts and statistics for the Commitment of Traders (COT) data published by the Commodities Futures Trading Commission (CFTC). The latest release was delayed by the CFTC due to the New Year’s holiday.

The latest COT data is updated through Tuesday December 28th 2021 and shows a quick view of how large traders (for-profit speculators and commercial entities) were positioned in the futures markets. All currency positions are in direct relation to the US dollar where, for example, a bet for the euro is a bet that the euro will rise versus the dollar while a bet against the euro will be a bet that the euro will decline versus the dollar.

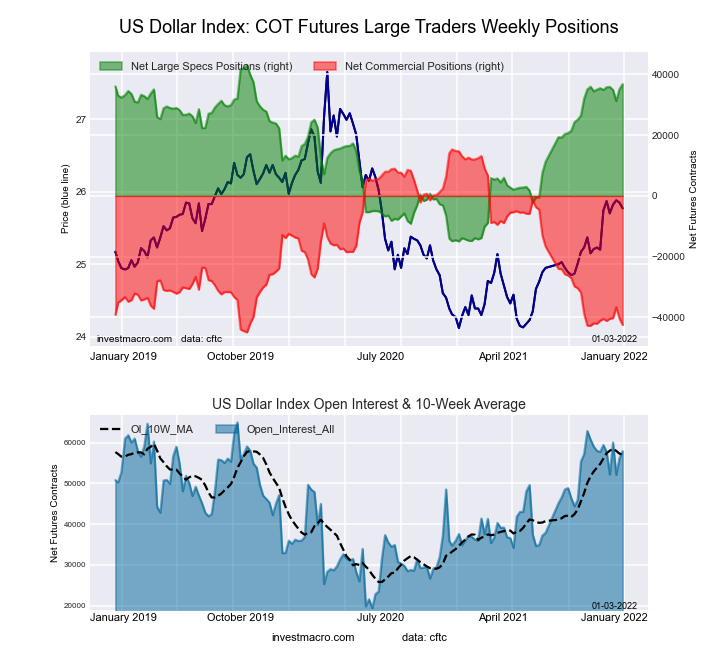
Highlighting the COT currency data was the continued strong run of bullish bets in the US Dollar Index currency futures contracts. Dollar Index speculator bets rose for the second straight week last week and for the fifteenth time out of the past nineteen weeks. The Dollar Index speculator bets not only closed out the year at their highest standing of 2021 but the bullish bets ascended to the highest level of the past one hundred and fifteen weeks, dating back to October 22nd of 2019. The Dollar Index’s current strength index score (comparing current speculator level to the range of the past 3 years) remains in an extreme bullish level with a score of 89.2 percent.

Joining the US Dollar Index (1,674 contracts) with positive changes last week were the Euro (3,528 contracts), Brazil real (1,261 contracts), British pound sterling (6,967 contracts) and Bitcoin (336 contracts).

The currencies with declining bets were the Japanese yen (-816 contracts), Swiss franc (-1,491 contracts), Australian dollar (-1,387 contracts), New Zealand dollar (-2,285 contracts), Canadian dollar (-457 contracts), Russian ruble (-157 contracts) and the Mexican peso (-4,216 contracts).


Data Snapshot of Forex Market Traders | Columns Legend
Dec-28-2021OIOI-IndexSpec-NetSpec-IndexCom-NetCOM-IndexSmalls-NetSmalls-Index
USD Index57,8928536,78989-42,46145,67279
EUR673,27373-6,63433-18,5337025,16716
GBP205,37842-50,7193760,10165-9,38236
JPY203,81458-53,1023472,36472-19,2628
CHF40,12214-10,7185115,22648-4,50850
CAD138,69223-10,334467,167563,16736
AUD183,15270-81,741899,47693-17,7359
NZD41,86228-8,4215710,10046-1,67933
MXN102,4184-9,008248,3347667446
RUB47,726508,46433-9,886631,42273
BRL37,38439-5,286625,49341-20764
Bitcoin12,46869-54291-224076630


US Dollar Index Futures:

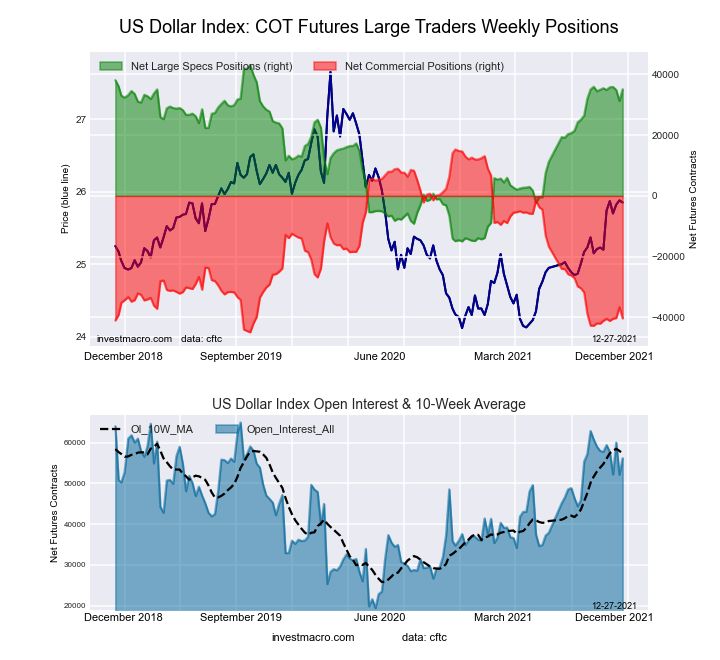
US Dollar Index Forex Futures COT ChartThe US Dollar Index large speculator standing this week totaled a net position of 36,789 contracts in the data reported through Tuesday. This was a weekly lift of 1,674 contracts from the previous week which had a total of 35,115 net contracts.

This week’s current strength score (the trader positioning range over the past three years, measured from 0 to 100) shows the speculators are currently Bullish-Extreme with a score of 89.2 percent. The commercials are Bearish-Extreme with a score of 4.0 percent and the small traders (not shown in chart) are Bullish with a score of 78.6 percent.

US DOLLAR INDEX StatisticsSPECULATORSCOMMERCIALSSMALL TRADERS
– Percent of Open Interest Longs:81.53.612.9
– Percent of Open Interest Shorts:17.977.03.1
– Net Position:36,789-42,4615,672
– Gross Longs:47,1692,1027,471
– Gross Shorts:10,38044,5631,799
– Long to Short Ratio:4.5 to 10.0 to 14.2 to 1
NET POSITION TREND:
– Strength Index Score (3 Year Range Pct):89.24.078.6
– Strength Index Reading (3 Year Range):Bullish-ExtremeBearish-ExtremeBullish
NET POSITION MOVEMENT INDEX:
– 6-Week Change in Strength Index:3.2-3.31.4


Euro Currency Futures:

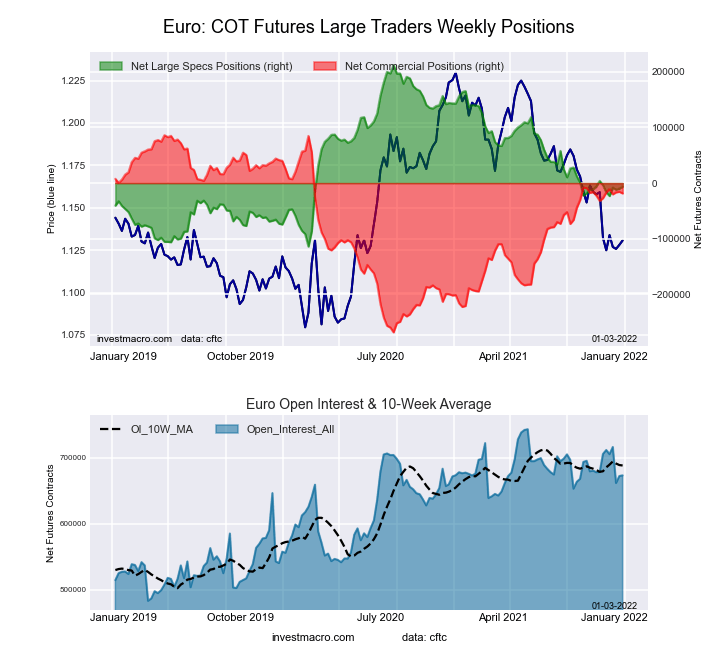
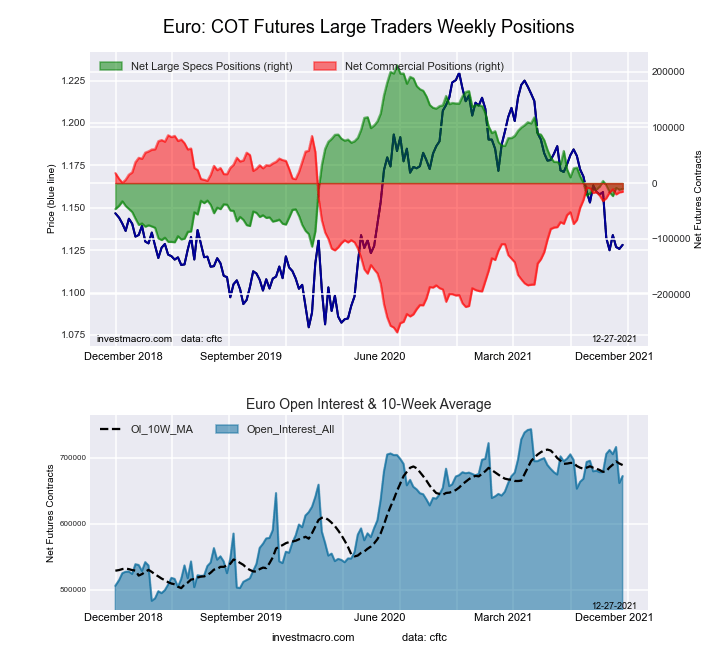
Euro Currency Futures COT ChartThe Euro Currency large speculator standing this week totaled a net position of -6,634 contracts in the data reported through Tuesday. This was a weekly gain of 3,528 contracts from the previous week which had a total of -10,162 net contracts.

This week’s current strength score (the trader positioning range over the past three years, measured from 0 to 100) shows the speculators are currently Bearish with a score of 33.0 percent. The commercials are Bullish with a score of 70.5 percent and the small traders (not shown in chart) are Bearish-Extreme with a score of 16.1 percent.

EURO Currency StatisticsSPECULATORSCOMMERCIALSSMALL TRADERS
– Percent of Open Interest Longs:29.557.211.4
– Percent of Open Interest Shorts:30.559.97.7
– Net Position:-6,634-18,53325,167
– Gross Longs:198,617384,85776,739
– Gross Shorts:205,251403,39051,572
– Long to Short Ratio:1.0 to 11.0 to 11.5 to 1
NET POSITION TREND:
– Strength Index Score (3 Year Range Pct):33.070.516.1
– Strength Index Reading (3 Year Range):BearishBullishBearish-Extreme
NET POSITION MOVEMENT INDEX:
– 6-Week Change in Strength Index:-0.92.4-9.3


British Pound Sterling Futures:

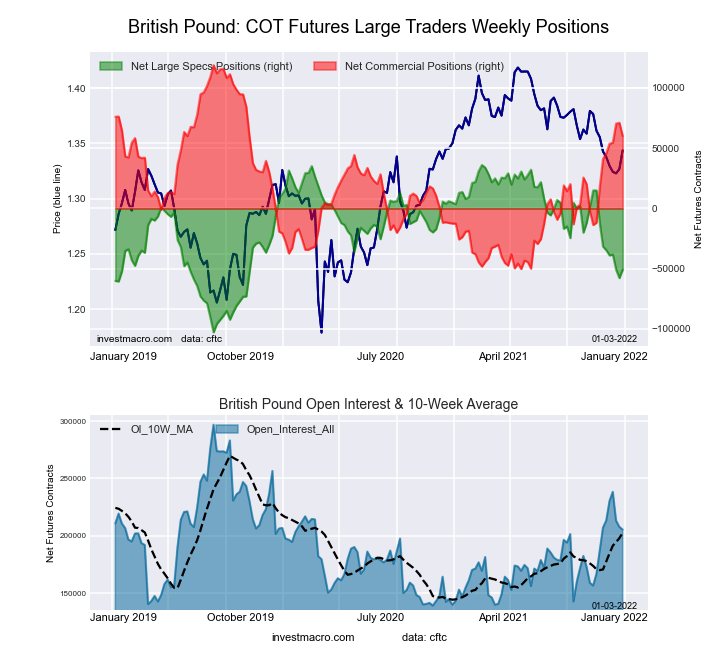
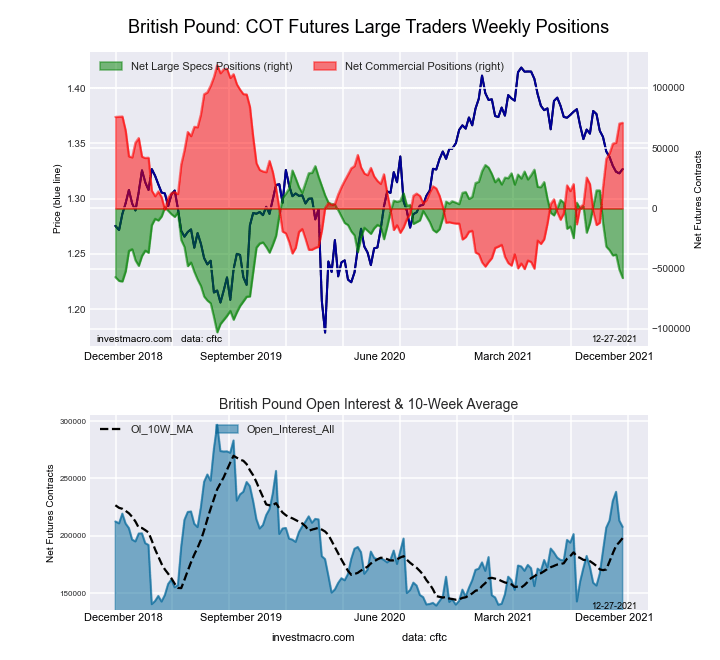
British Pound Sterling Futures COT ChartThe British Pound Sterling large speculator standing this week totaled a net position of -50,719 contracts in the data reported through Tuesday. This was a weekly lift of 6,967 contracts from the previous week which had a total of -57,686 net contracts.

This week’s current strength score (the trader positioning range over the past three years, measured from 0 to 100) shows the speculators are currently Bearish with a score of 37.5 percent. The commercials are Bullish with a score of 65.2 percent and the small traders (not shown in chart) are Bearish with a score of 36.2 percent.

BRITISH POUND StatisticsSPECULATORSCOMMERCIALSSMALL TRADERS
– Percent of Open Interest Longs:11.276.410.8
– Percent of Open Interest Shorts:35.947.115.4
– Net Position:-50,71960,101-9,382
– Gross Longs:23,093156,87522,191
– Gross Shorts:73,81296,77431,573
– Long to Short Ratio:0.3 to 11.6 to 10.7 to 1
NET POSITION TREND:
– Strength Index Score (3 Year Range Pct):37.565.236.2
– Strength Index Reading (3 Year Range):BearishBullishBearish
NET POSITION MOVEMENT INDEX:
– 6-Week Change in Strength Index:-13.811.20.4


Japanese Yen Futures:

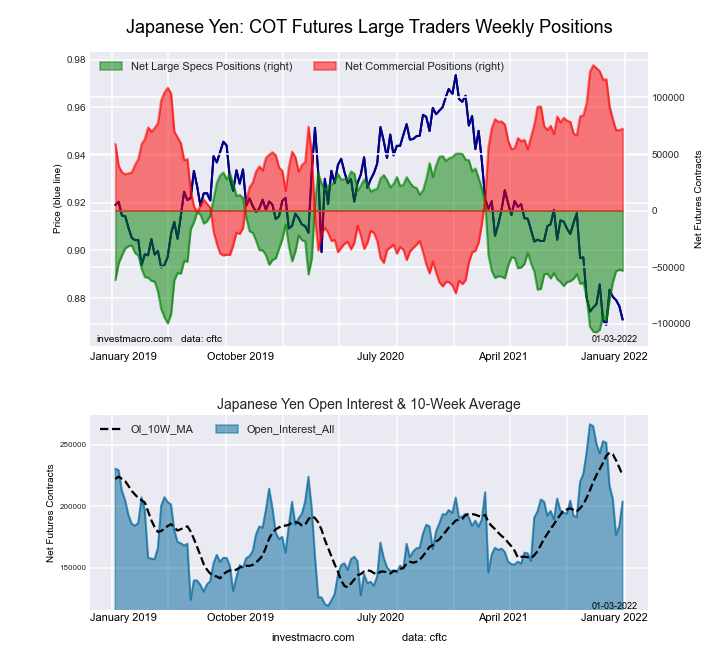
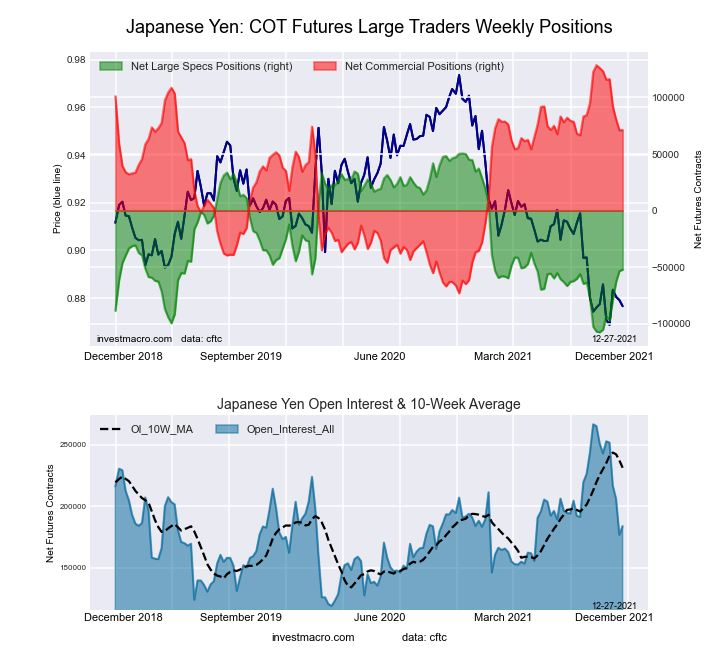
Japanese Yen Forex Futures COT ChartThe Japanese Yen large speculator standing this week totaled a net position of -53,102 contracts in the data reported through Tuesday. This was a weekly fall of -816 contracts from the previous week which had a total of -52,286 net contracts.

This week’s current strength score (the trader positioning range over the past three years, measured from 0 to 100) shows the speculators are currently Bearish with a score of 34.5 percent. The commercials are Bullish with a score of 72.1 percent and the small traders (not shown in chart) are Bearish-Extreme with a score of 8.1 percent.

JAPANESE YEN StatisticsSPECULATORSCOMMERCIALSSMALL TRADERS
– Percent of Open Interest Longs:15.973.98.1
– Percent of Open Interest Shorts:42.038.417.6
– Net Position:-53,10272,364-19,262
– Gross Longs:32,475150,64716,525
– Gross Shorts:85,57778,28335,787
– Long to Short Ratio:0.4 to 11.9 to 10.5 to 1
NET POSITION TREND:
– Strength Index Score (3 Year Range Pct):34.572.18.1
– Strength Index Reading (3 Year Range):BearishBullishBearish-Extreme
NET POSITION MOVEMENT INDEX:
– 6-Week Change in Strength Index:25.3-21.57.3


Swiss Franc Futures:

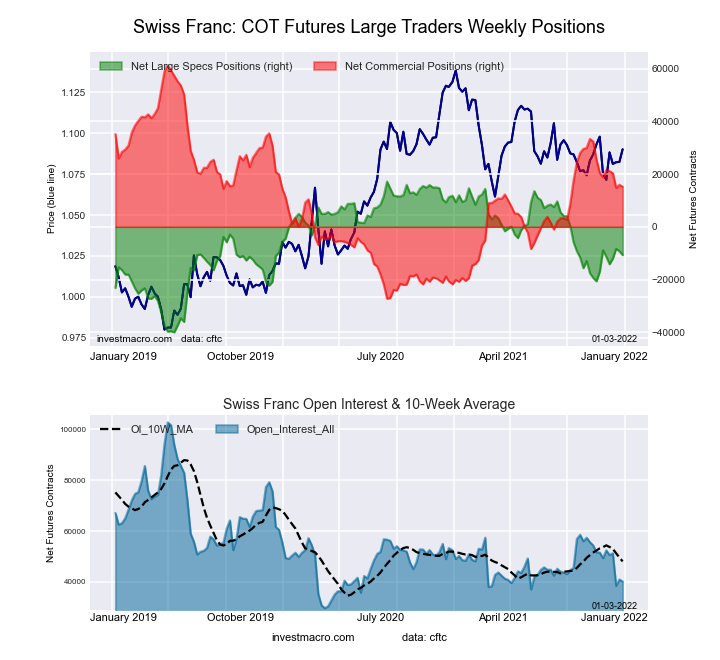
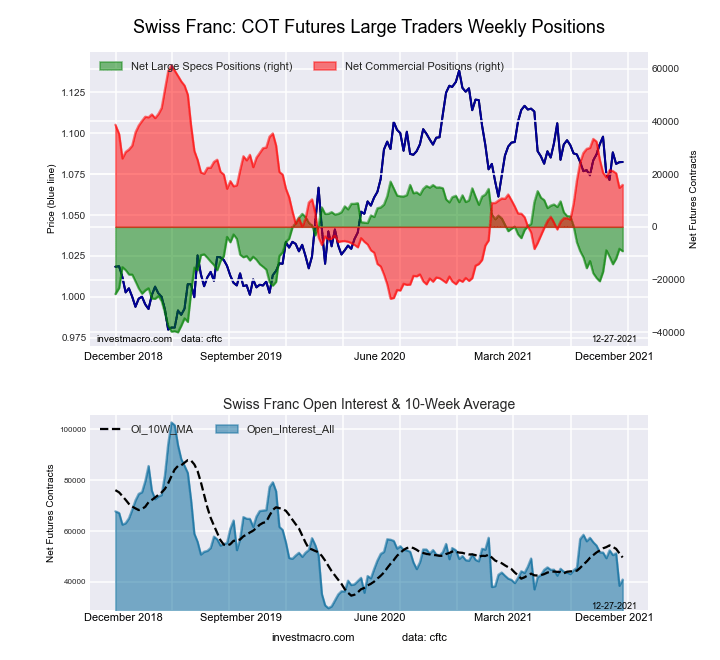
Swiss Franc Forex Futures COT ChartThe Swiss Franc large speculator standing this week totaled a net position of -10,718 contracts in the data reported through Tuesday. This was a weekly reduction of -1,491 contracts from the previous week which had a total of -9,227 net contracts.

This week’s current strength score (the trader positioning range over the past three years, measured from 0 to 100) shows the speculators are currently Bullish with a score of 51.2 percent. The commercials are Bearish with a score of 48.0 percent and the small traders (not shown in chart) are Bullish with a score of 50.0 percent.

SWISS FRANC StatisticsSPECULATORSCOMMERCIALSSMALL TRADERS
– Percent of Open Interest Longs:2.665.531.4
– Percent of Open Interest Shorts:29.327.642.7
– Net Position:-10,71815,226-4,508
– Gross Longs:1,04326,28612,618
– Gross Shorts:11,76111,06017,126
– Long to Short Ratio:0.1 to 12.4 to 10.7 to 1
NET POSITION TREND:
– Strength Index Score (3 Year Range Pct):51.248.050.0
– Strength Index Reading (3 Year Range):BullishBearishBullish
NET POSITION MOVEMENT INDEX:
– 6-Week Change in Strength Index:-3.2-4.015.7


Canadian Dollar Futures:

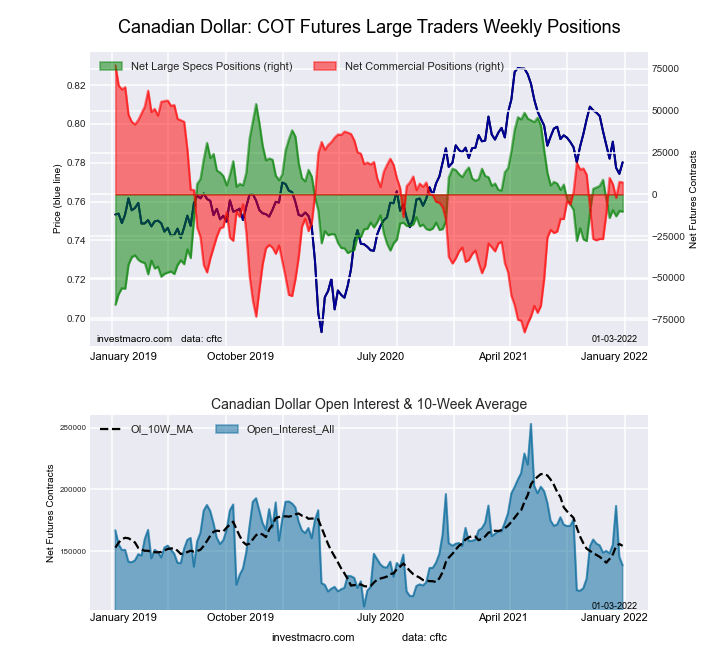
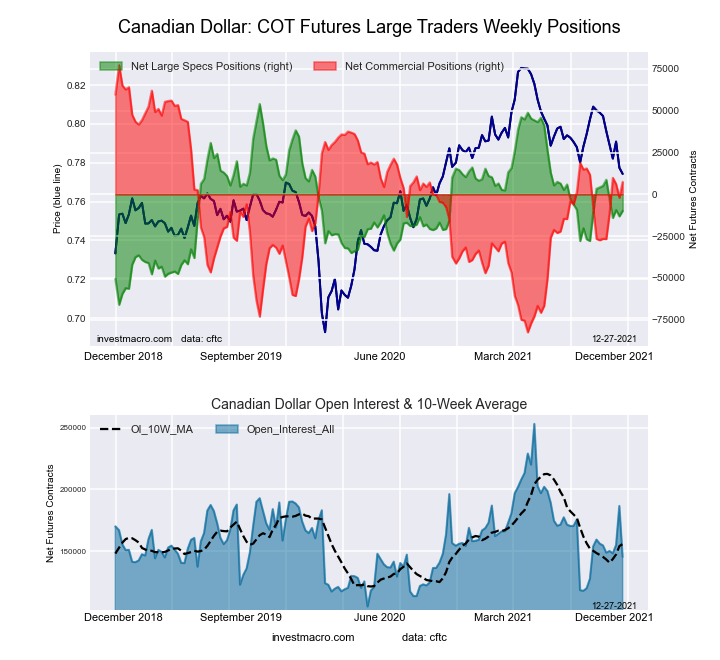
Canadian Dollar Forex Futures COT ChartThe Canadian Dollar large speculator standing this week totaled a net position of -10,334 contracts in the data reported through Tuesday. This was a weekly reduction of -457 contracts from the previous week which had a total of -9,877 net contracts.

This week’s current strength score (the trader positioning range over the past three years, measured from 0 to 100) shows the speculators are currently Bearish with a score of 46.4 percent. The commercials are Bullish with a score of 56.1 percent and the small traders (not shown in chart) are Bearish with a score of 36.1 percent.

CANADIAN DOLLAR StatisticsSPECULATORSCOMMERCIALSSMALL TRADERS
– Percent of Open Interest Longs:30.745.221.6
– Percent of Open Interest Shorts:38.140.119.3
– Net Position:-10,3347,1673,167
– Gross Longs:42,52862,71729,912
– Gross Shorts:52,86255,55026,745
– Long to Short Ratio:0.8 to 11.1 to 11.1 to 1
NET POSITION TREND:
– Strength Index Score (3 Year Range Pct):46.456.136.1
– Strength Index Reading (3 Year Range):BearishBullishBearish
NET POSITION MOVEMENT INDEX:
– 6-Week Change in Strength Index:-15.921.2-29.5


Australian Dollar Futures:

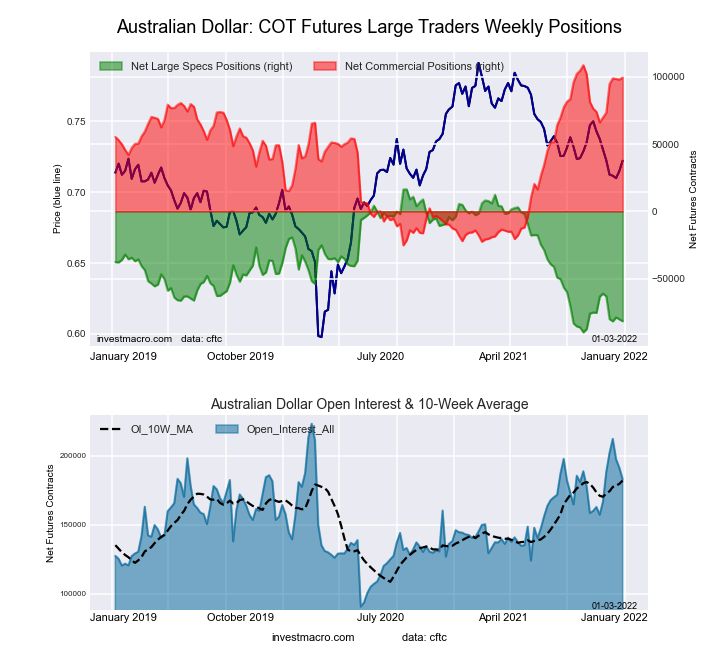
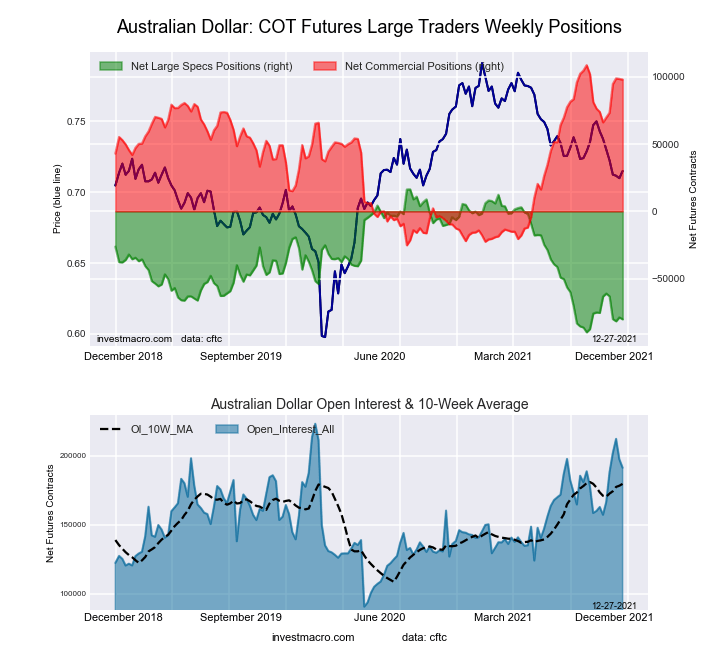
Australian Dollar Forex Futures COT ChartThe Australian Dollar large speculator standing this week totaled a net position of -81,741 contracts in the data reported through Tuesday. This was a weekly decline of -1,387 contracts from the previous week which had a total of -80,354 net contracts.

This week’s current strength score (the trader positioning range over the past three years, measured from 0 to 100) shows the speculators are currently Bearish-Extreme with a score of 7.7 percent. The commercials are Bullish-Extreme with a score of 93.1 percent and the small traders (not shown in chart) are Bearish-Extreme with a score of 9.2 percent.

AUSTRALIAN DOLLAR StatisticsSPECULATORSCOMMERCIALSSMALL TRADERS
– Percent of Open Interest Longs:9.279.99.2
– Percent of Open Interest Shorts:53.825.518.8
– Net Position:-81,74199,476-17,735
– Gross Longs:16,885146,26616,785
– Gross Shorts:98,62646,79034,520
– Long to Short Ratio:0.2 to 13.1 to 10.5 to 1
NET POSITION TREND:
– Strength Index Score (3 Year Range Pct):7.793.19.2
– Strength Index Reading (3 Year Range):Bearish-ExtremeBullish-ExtremeBearish-Extreme
NET POSITION MOVEMENT INDEX:
– 6-Week Change in Strength Index:-19.422.1-22.0


New Zealand Dollar Futures:

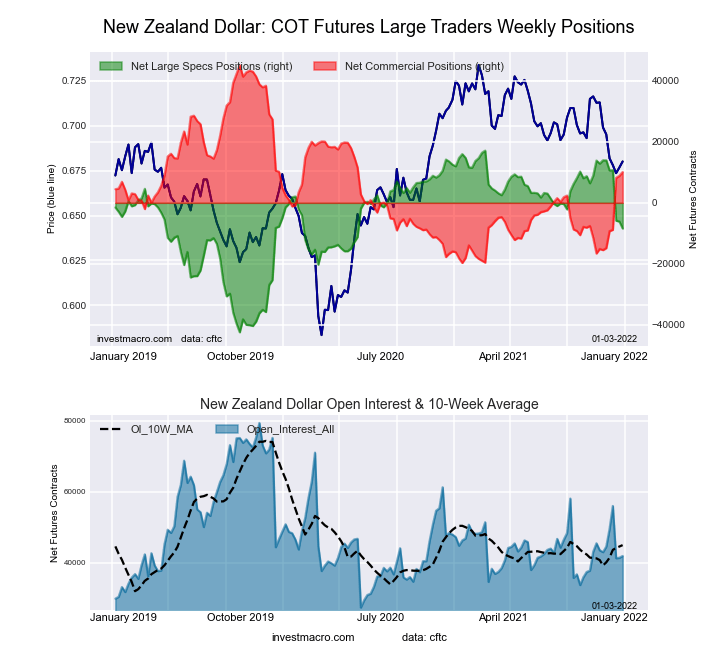
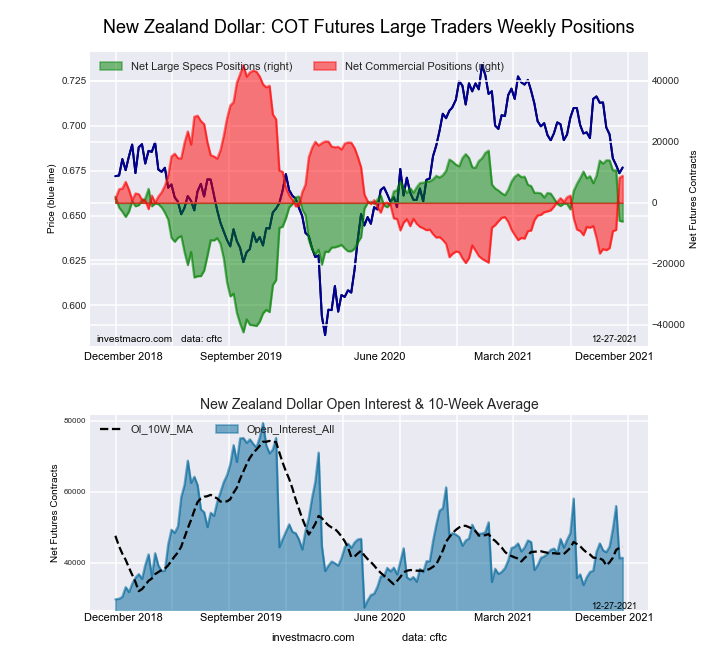
New Zealand Dollar Forex Futures COT ChartThe New Zealand Dollar large speculator standing this week totaled a net position of -8,421 contracts in the data reported through Tuesday. This was a weekly decrease of -2,285 contracts from the previous week which had a total of -6,136 net contracts.

This week’s current strength score (the trader positioning range over the past three years, measured from 0 to 100) shows the speculators are currently Bullish with a score of 57.1 percent. The commercials are Bearish with a score of 46.0 percent and the small traders (not shown in chart) are Bearish with a score of 32.6 percent.

NEW ZEALAND DOLLAR StatisticsSPECULATORSCOMMERCIALSSMALL TRADERS
– Percent of Open Interest Longs:26.864.77.2
– Percent of Open Interest Shorts:46.940.611.2
– Net Position:-8,42110,100-1,679
– Gross Longs:11,23127,0973,025
– Gross Shorts:19,65216,9974,704
– Long to Short Ratio:0.6 to 11.6 to 10.6 to 1
NET POSITION TREND:
– Strength Index Score (3 Year Range Pct):57.146.032.6
– Strength Index Reading (3 Year Range):BullishBearishBearish
NET POSITION MOVEMENT INDEX:
– 6-Week Change in Strength Index:-37.639.5-37.0


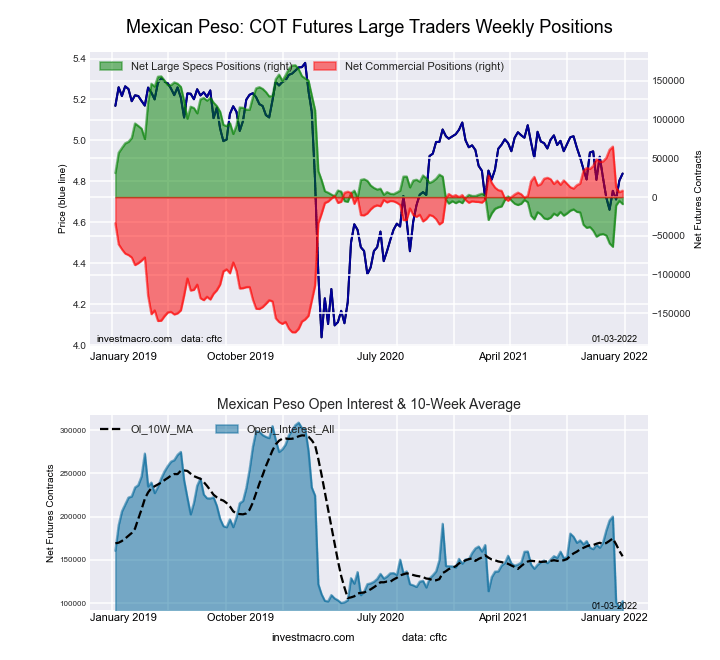
Mexican Peso Futures:

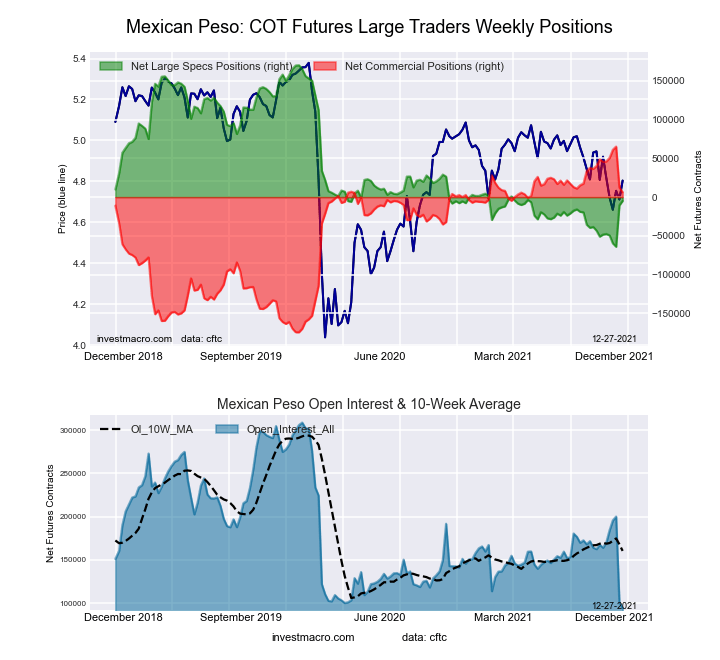
Mexican Peso Futures COT ChartThe Mexican Peso large speculator standing this week totaled a net position of -9,008 contracts in the data reported through Tuesday. This was a weekly decline of -4,216 contracts from the previous week which had a total of -4,792 net contracts.

This week’s current strength score (the trader positioning range over the past three years, measured from 0 to 100) shows the speculators are currently Bearish with a score of 23.5 percent. The commercials are Bullish with a score of 76.3 percent and the small traders (not shown in chart) are Bearish with a score of 45.9 percent.

MEXICAN PESO StatisticsSPECULATORSCOMMERCIALSSMALL TRADERS
– Percent of Open Interest Longs:32.862.04.7
– Percent of Open Interest Shorts:41.653.94.0
– Net Position:-9,0088,334674
– Gross Longs:33,56163,5294,815
– Gross Shorts:42,56955,1954,141
– Long to Short Ratio:0.8 to 11.2 to 11.2 to 1
NET POSITION TREND:
– Strength Index Score (3 Year Range Pct):23.576.345.9
– Strength Index Reading (3 Year Range):BearishBullishBearish
NET POSITION MOVEMENT INDEX:
– 6-Week Change in Strength Index:16.5-15.8-3.6


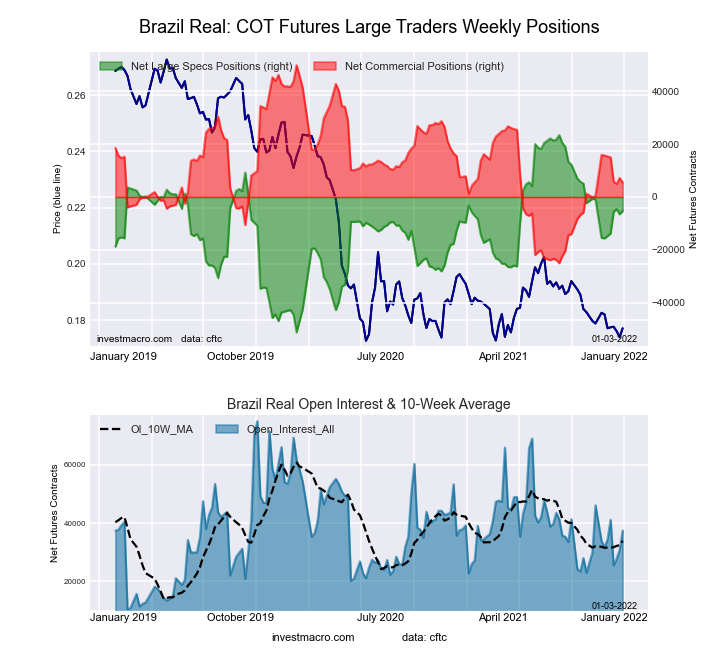
Brazilian Real Futures:

Brazil Real Futures COT ChartThe Brazilian Real large speculator standing this week totaled a net position of -5,286 contracts in the data reported through Tuesday. This was a weekly boost of 1,261 contracts from the previous week which had a total of -6,547 net contracts.

This week’s current strength score (the trader positioning range over the past three years, measured from 0 to 100) shows the speculators are currently Bullish with a score of 61.5 percent. The commercials are Bearish with a score of 40.7 percent and the small traders (not shown in chart) are Bullish with a score of 64.3 percent.

BRAZIL REAL StatisticsSPECULATORSCOMMERCIALSSMALL TRADERS
– Percent of Open Interest Longs:37.454.06.8
– Percent of Open Interest Shorts:51.539.37.4
– Net Position:-5,2865,493-207
– Gross Longs:13,97320,2032,542
– Gross Shorts:19,25914,7102,749
– Long to Short Ratio:0.7 to 11.4 to 10.9 to 1
NET POSITION TREND:
– Strength Index Score (3 Year Range Pct):61.540.764.3
– Strength Index Reading (3 Year Range):BullishBearishBullish
NET POSITION MOVEMENT INDEX:
– 6-Week Change in Strength Index:13.9-13.7-2.0


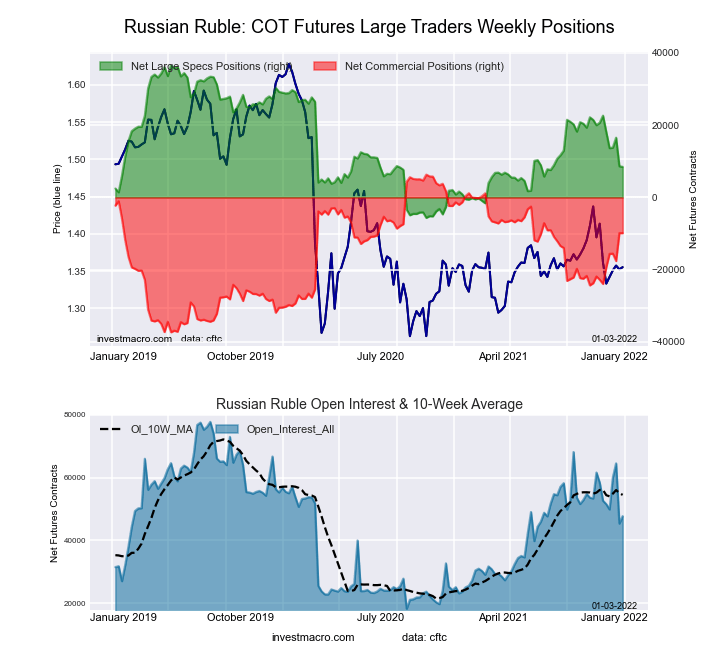
Russian Ruble Futures:

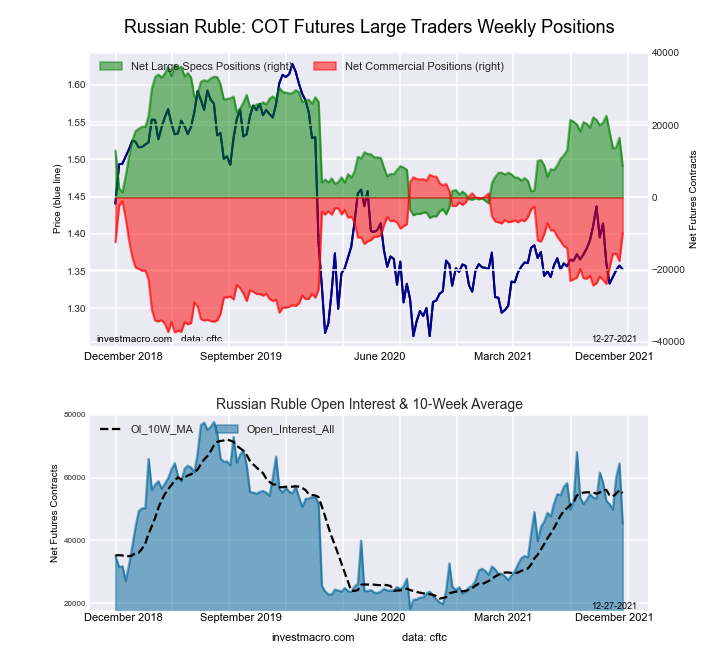
Russian Ruble Futures COT ChartThe Russian Ruble large speculator standing this week totaled a net position of 8,464 contracts in the data reported through Tuesday. This was a weekly decrease of -157 contracts from the previous week which had a total of 8,621 net contracts.

This week’s current strength score (the trader positioning range over the past three years, measured from 0 to 100) shows the speculators are currently Bearish with a score of 33.4 percent. The commercials are Bullish with a score of 62.9 percent and the small traders (not shown in chart) are Bullish with a score of 73.2 percent.

RUSSIAN RUBLE StatisticsSPECULATORSCOMMERCIALSSMALL TRADERS
– Percent of Open Interest Longs:43.951.44.7
– Percent of Open Interest Shorts:26.272.11.7
– Net Position:8,464-9,8861,422
– Gross Longs:20,95324,5452,228
– Gross Shorts:12,48934,431806
– Long to Short Ratio:1.7 to 10.7 to 12.8 to 1
NET POSITION TREND:
– Strength Index Score (3 Year Range Pct):33.462.973.2
– Strength Index Reading (3 Year Range):BearishBullishBullish
NET POSITION MOVEMENT INDEX:
– 6-Week Change in Strength Index:-33.532.23.0


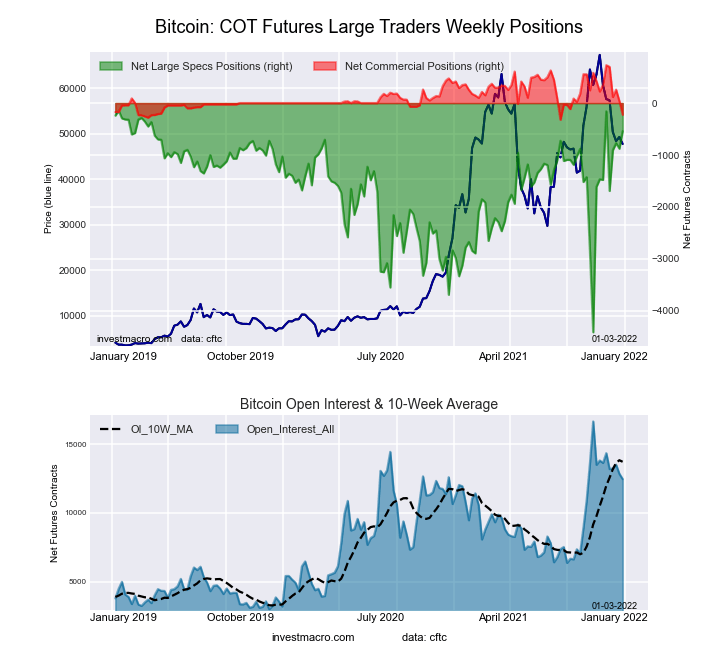
Bitcoin Futures:

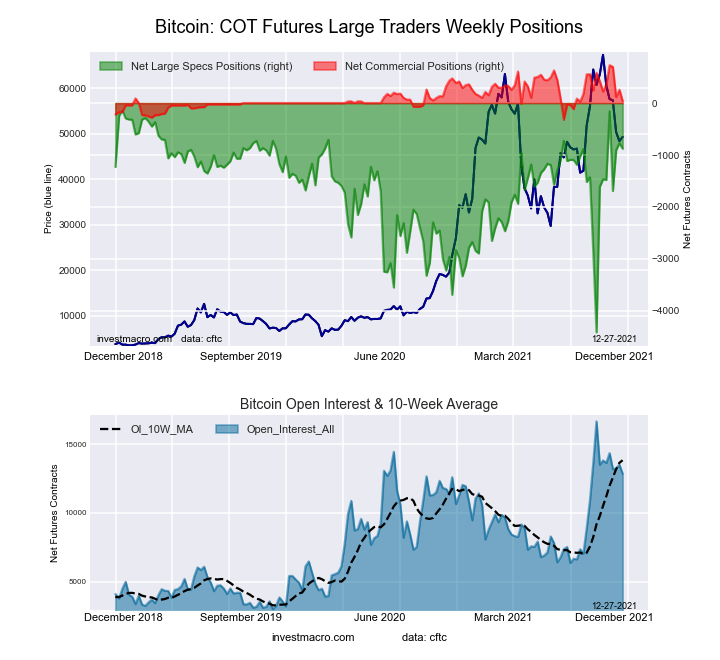
Bitcoin Crypto Futures COT ChartThe Bitcoin large speculator standing this week totaled a net position of -542 contracts in the data reported through Tuesday. This was a weekly lift of 336 contracts from the previous week which had a total of -878 net contracts.

This week’s current strength score (the trader positioning range over the past three years, measured from 0 to 100) shows the speculators are currently Bullish-Extreme with a score of 90.6 percent. The commercials are Bearish-Extreme with a score of 9.2 percent and the small traders (not shown in chart) are Bearish with a score of 30.4 percent.

BITCOIN StatisticsSPECULATORSCOMMERCIALSSMALL TRADERS
– Percent of Open Interest Longs:70.03.512.9
– Percent of Open Interest Shorts:74.45.36.7
– Net Position:-542-224766
– Gross Longs:8,7294341,606
– Gross Shorts:9,271658840
– Long to Short Ratio:0.9 to 10.7 to 11.9 to 1
NET POSITION TREND:
– Strength Index Score (3 Year Range Pct):90.69.230.4
– Strength Index Reading (3 Year Range):Bullish-ExtremeBearish-ExtremeBearish
NET POSITION MOVEMENT INDEX:
– 6-Week Change in Strength Index:21.9-55.3-8.1


Article By InvestMacroReceive our weekly COT Reports by Email

*COT Report: The COT data, released weekly to the public each Friday, is updated through the most recent Tuesday (data is 3 days old) and shows a quick view of how large speculators or non-commercials (for-profit traders) were positioned in the futures markets.

The CFTC categorizes trader positions according to commercial hedgers (traders who use futures contracts for hedging as part of the business), non-commercials (large traders who speculate to realize trading profits) and nonreportable traders (usually small traders/speculators) as well as their open interest (contracts open in the market at time of reporting).See CFTC criteria here.

COT Bonds Speculators push 10-Year Treasury bets higher after 97-week low

By InvestMacro | COT | Data Tables | COT Leaders | Downloads | COT Newsletter

Here are the latest charts and statistics for the Commitment of Traders (COT) data published by the Commodities Futures Trading Commission (CFTC). The latest release was delayed by the CFTC due to the New Year’s holiday.

The latest COT data is updated through Tuesday December 28th 2021 and shows a quick view of how large traders (for-profit speculators and commercial entities) were positioned in the futures markets.

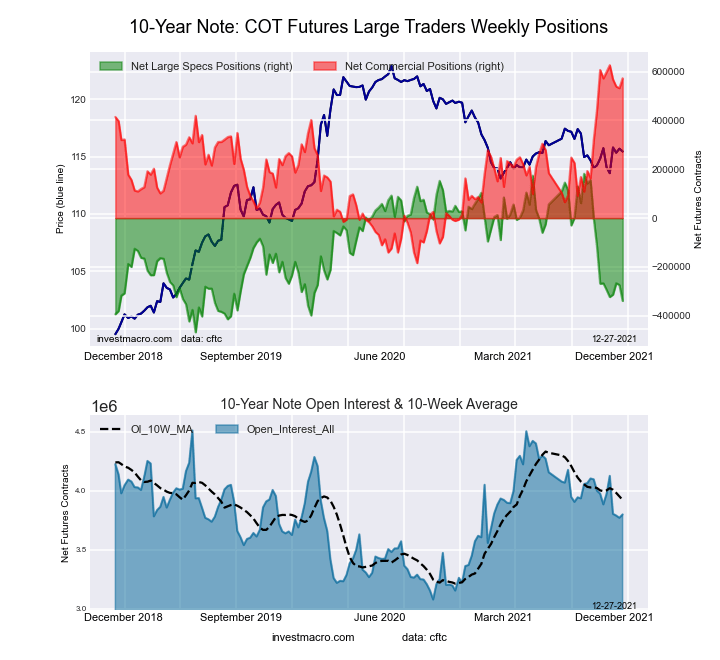
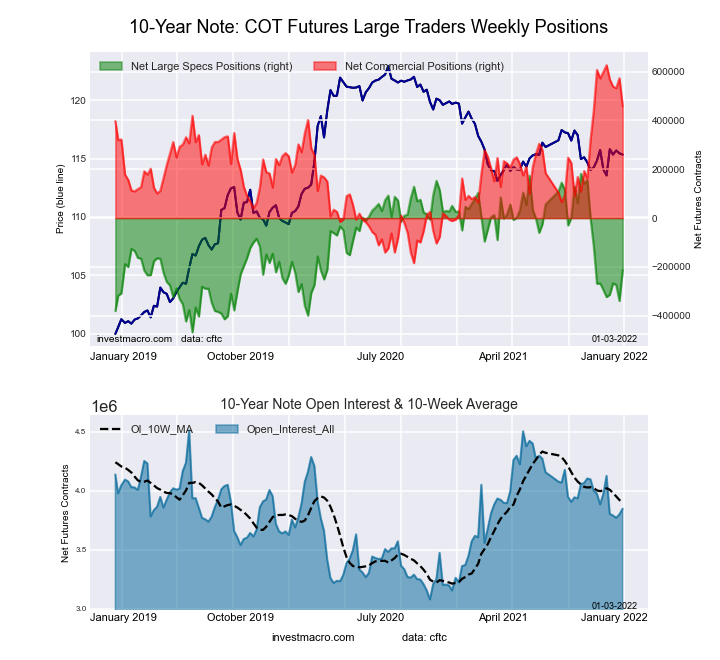
Highlighting the COT bonds data is the jump in bets for the 10-Year Bond. Speculators sharply boosted their 10-Year bets by the largest one-week amount (+125,989) of the past fifteen weeks on December 28th. This rebound strongly trimmed the overall bearish level after it had hit a 97-week bearish high on December 21st at -339,299 contracts. The 10-Year speculator standing has been in bearish territory now for eleven consecutive weeks, dating back to October 19th.

Joining the 10-Year (125,989 contracts) with gains on the week were the 2-Year Bond (8,471 contracts), Ultra 10-Year (2,904 contracts), Long US Bond (16,129 contracts) and the 5-Year (47,689 contracts) while decreasing bets for the week were seen in the Eurodollar (-13,028 contracts), FedFunds (-3,900 contracts) and the Ultra US Bond (-3,156 contracts).


Data Snapshot of Bond Market Traders | Columns Legend
Dec-28-2021OIOI-IndexSpec-NetSpec-IndexCom-NetCOM-IndexSmalls-NetSmalls-Index
Eurodollar11,150,59348-1,827,84802,203,302100-375,45431
FedFunds1,366,90028-93,32928107,47873-14,14927
2-Year1,966,290787,804100-25,76514-62,0395
Long T-Bond1,208,00050-19,95586-10,6541730,60977
10-Year3,846,38254-213,31039458,47979-245,16922
5-Year3,741,32734-298,68728543,54287-244,85514


3-Month Eurodollars Futures:

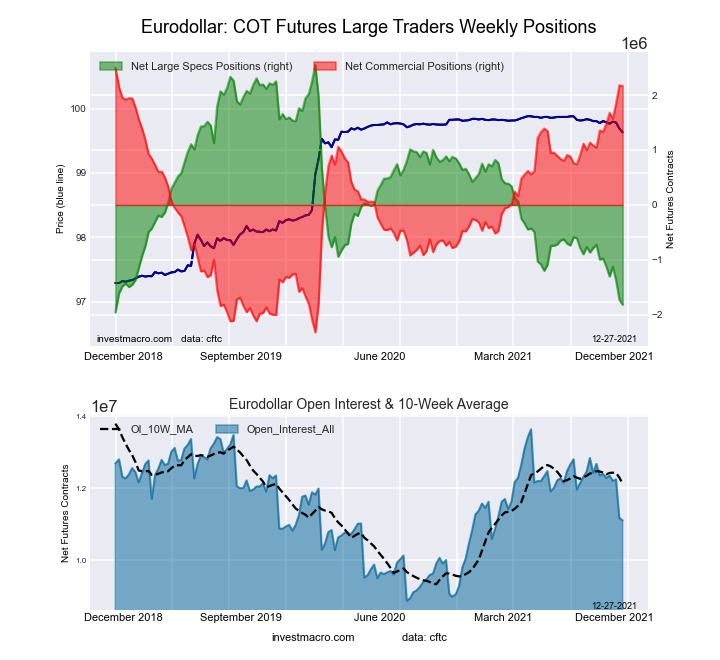
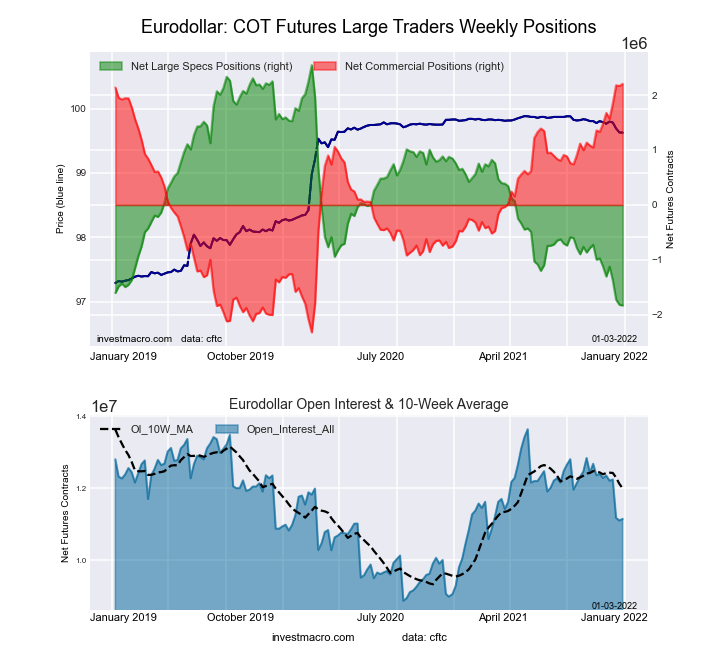
Eurodollar Bonds Futures COT ChartThe 3-Month Eurodollars large speculator standing this week recorded a net position of -1,827,848 contracts in the data reported through Tuesday. This was a weekly lowering of -13,028 contracts from the previous week which had a total of -1,814,820 net contracts.

This week’s current strength score (the trader positioning range over the past three years, measured from 0 to 100) shows the speculators are currently Bearish-Extreme with a score of 0.0 percent. The commercials are Bullish-Extreme with a score of 100.0 percent and the small traders (not shown in chart) are Bearish with a score of 31.1 percent.

3-Month Eurodollars StatisticsSPECULATORSCOMMERCIALSSMALL TRADERS
– Percent of Open Interest Longs:7.771.93.9
– Percent of Open Interest Shorts:24.152.17.3
– Net Position:-1,827,8482,203,302-375,454
– Gross Longs:854,9638,015,395436,619
– Gross Shorts:2,682,8115,812,093812,073
– Long to Short Ratio:0.3 to 11.4 to 10.5 to 1
NET POSITION TREND:
– Strength Index Score (3 Year Range Pct):0.0100.031.1
– Strength Index Reading (3 Year Range):Bearish-ExtremeBullish-ExtremeBearish
NET POSITION MOVEMENT INDEX:
– 6-Week Change in Strength Index:-16.216.1-3.4


30-Day Federal Funds Futures:

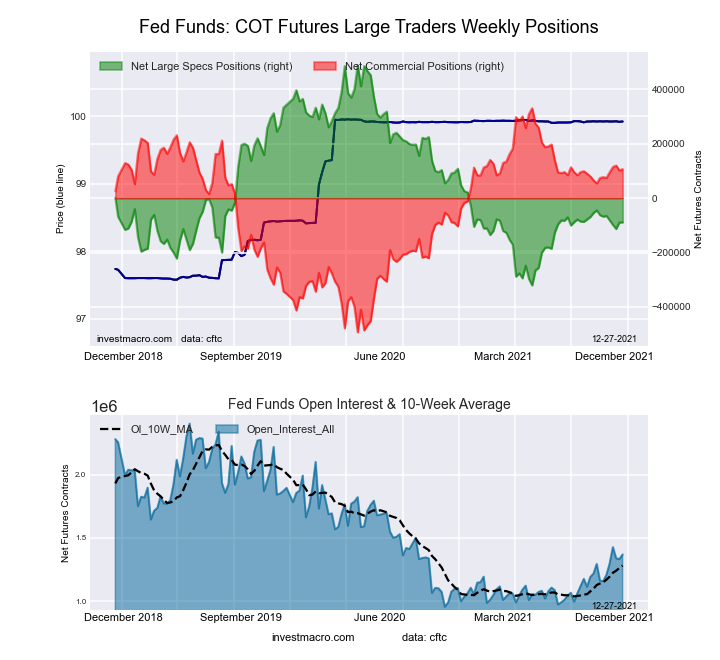
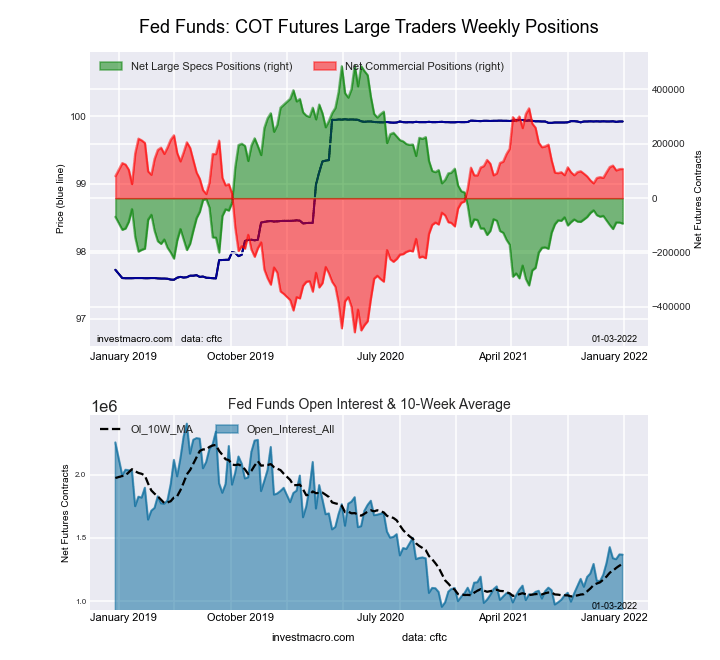
Federal Funds 30-Day Bonds Futures COT ChartThe 30-Day Federal Funds large speculator standing this week recorded a net position of -93,329 contracts in the data reported through Tuesday. This was a weekly decline of -3,900 contracts from the previous week which had a total of -89,429 net contracts.

This week’s current strength score (the trader positioning range over the past three years, measured from 0 to 100) shows the speculators are currently Bearish with a score of 28.1 percent. The commercials are Bullish with a score of 72.9 percent and the small traders (not shown in chart) are Bearish with a score of 26.6 percent.

30-Day Federal Funds StatisticsSPECULATORSCOMMERCIALSSMALL TRADERS
– Percent of Open Interest Longs:3.083.01.7
– Percent of Open Interest Shorts:9.875.22.8
– Net Position:-93,329107,478-14,149
– Gross Longs:41,0571,135,00723,529
– Gross Shorts:134,3861,027,52937,678
– Long to Short Ratio:0.3 to 11.1 to 10.6 to 1
NET POSITION TREND:
– Strength Index Score (3 Year Range Pct):28.172.926.6
– Strength Index Reading (3 Year Range):BearishBullishBearish
NET POSITION MOVEMENT INDEX:
– 6-Week Change in Strength Index:-3.54.0-11.1


2-Year Treasury Note Futures:

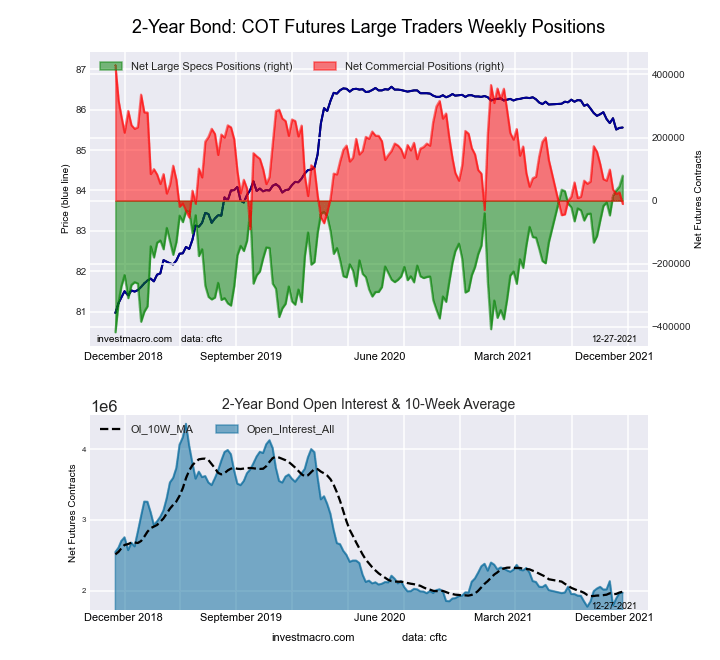
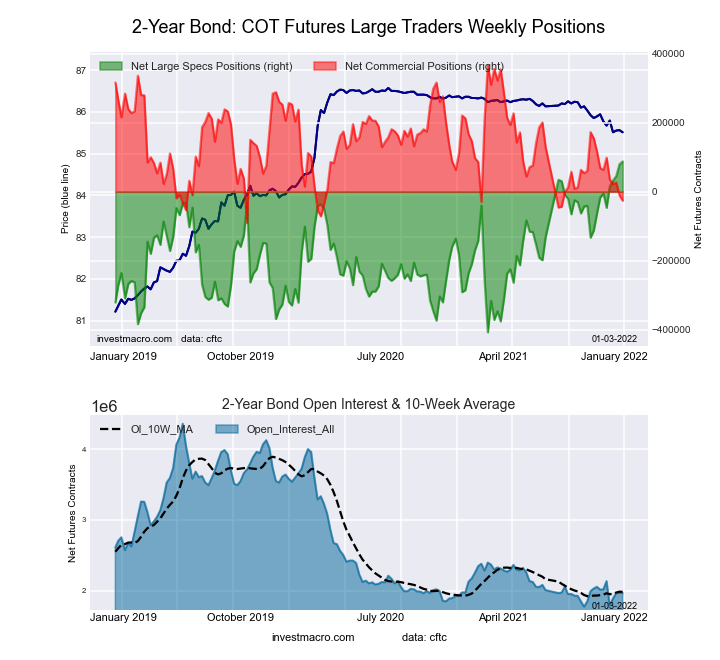
2-Year Treasury Bonds Futures COT ChartThe 2-Year Treasury Note large speculator standing this week recorded a net position of 87,804 contracts in the data reported through Tuesday. This was a weekly rise of 8,471 contracts from the previous week which had a total of 79,333 net contracts.

This week’s current strength score (the trader positioning range over the past three years, measured from 0 to 100) shows the speculators are currently Bullish-Extreme with a score of 100.0 percent. The commercials are Bearish-Extreme with a score of 14.2 percent and the small traders (not shown in chart) are Bearish-Extreme with a score of 5.0 percent.

2-Year Treasury Note StatisticsSPECULATORSCOMMERCIALSSMALL TRADERS
– Percent of Open Interest Longs:21.567.06.3
– Percent of Open Interest Shorts:17.168.39.4
– Net Position:87,804-25,765-62,039
– Gross Longs:423,5301,316,762122,956
– Gross Shorts:335,7261,342,527184,995
– Long to Short Ratio:1.3 to 11.0 to 10.7 to 1
NET POSITION TREND:
– Strength Index Score (3 Year Range Pct):100.014.25.0
– Strength Index Reading (3 Year Range):Bullish-ExtremeBearish-ExtremeBearish-Extreme
NET POSITION MOVEMENT INDEX:
– 6-Week Change in Strength Index:18.8-19.5-2.0


5-Year Treasury Note Futures:

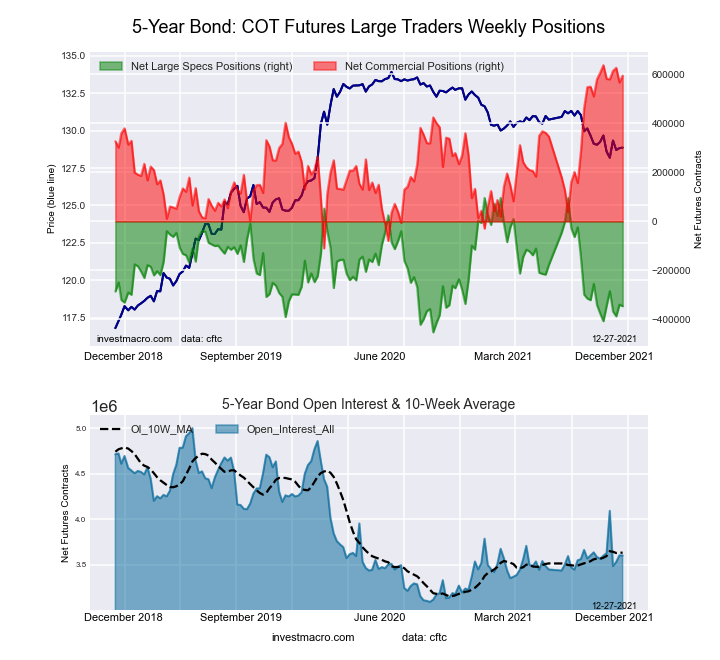
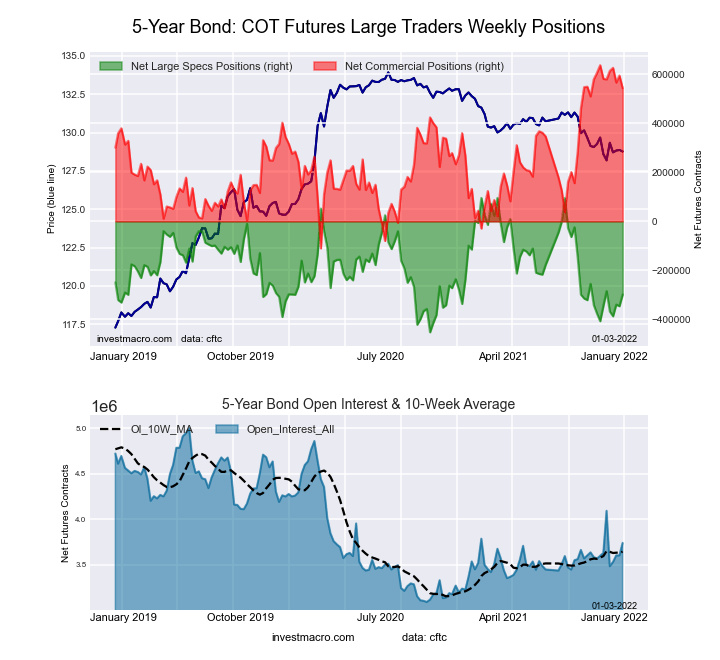
5-Year Treasury Bonds Futures COT ChartThe 5-Year Treasury Note large speculator standing this week recorded a net position of -298,687 contracts in the data reported through Tuesday. This was a weekly boost of 47,689 contracts from the previous week which had a total of -346,376 net contracts.

This week’s current strength score (the trader positioning range over the past three years, measured from 0 to 100) shows the speculators are currently Bearish with a score of 28.1 percent. The commercials are Bullish-Extreme with a score of 87.4 percent and the small traders (not shown in chart) are Bearish-Extreme with a score of 13.8 percent.

5-Year Treasury Note StatisticsSPECULATORSCOMMERCIALSSMALL TRADERS
– Percent of Open Interest Longs:9.680.36.9
– Percent of Open Interest Shorts:17.665.813.5
– Net Position:-298,687543,542-244,855
– Gross Longs:358,1053,006,091259,112
– Gross Shorts:656,7922,462,549503,967
– Long to Short Ratio:0.5 to 11.2 to 10.5 to 1
NET POSITION TREND:
– Strength Index Score (3 Year Range Pct):28.187.413.8
– Strength Index Reading (3 Year Range):BearishBullish-ExtremeBearish-Extreme
NET POSITION MOVEMENT INDEX:
– 6-Week Change in Strength Index:8.4-5.1-2.0


10-Year Treasury Note Futures:

10-Year Treasury Notes Bonds Futures COT ChartThe 10-Year Treasury Note large speculator standing this week recorded a net position of -213,310 contracts in the data reported through Tuesday. This was a weekly boost of 125,989 contracts from the previous week which had a total of -339,299 net contracts.

This week’s current strength score (the trader positioning range over the past three years, measured from 0 to 100) shows the speculators are currently Bearish with a score of 39.2 percent. The commercials are Bullish with a score of 79.3 percent and the small traders (not shown in chart) are Bearish with a score of 21.6 percent.

10-Year Treasury Note StatisticsSPECULATORSCOMMERCIALSSMALL TRADERS
– Percent of Open Interest Longs:14.275.87.6
– Percent of Open Interest Shorts:19.763.814.0
– Net Position:-213,310458,479-245,169
– Gross Longs:545,3372,913,736291,916
– Gross Shorts:758,6472,455,257537,085
– Long to Short Ratio:0.7 to 11.2 to 10.5 to 1
NET POSITION TREND:
– Strength Index Score (3 Year Range Pct):39.279.321.6
– Strength Index Reading (3 Year Range):BearishBullishBearish
NET POSITION MOVEMENT INDEX:
– 6-Week Change in Strength Index:12.5-17.313.8


Ultra 10-Year Notes Futures:

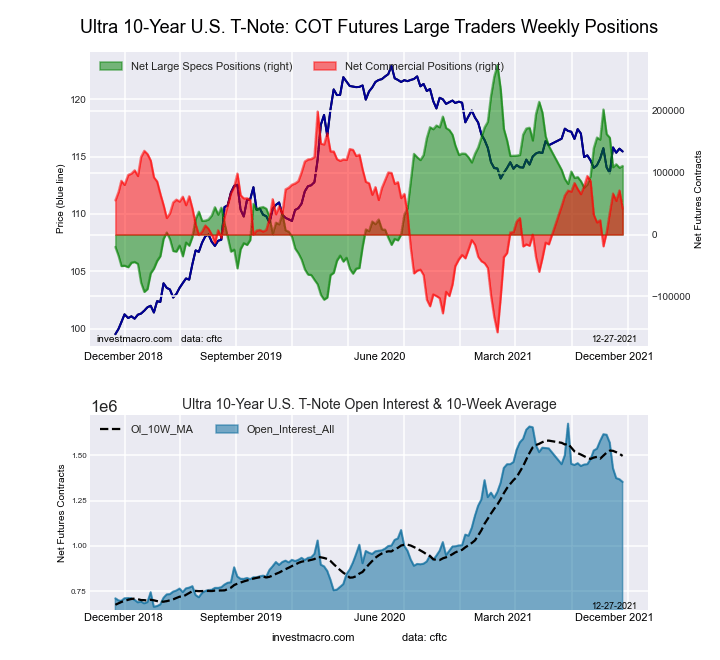
Ultra 10-Year Treasury Notes Bonds Futures COT ChartThe Ultra 10-Year Notes large speculator standing this week recorded a net position of 113,816 contracts in the data reported through Tuesday. This was a weekly lift of 2,904 contracts from the previous week which had a total of 110,912 net contracts.

This week’s current strength score (the trader positioning range over the past three years, measured from 0 to 100) shows the speculators are currently Bullish with a score of 57.8 percent. The commercials are Bullish with a score of 54.6 percent and the small traders (not shown in chart) are Bearish with a score of 24.8 percent.

Ultra 10-Year Notes StatisticsSPECULATORSCOMMERCIALSSMALL TRADERS
– Percent of Open Interest Longs:20.170.28.7
– Percent of Open Interest Shorts:11.767.519.7
– Net Position:113,81636,873-150,689
– Gross Longs:274,231959,273119,235
– Gross Shorts:160,415922,400269,924
– Long to Short Ratio:1.7 to 11.0 to 10.4 to 1
NET POSITION TREND:
– Strength Index Score (3 Year Range Pct):57.854.624.8
– Strength Index Reading (3 Year Range):BullishBullishBearish
NET POSITION MOVEMENT INDEX:
– 6-Week Change in Strength Index:-12.89.49.1


US Treasury Bonds Futures:

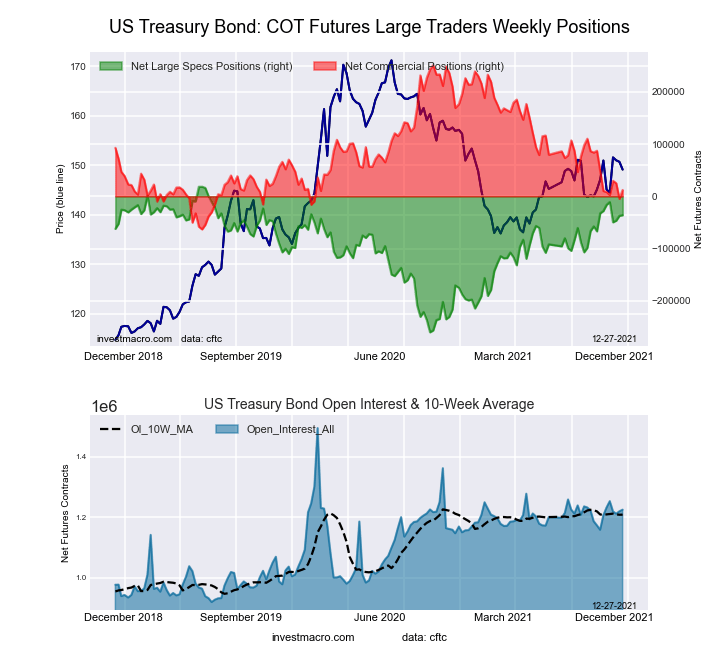
US Year Treasury Notes Long Bonds Futures COT ChartThe US Treasury Bonds large speculator standing this week recorded a net position of -19,955 contracts in the data reported through Tuesday. This was a weekly gain of 16,129 contracts from the previous week which had a total of -36,084 net contracts.

This week’s current strength score (the trader positioning range over the past three years, measured from 0 to 100) shows the speculators are currently Bullish-Extreme with a score of 86.3 percent. The commercials are Bearish-Extreme with a score of 16.7 percent and the small traders (not shown in chart) are Bullish with a score of 76.9 percent.

US Treasury Bonds StatisticsSPECULATORSCOMMERCIALSSMALL TRADERS
– Percent of Open Interest Longs:12.970.415.3
– Percent of Open Interest Shorts:14.571.312.8
– Net Position:-19,955-10,65430,609
– Gross Longs:155,753850,571185,407
– Gross Shorts:175,708861,225154,798
– Long to Short Ratio:0.9 to 11.0 to 11.2 to 1
NET POSITION TREND:
– Strength Index Score (3 Year Range Pct):86.316.776.9
– Strength Index Reading (3 Year Range):Bullish-ExtremeBearish-ExtremeBullish
NET POSITION MOVEMENT INDEX:
– 6-Week Change in Strength Index:-1.3-6.017.9


Ultra US Treasury Bonds Futures:

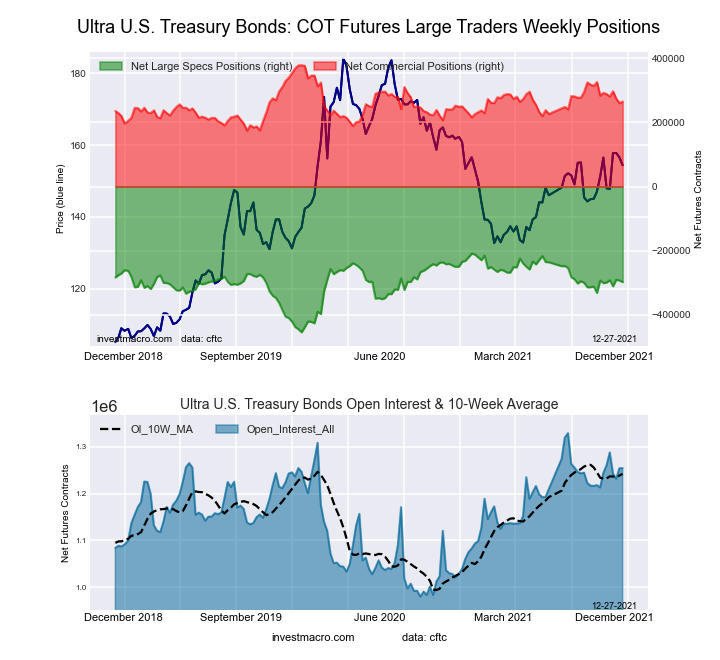
Ultra US Year Treasury Notes Long Bonds Futures COT ChartThe Ultra US Treasury Bonds large speculator standing this week recorded a net position of -300,717 contracts in the data reported through Tuesday. This was a weekly decrease of -3,156 contracts from the previous week which had a total of -297,561 net contracts.

This week’s current strength score (the trader positioning range over the past three years, measured from 0 to 100) shows the speculators are currently Bullish with a score of 62.5 percent. The commercials are Bearish with a score of 44.3 percent and the small traders (not shown in chart) are Bullish with a score of 54.3 percent.

Ultra US Treasury Bonds StatisticsSPECULATORSCOMMERCIALSSMALL TRADERS
– Percent of Open Interest Longs:6.680.112.8
– Percent of Open Interest Shorts:30.758.99.9
– Net Position:-300,717264,41236,305
– Gross Longs:82,877999,528159,612
– Gross Shorts:383,594735,116123,307
– Long to Short Ratio:0.2 to 11.4 to 11.3 to 1
NET POSITION TREND:
– Strength Index Score (3 Year Range Pct):62.544.354.3
– Strength Index Reading (3 Year Range):BullishBearishBullish
NET POSITION MOVEMENT INDEX:
– 6-Week Change in Strength Index:-0.8-11.618.3


Article By InvestMacroReceive our weekly COT Reports by Email

*COT Report: The COT data, released weekly to the public each Friday, is updated through the most recent Tuesday (data is 3 days old) and shows a quick view of how large speculators or non-commercials (for-profit traders) were positioned in the futures markets.

The CFTC categorizes trader positions according to commercial hedgers (traders who use futures contracts for hedging as part of the business), non-commercials (large traders who speculate to realize trading profits) and nonreportable traders (usually small traders/speculators) as well as their open interest (contracts open in the market at time of reporting).See CFTC criteria here.
COT Metals Speculators raised their Copper bullish bets for 1st time in 10 weeks

By InvestMacro | COT | Data Tables | COT Leaders | Downloads | COT Newsletter

Here are the latest charts and statistics for the Commitment of Traders (COT) data published by the Commodities Futures Trading Commission (CFTC). The latest release was delayed by the CFTC due to the New Year’s holiday.

The latest COT data is updated through Tuesday December 28th 2021 and shows a quick view of how large traders (for-profit speculators and commercial entities) were positioned in the futures markets.

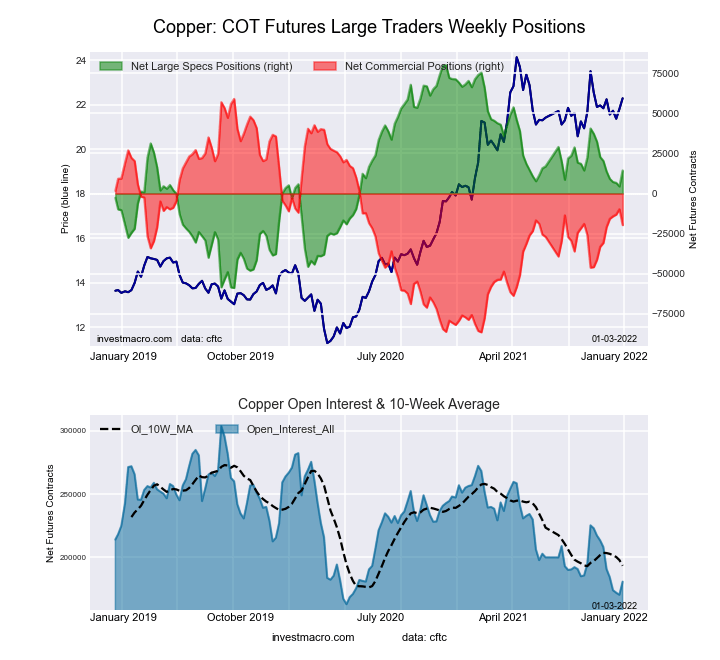
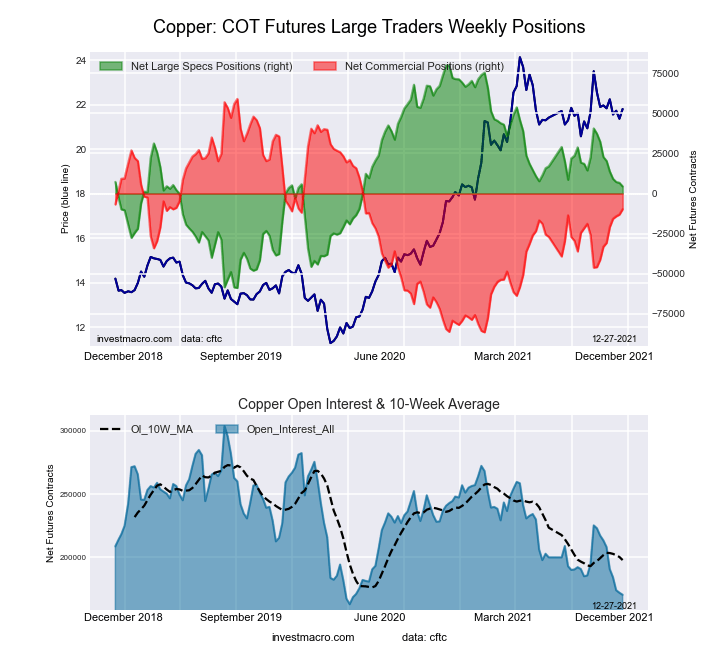
Highlighting the COT metals data is the positioning in the Copper futures. The speculative net position in the Copper futures rebounded strongly last week following nine consecutive weekly declines in speculator bets. The recent weakness had brought the overall net position in Copper futures to the lowest standing in the previous eighty-one weeks. Last week’s rise marked the largest one-week gain of the past ten weeks and pushed the overall net position to a six-week high.

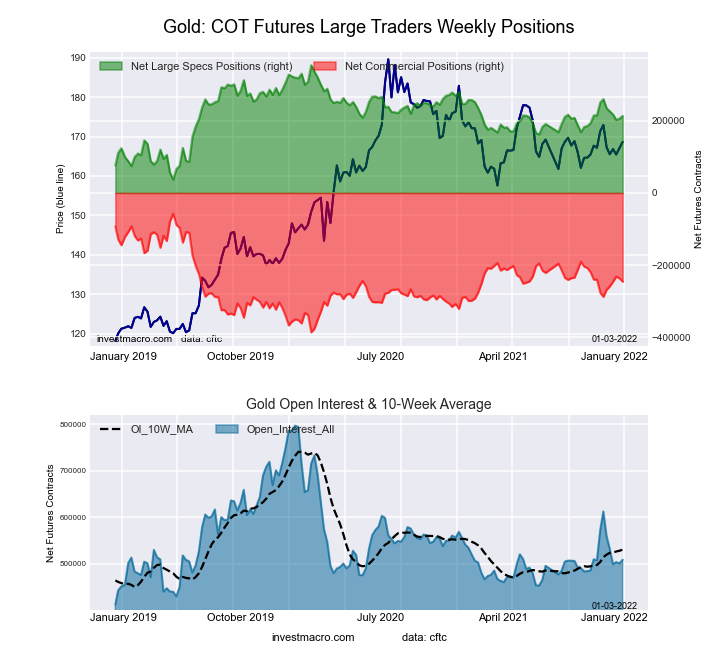
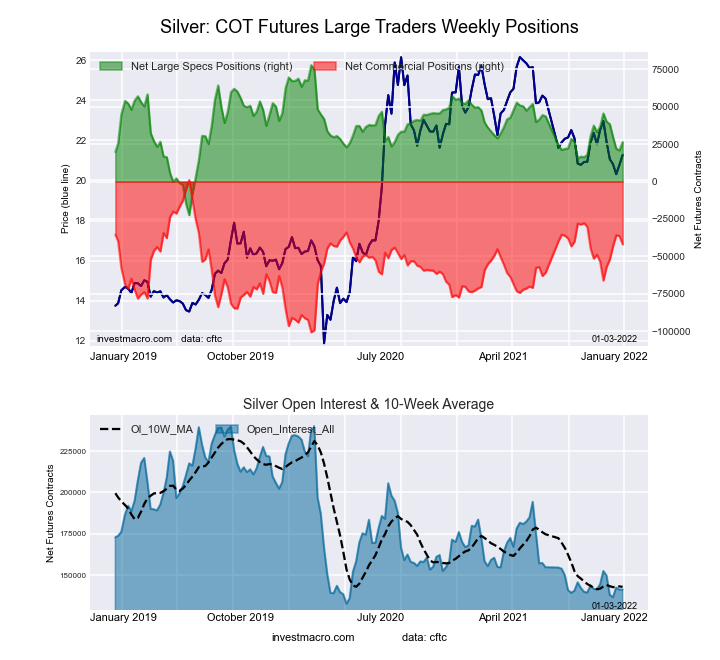
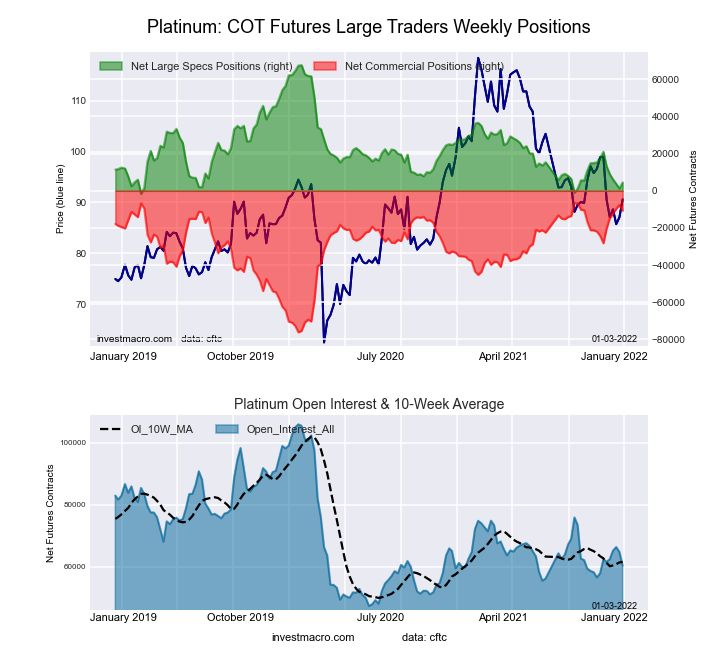
Joining Copper (9,946 contracts) with gains on the week were Gold (7,345 contracts), Silver (5,532 contracts), Platinum (3,201 contracts) and Palladium (530 contracts).


Data Snapshot of Commodity Market Traders | Columns Legend
Dec-28-2021OIOI-IndexSpec-NetSpec-IndexCom-NetCOM-IndexSmalls-NetSmalls-Index
WTI Crude1,867,3390338,42920-373,0927134,66364
Gold508,91222213,15656-245,6644332,50856
Silver141,246826,45849-41,9285815,47030
Copper180,7361314,38353-19,679465,29656
Palladium9,40313-3,10943,23095-12138
Platinum60,353224,4699-10,655946,18648
Natural Gas1,110,5320-146,21735115,6106730,60756
Brent215,92152-20,7168417,594183,12252
Heating Oil302,72134,89750-21,0604916,16354
Soybeans647,2259125,28561-93,07944-32,20618
Corn1,522,69225458,17689-411,79313-46,38316
Coffee261,2633055,26589-58,015142,7507
Sugar864,2629184,68675-209,0112924,32538
Wheat357,381119,13255-1,60139-7,53166


Gold Comex Futures:

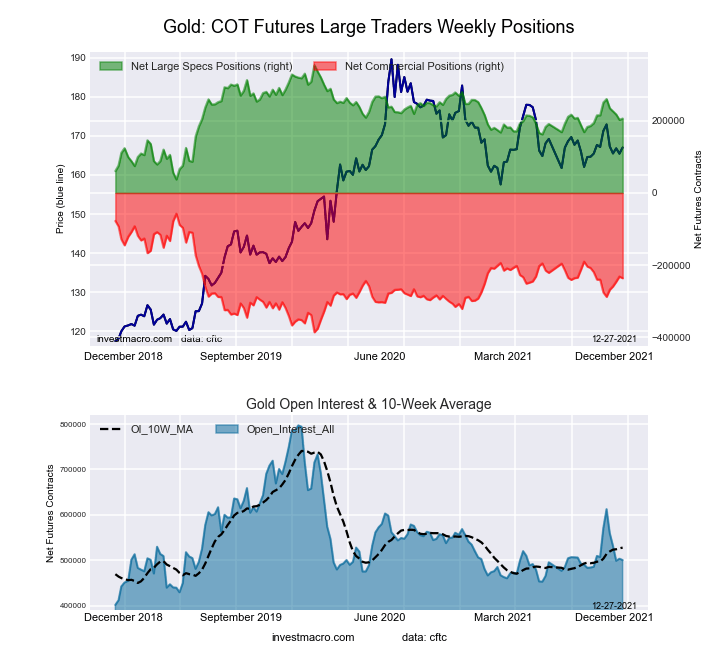
Gold Futures COT ChartThe Gold Comex Futures large speculator standing this week recorded a net position of 213,156 contracts in the data reported through Tuesday. This was a weekly gain of 7,345 contracts from the previous week which had a total of 205,811 net contracts.

This week’s current strength score (the trader positioning range over the past three years, measured from 0 to 100) shows the speculators are currently Bullish with a score of 55.6 percent. The commercials are Bearish with a score of 42.6 percent and the small traders (not shown in chart) are Bullish with a score of 56.5 percent.

Gold Futures StatisticsSPECULATORSCOMMERCIALSSMALL TRADERS
– Percent of Open Interest Longs:59.720.310.0
– Percent of Open Interest Shorts:17.868.53.7
– Net Position:213,156-245,66432,508
– Gross Longs:303,879103,17251,121
– Gross Shorts:90,723348,83618,613
– Long to Short Ratio:3.3 to 10.3 to 12.7 to 1
NET POSITION TREND:
– Strength Index Score (3 Year Range Pct):55.642.656.5
– Strength Index Reading (3 Year Range):BullishBearishBullish
NET POSITION MOVEMENT INDEX:
– 6-Week Change in Strength Index:-14.712.813.5


Silver Comex Futures:

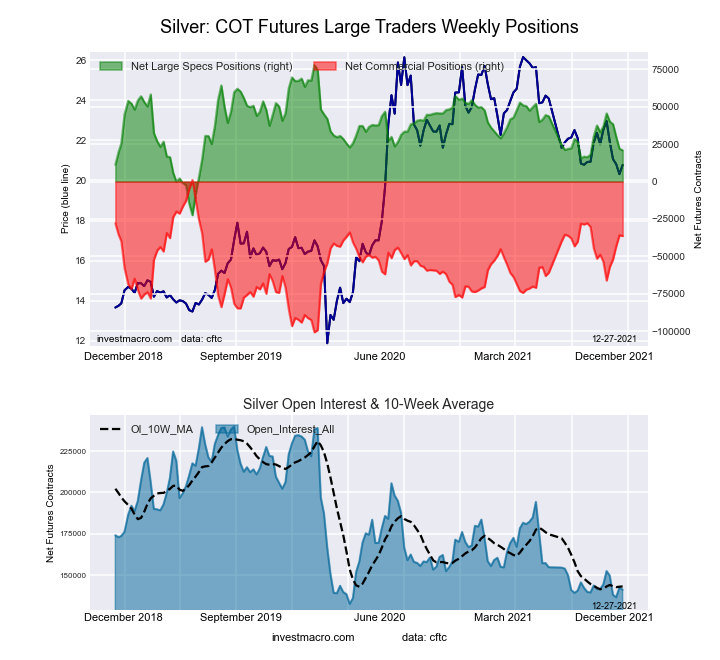
Silver Futures COT ChartThe Silver Comex Futures large speculator standing this week recorded a net position of 26,458 contracts in the data reported through Tuesday. This was a weekly increase of 5,532 contracts from the previous week which had a total of 20,926 net contracts.

This week’s current strength score (the trader positioning range over the past three years, measured from 0 to 100) shows the speculators are currently Bearish with a score of 48.7 percent. The commercials are Bullish with a score of 57.8 percent and the small traders (not shown in chart) are Bearish with a score of 30.5 percent.

Silver Futures StatisticsSPECULATORSCOMMERCIALSSMALL TRADERS
– Percent of Open Interest Longs:45.229.319.0
– Percent of Open Interest Shorts:26.559.08.1
– Net Position:26,458-41,92815,470
– Gross Longs:63,87341,38626,850
– Gross Shorts:37,41583,31411,380
– Long to Short Ratio:1.7 to 10.5 to 12.4 to 1
NET POSITION TREND:
– Strength Index Score (3 Year Range Pct):48.757.830.5
– Strength Index Reading (3 Year Range):BearishBullishBearish
NET POSITION MOVEMENT INDEX:
– 6-Week Change in Strength Index:-19.123.8-30.5


Copper Grade #1 Futures:

Copper Futures COT ChartThe Copper Grade #1 Futures large speculator standing this week recorded a net position of 14,383 contracts in the data reported through Tuesday. This was a weekly lift of 9,946 contracts from the previous week which had a total of 4,437 net contracts.

This week’s current strength score (the trader positioning range over the past three years, measured from 0 to 100) shows the speculators are currently Bullish with a score of 52.7 percent. The commercials are Bearish with a score of 45.9 percent and the small traders (not shown in chart) are Bullish with a score of 55.9 percent.

Copper Futures StatisticsSPECULATORSCOMMERCIALSSMALL TRADERS
– Percent of Open Interest Longs:39.342.69.2
– Percent of Open Interest Shorts:31.353.56.3
– Net Position:14,383-19,6795,296
– Gross Longs:70,98077,05716,594
– Gross Shorts:56,59796,73611,298
– Long to Short Ratio:1.3 to 10.8 to 11.5 to 1
NET POSITION TREND:
– Strength Index Score (3 Year Range Pct):52.745.955.9
– Strength Index Reading (3 Year Range):BullishBearishBullish
NET POSITION MOVEMENT INDEX:
– 6-Week Change in Strength Index:-4.37.6-29.9


Platinum Futures:

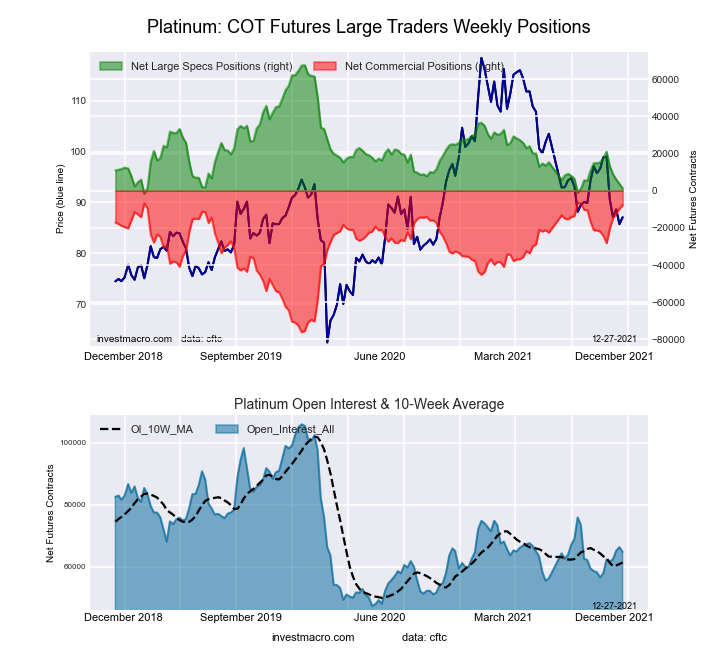
Platinum Futures COT ChartThe Platinum Futures large speculator standing this week recorded a net position of 4,469 contracts in the data reported through Tuesday. This was a weekly rise of 3,201 contracts from the previous week which had a total of 1,268 net contracts.

This week’s current strength score (the trader positioning range over the past three years, measured from 0 to 100) shows the speculators are currently Bearish-Extreme with a score of 8.8 percent. The commercials are Bullish-Extreme with a score of 93.8 percent and the small traders (not shown in chart) are Bearish with a score of 48.3 percent.

Platinum Futures StatisticsSPECULATORSCOMMERCIALSSMALL TRADERS
– Percent of Open Interest Longs:45.035.915.9
– Percent of Open Interest Shorts:37.653.55.6
– Net Position:4,469-10,6556,186
– Gross Longs:27,13321,6619,568
– Gross Shorts:22,66432,3163,382
– Long to Short Ratio:1.2 to 10.7 to 12.8 to 1
NET POSITION TREND:
– Strength Index Score (3 Year Range Pct):8.893.848.3
– Strength Index Reading (3 Year Range):Bearish-ExtremeBullish-ExtremeBearish
NET POSITION MOVEMENT INDEX:
– 6-Week Change in Strength Index:-23.925.2-14.3


Palladium Futures:

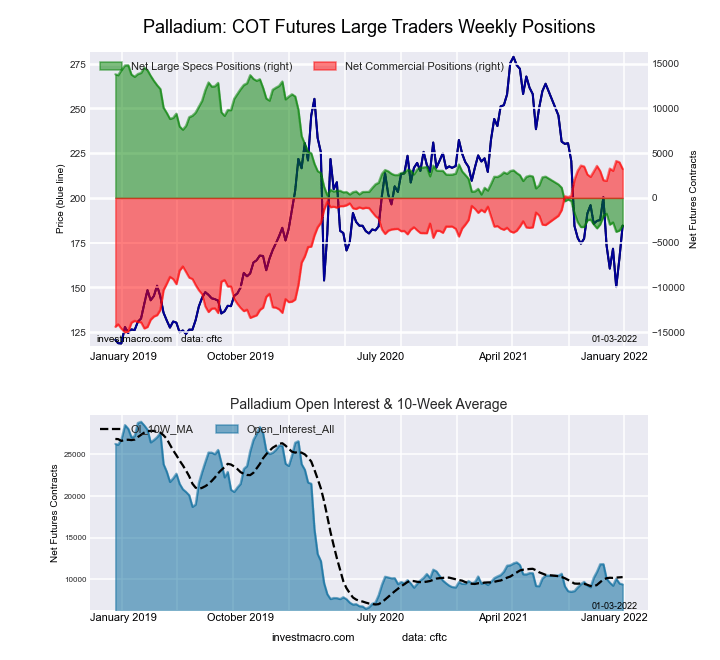
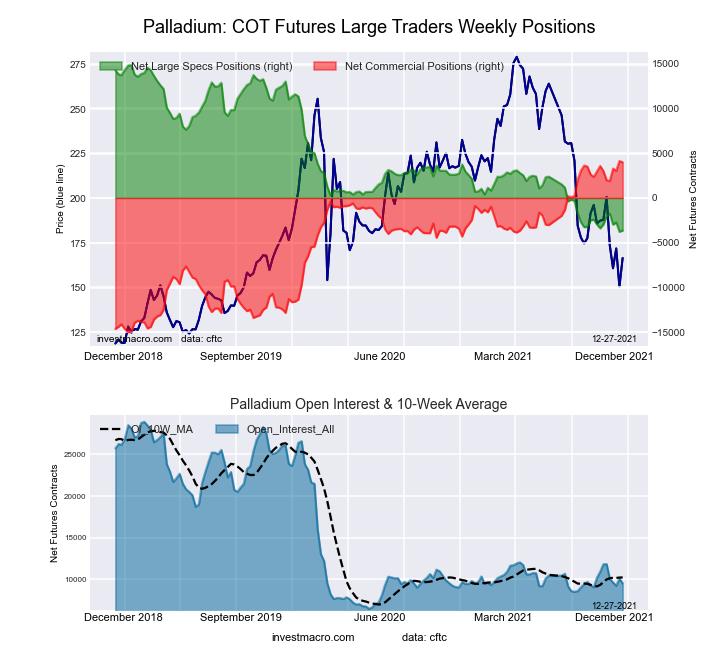
Palladium Futures COT ChartThe Palladium Futures large speculator standing this week recorded a net position of -3,109 contracts in the data reported through Tuesday. This was a weekly increase of 530 contracts from the previous week which had a total of -3,639 net contracts.

This week’s current strength score (the trader positioning range over the past three years, measured from 0 to 100) shows the speculators are currently Bearish-Extreme with a score of 3.6 percent. The commercials are Bullish-Extreme with a score of 95.3 percent and the small traders (not shown in chart) are Bearish with a score of 37.5 percent.

Palladium Futures StatisticsSPECULATORSCOMMERCIALSSMALL TRADERS
– Percent of Open Interest Longs:28.457.312.9
– Percent of Open Interest Shorts:61.523.014.2
– Net Position:-3,1093,230-121
– Gross Longs:2,6705,3901,214
– Gross Shorts:5,7792,1601,335
– Long to Short Ratio:0.5 to 12.5 to 10.9 to 1
NET POSITION TREND:
– Strength Index Score (3 Year Range Pct):3.695.337.5
– Strength Index Reading (3 Year Range):Bearish-ExtremeBullish-ExtremeBearish
NET POSITION MOVEMENT INDEX:
– 6-Week Change in Strength Index:-5.86.6-10.8


Article By InvestMacroReceive our weekly COT Reports by Email

*COT Report: The COT data, released weekly to the public each Friday, is updated through the most recent Tuesday (data is 3 days old) and shows a quick view of how large speculators or non-commercials (for-profit traders) were positioned in the futures markets.

The CFTC categorizes trader positions according to commercial hedgers (traders who use futures contracts for hedging as part of the business), non-commercials (large traders who speculate to realize trading profits) and nonreportable traders (usually small traders/speculators) as well as their open interest (contracts open in the market at time of reporting).See CFTC criteria here.
COT Energy Speculators drop WTI Crude Oil bullish bets to 148-week low

By InvestMacro | COT | Data Tables | COT Leaders | Downloads | COT Newsletter

Here are the latest charts and statistics for the Commitment of Traders (COT) data published by the Commodities Futures Trading Commission (CFTC). The latest release was delayed by the CFTC due to the New Year’s holiday.

The latest COT data is updated through Tuesday December 28th 2021 and shows a quick view of how large traders (for-profit speculators and commercial entities) were positioned in the futures markets.

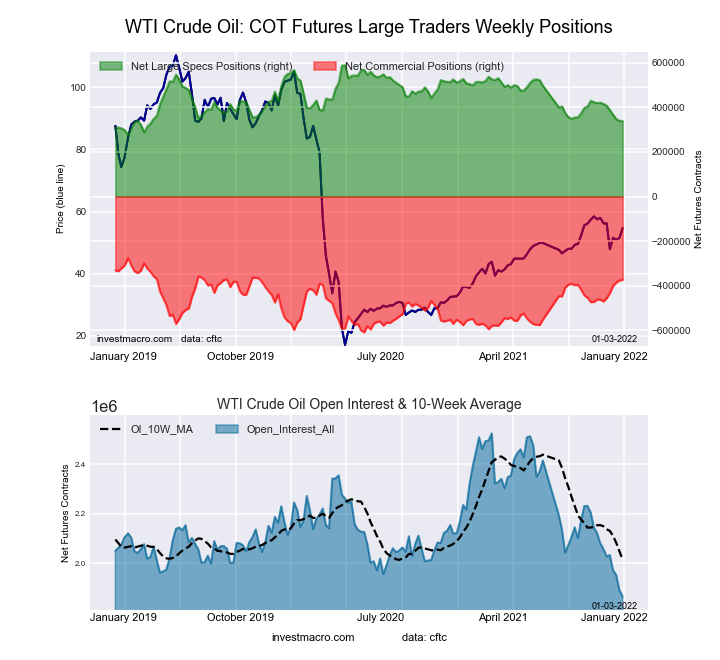
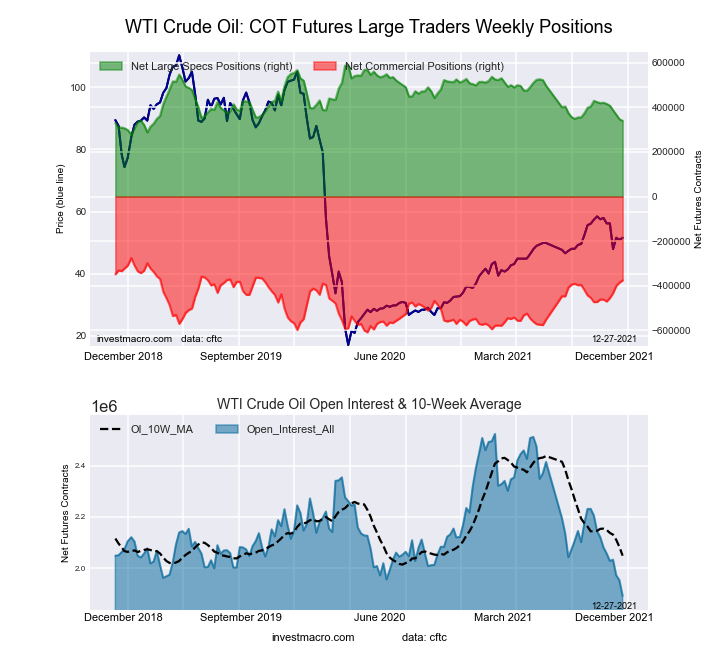
Highlighting the COT energy data is the continued decline in the WTI Crude Oil futures bets. The speculative net position in the WTI Crude Oil futures has decreased for seven consecutive weeks and in nine out of the previous ten weeks. The speculator’s crude position has fallen by a total of -91,165 contracts over the past ten weeks and speculators have now pushed their current net positioning to the lowest level since March 5th of 2019, a span of one hundred and forty-eight weeks.

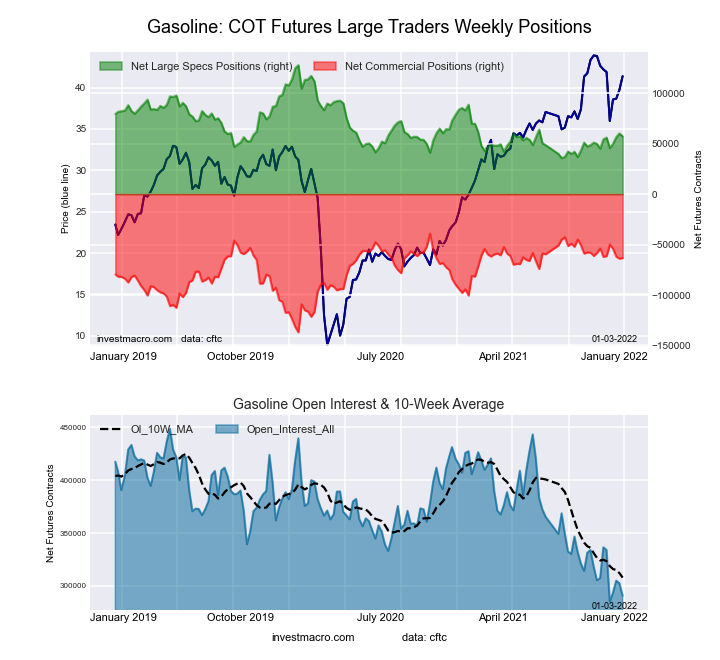
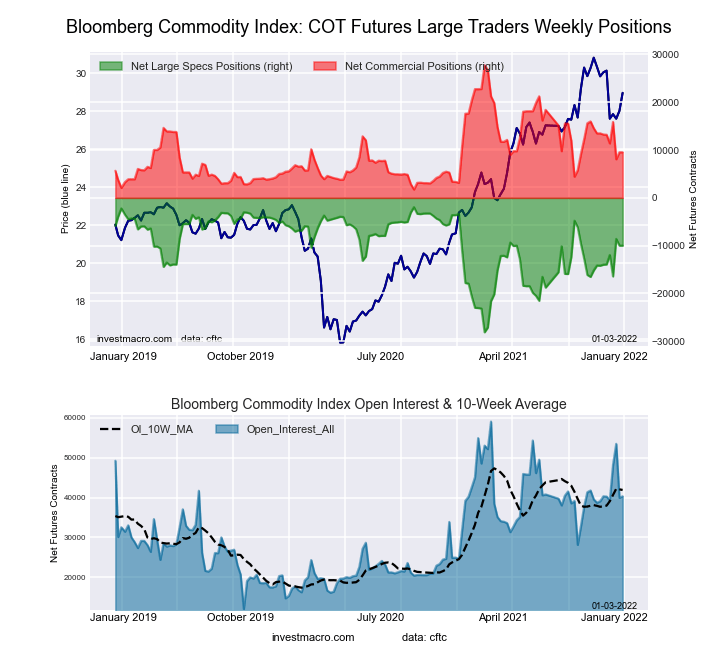
Joining WTI Crude Oil (-1,826 contracts) with lower bets last week were Natural Gas (-5,005 contracts), Gasoline (-2,908 contracts) and the Bloomberg Commodity Index (-11 contracts).

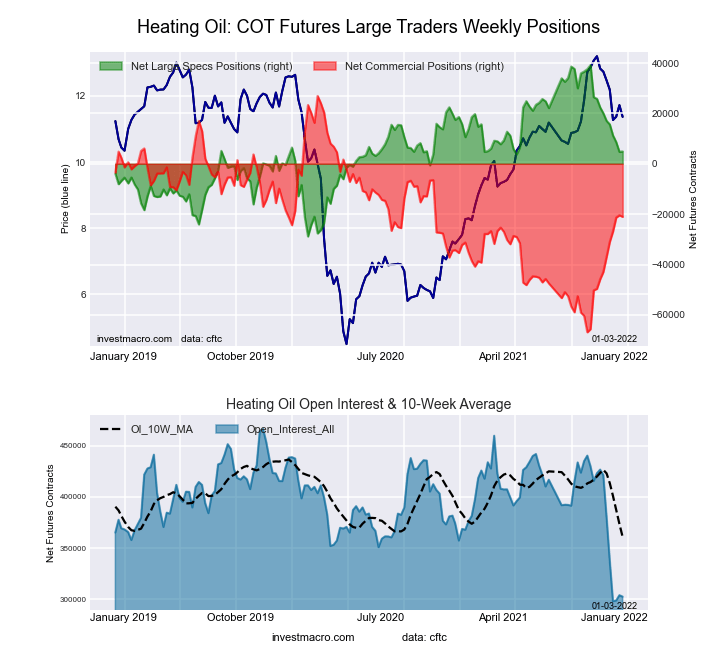
Energy markets with higher positions were Brent Crude Oil (4,285 contracts) and Heating Oil (174 contracts).


Data Snapshot of Commodity Market Traders | Columns Legend
Dec-28-2021OIOI-IndexSpec-NetSpec-IndexCom-NetCOM-IndexSmalls-NetSmalls-Index
WTI Crude1,867,3390338,42920-373,0927134,66364
Gold508,91222213,15656-245,6644332,50856
Silver141,246826,45849-41,9285815,47030
Copper180,7361314,38353-19,679465,29656
Palladium9,40313-3,10943,23095-12138
Platinum60,353224,4699-10,655946,18648
Natural Gas1,110,5320-146,21735115,6106730,60756
Brent215,92152-20,7168417,594183,12252
Heating Oil302,72134,89750-21,0604916,16354
Soybeans647,2259125,28561-93,07944-32,20618
Corn1,522,69225458,17689-411,79313-46,38316
Coffee261,2633055,26589-58,015142,7507
Sugar864,2629184,68675-209,0112924,32538
Wheat357,381119,13255-1,60139-7,53166


WTI Crude Oil Futures:

WTI Crude Oil Futures COT ChartThe WTI Crude Oil Futures large speculator standing this week totaled a net position of 338,429 contracts in the data reported through Tuesday. This was a weekly fall of -1,826 contracts from the previous week which had a total of 340,255 net contracts.

This week’s current strength score (the trader positioning range over the past three years, measured from 0 to 100) shows the speculators are currently Bearish-Extreme with a score of 19.6 percent. The commercials are Bullish with a score of 70.7 percent and the small traders (not shown in chart) are Bullish with a score of 63.9 percent.

WTI Crude Oil Futures StatisticsSPECULATORSCOMMERCIALSSMALL TRADERS
– Percent of Open Interest Longs:25.238.14.6
– Percent of Open Interest Shorts:7.058.12.7
– Net Position:338,429-373,09234,663
– Gross Longs:469,946711,71185,391
– Gross Shorts:131,5171,084,80350,728
– Long to Short Ratio:3.6 to 10.7 to 11.7 to 1
NET POSITION TREND:
– Strength Index Score (3 Year Range Pct):19.670.763.9
– Strength Index Reading (3 Year Range):Bearish-ExtremeBullishBullish
NET POSITION MOVEMENT INDEX:
– 6-Week Change in Strength Index:-24.829.2-28.0


Brent Crude Oil Futures:

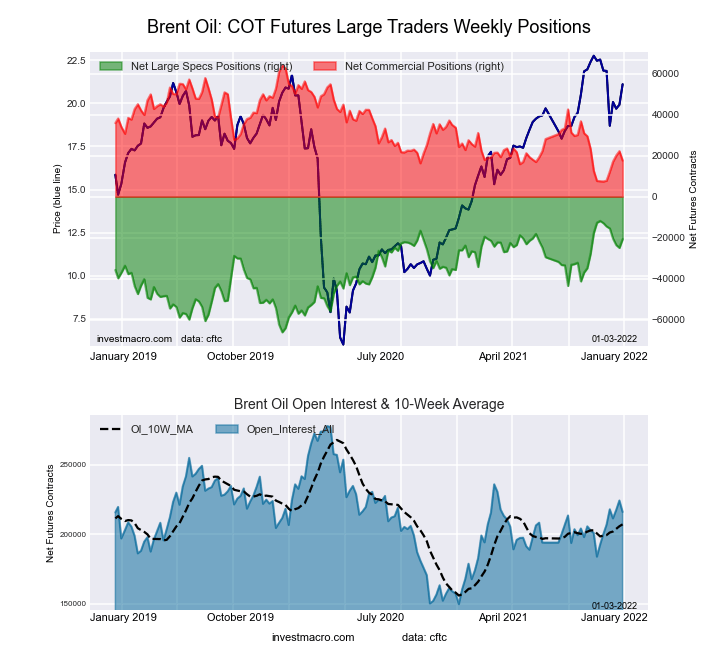
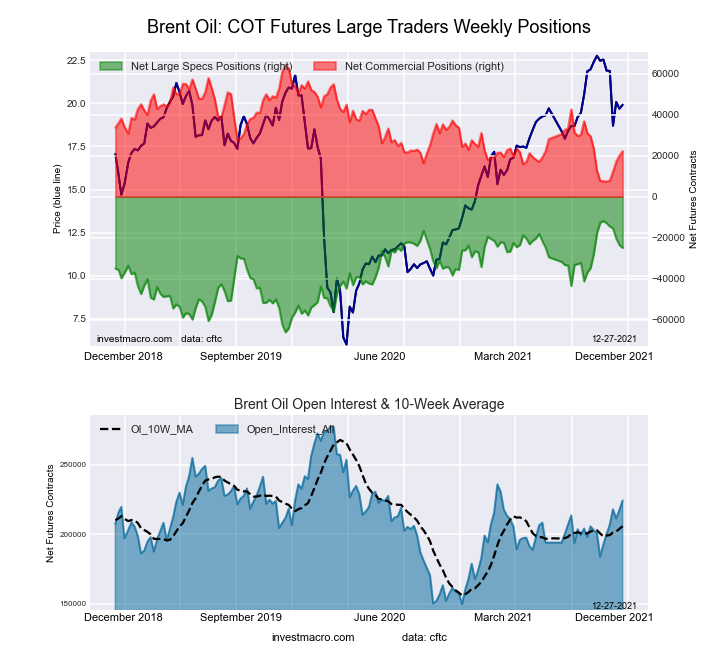
Brent Last Day Crude Oil Futures COT ChartThe Brent Crude Oil Futures large speculator standing this week totaled a net position of -20,716 contracts in the data reported through Tuesday. This was a weekly lift of 4,285 contracts from the previous week which had a total of -25,001 net contracts.

This week’s current strength score (the trader positioning range over the past three years, measured from 0 to 100) shows the speculators are currently Bullish-Extreme with a score of 83.7 percent. The commercials are Bearish-Extreme with a score of 17.9 percent and the small traders (not shown in chart) are Bullish with a score of 51.6 percent.

Brent Crude Oil Futures StatisticsSPECULATORSCOMMERCIALSSMALL TRADERS
– Percent of Open Interest Longs:18.944.63.4
– Percent of Open Interest Shorts:28.536.41.9
– Net Position:-20,71617,5943,122
– Gross Longs:40,79796,2037,263
– Gross Shorts:61,51378,6094,141
– Long to Short Ratio:0.7 to 11.2 to 11.8 to 1
NET POSITION TREND:
– Strength Index Score (3 Year Range Pct):83.717.951.6
– Strength Index Reading (3 Year Range):Bullish-ExtremeBearish-ExtremeBullish
NET POSITION MOVEMENT INDEX:
– 6-Week Change in Strength Index:-14.417.9-31.9


Natural Gas Futures:

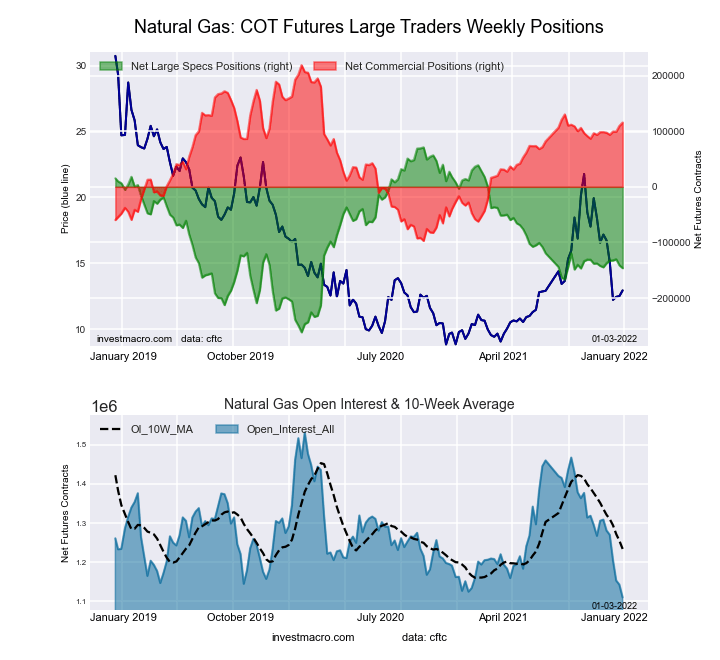
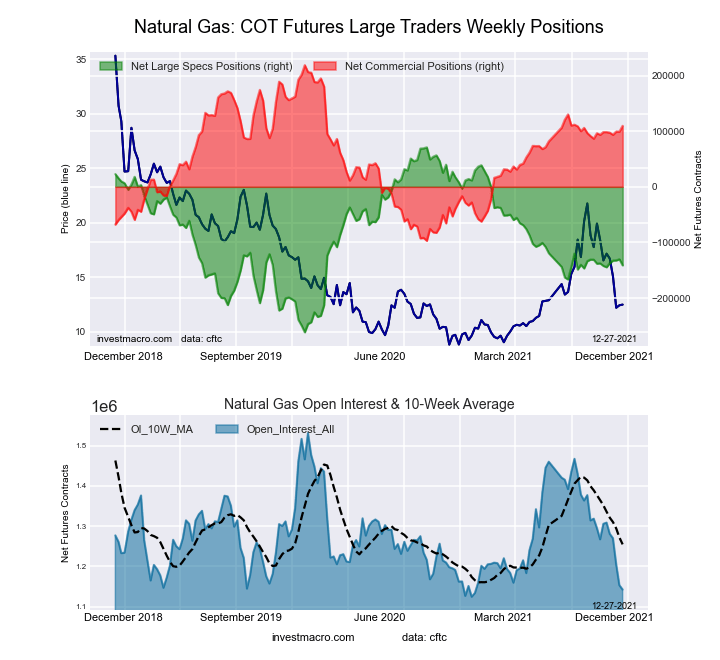
Natural Gas Futures COT ChartThe Natural Gas Futures large speculator standing this week totaled a net position of -146,217 contracts in the data reported through Tuesday. This was a weekly decrease of -5,005 contracts from the previous week which had a total of -141,212 net contracts.

This week’s current strength score (the trader positioning range over the past three years, measured from 0 to 100) shows the speculators are currently Bearish with a score of 34.7 percent. The commercials are Bullish with a score of 67.3 percent and the small traders (not shown in chart) are Bullish with a score of 56.5 percent.

Natural Gas Futures StatisticsSPECULATORSCOMMERCIALSSMALL TRADERS
– Percent of Open Interest Longs:19.045.55.0
– Percent of Open Interest Shorts:32.235.12.2
– Net Position:-146,217115,61030,607
– Gross Longs:211,299505,08655,322
– Gross Shorts:357,516389,47624,715
– Long to Short Ratio:0.6 to 11.3 to 12.2 to 1
NET POSITION TREND:
– Strength Index Score (3 Year Range Pct):34.767.356.5
– Strength Index Reading (3 Year Range):BearishBullishBullish
NET POSITION MOVEMENT INDEX:
– 6-Week Change in Strength Index:-0.55.4-39.4


Gasoline Blendstock Futures:

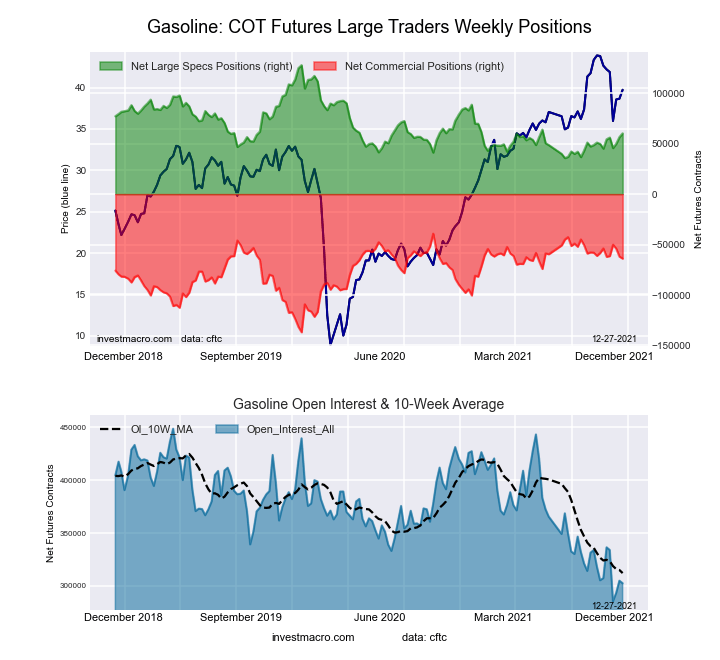
RBOB Gasoline Energy Futures COT ChartThe Gasoline Blendstock Futures large speculator standing this week totaled a net position of 57,245 contracts in the data reported through Tuesday. This was a weekly lowering of -2,908 contracts from the previous week which had a total of 60,153 net contracts.

This week’s current strength score (the trader positioning range over the past three years, measured from 0 to 100) shows the speculators are currently Bearish with a score of 28.4 percent. The commercials are Bullish with a score of 73.7 percent and the small traders (not shown in chart) are Bearish with a score of 48.0 percent.

Nasdaq Mini Futures StatisticsSPECULATORSCOMMERCIALSSMALL TRADERS
– Percent of Open Interest Longs:33.044.36.9
– Percent of Open Interest Shorts:13.466.14.8
– Net Position:57,245-63,3456,100
– Gross Longs:96,105128,84019,965
– Gross Shorts:38,860192,18513,865
– Long to Short Ratio:2.5 to 10.7 to 11.4 to 1
NET POSITION TREND:
– Strength Index Score (3 Year Range Pct):28.473.748.0
– Strength Index Reading (3 Year Range):BearishBullishBearish
NET POSITION MOVEMENT INDEX:
– 6-Week Change in Strength Index:3.1-1.2-10.8


#2 Heating Oil NY-Harbor Futures:

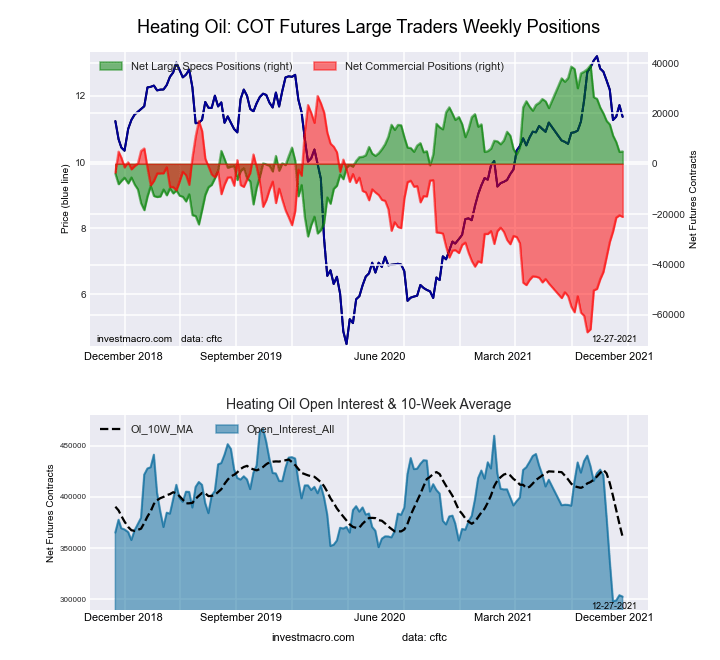
NY Harbor Heating Oil Energy Futures COT ChartThe #2 Heating Oil NY-Harbor Futures large speculator standing this week totaled a net position of 4,897 contracts in the data reported through Tuesday. This was a weekly lift of 174 contracts from the previous week which had a total of 4,723 net contracts.

This week’s current strength score (the trader positioning range over the past three years, measured from 0 to 100) shows the speculators are currently Bearish with a score of 49.6 percent. The commercials are Bearish with a score of 48.9 percent and the small traders (not shown in chart) are Bullish with a score of 54.3 percent.

Heating Oil Futures StatisticsSPECULATORSCOMMERCIALSSMALL TRADERS
– Percent of Open Interest Longs:13.051.613.7
– Percent of Open Interest Shorts:11.358.58.3
– Net Position:4,897-21,06016,163
– Gross Longs:39,255156,08841,332
– Gross Shorts:34,358177,14825,169
– Long to Short Ratio:1.1 to 10.9 to 11.6 to 1
NET POSITION TREND:
– Strength Index Score (3 Year Range Pct):49.648.954.3
– Strength Index Reading (3 Year Range):BearishBearishBullish
NET POSITION MOVEMENT INDEX:
– 6-Week Change in Strength Index:-22.323.3-23.3


Bloomberg Commodity Index Futures:

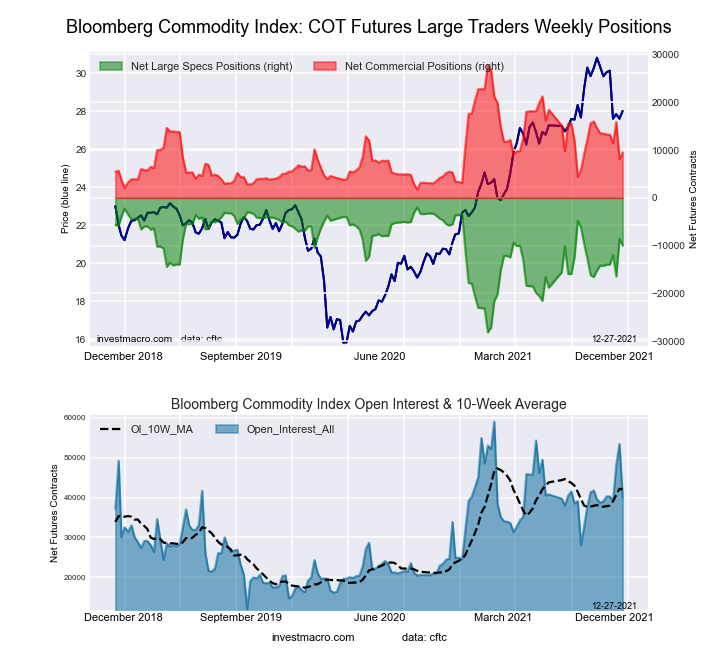
Bloomberg Commodity Index Futures COT ChartThe Bloomberg Commodity Index Futures large speculator standing this week totaled a net position of -9,995 contracts in the data reported through Tuesday. This was a weekly reduction of -11 contracts from the previous week which had a total of -9,984 net contracts.

This week’s current strength score (the trader positioning range over the past three years, measured from 0 to 100) shows the speculators are currently Bullish with a score of 69.2 percent. The commercials are Bearish with a score of 30.0 percent and the small traders (not shown in chart) are Bearish with a score of 44.4 percent.

Bloomberg Index Futures StatisticsSPECULATORSCOMMERCIALSSMALL TRADERS
– Percent of Open Interest Longs:71.325.11.2
– Percent of Open Interest Shorts:96.11.50.1
– Net Position:-9,9959,537458
– Gross Longs:28,75110,137500
– Gross Shorts:38,74660042
– Long to Short Ratio:0.7 to 116.9 to 111.9 to 1
NET POSITION TREND:
– Strength Index Score (3 Year Range Pct):69.230.044.4
– Strength Index Reading (3 Year Range):BullishBearishBearish
NET POSITION MOVEMENT INDEX:
– 6-Week Change in Strength Index:15.2-14.3-11.6


Article By InvestMacroReceive our weekly COT Reports by Email

*COT Report: The COT data, released weekly to the public each Friday, is updated through the most recent Tuesday (data is 3 days old) and shows a quick view of how large speculators or non-commercials (for-profit traders) were positioned in the futures markets.

The CFTC categorizes trader positions according to commercial hedgers (traders who use futures contracts for hedging as part of the business), non-commercials (large traders who speculate to realize trading profits) and nonreportable traders (usually small traders/speculators) as well as their open interest (contracts open in the market at time of reporting).See CFTC criteria here.
COT Stock Market Speculators rebooted their VIX Volatility bearish bets for 1st time in 5 weeks

By InvestMacro | COT | Data Tables | COT Leaders | Downloads | COT Newsletter

Here are the latest charts and statistics for the Commitment of Traders (COT) data published by the Commodities Futures Trading Commission (CFTC). The latest release was delayed by the CFTC due to the New Year’s holiday.

The latest COT data is updated through Tuesday December 28th 2021 and shows a quick view of how large traders (for-profit speculators and commercial entities) were positioned in the futures markets.

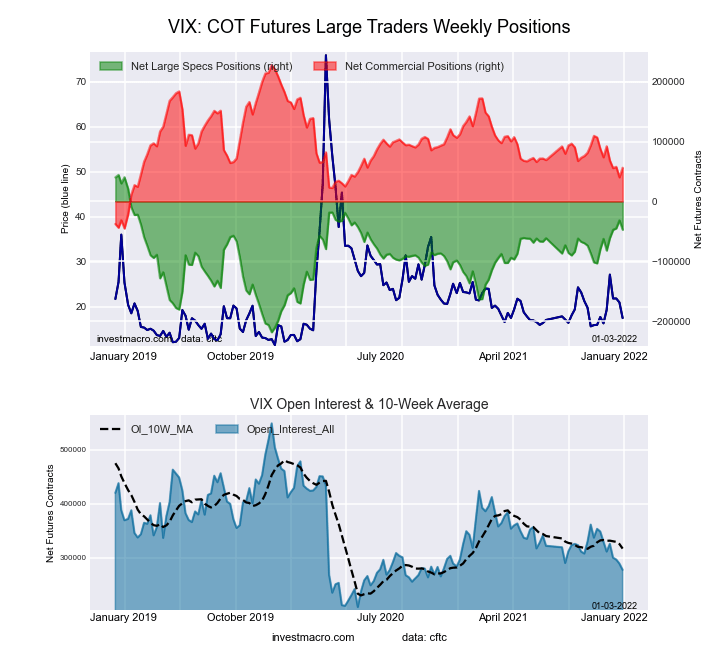
Highlighting the COT stock market data is the rebound in the VIX Volatility futures bearish bets after multiple weeks of bullish buying. The speculative net position in the VIX futures saw bearish bets rise last week by 15,586 contracts following declining bearish positions in the previous four straight weeks and in six out of the previous seven weeks. VIX bearish positions had risen as high as -103,286 contracts on November 2nd before seeing traders shed their bearish bets sharply over the next six weeks.

The only stock market that saw higher speculator bets last week were Dow Jones Industrial Average Mini positions (8,107 contracts).

The markets with lower speculator bets on the week were the VIX (-15,586 contracts), S&P500 Mini (-33,087 contracts), Nasdaq Mini (-11,256 contracts), Russell 2000 Mini (-8,126 contracts), Nikkei 225 USD (-333 contracts), MSCI EAFE Mini (-8,779 contracts) and the MSCI Emerging Markets Mini (-2,219 contracts).


Data Snapshot of Stock Market Traders | Columns Legend
Dec-28-2021OIOI-IndexSpec-NetSpec-IndexCom-NetCOM-IndexSmalls-NetSmalls-Index
S&P500-Mini2,287,8521103,29484-137,7764134,48234
Nikkei 22515,3193-7,795406,8616493439
Nasdaq-Mini211,0971914,10483-15,0351793146
DowJones-Mini96,74965-1,15834-1,929603,08755
VIX277,50220-47,1957156,22531-9,03022
Nikkei 225 Yen41,696173,1153013,62371-16,73846


VIX Volatility Futures:

VIX Volatility Futures COT ChartThe VIX Volatility large speculator standing this week equaled a net position of -47,195 contracts in the data reported through Tuesday. This was a weekly fall of -15,586 contracts from the previous week which had a total of -31,609 net contracts.

This week’s current strength score (the trader positioning range over the past three years, measured from 0 to 100) shows the speculators are currently Bullish with a score of 71.5 percent. The commercials are Bearish with a score of 31.2 percent and the small traders (not shown in chart) are Bearish with a score of 22.1 percent.

VIX Volatility Futures StatisticsSPECULATORSCOMMERCIALSSMALL TRADERS
– Percent of Open Interest Longs:21.251.36.4
– Percent of Open Interest Shorts:38.231.09.7
– Net Position:-47,19556,225-9,030
– Gross Longs:58,799142,29617,818
– Gross Shorts:105,99486,07126,848
– Long to Short Ratio:0.6 to 11.7 to 10.7 to 1
NET POSITION TREND:
– Strength Index Score (3 Year Range Pct):71.531.222.1
– Strength Index Reading (3 Year Range):BullishBearishBearish
NET POSITION MOVEMENT INDEX:
– 6-Week Change in Strength Index:6.4-7.08.2


S&P500 Mini Futures:

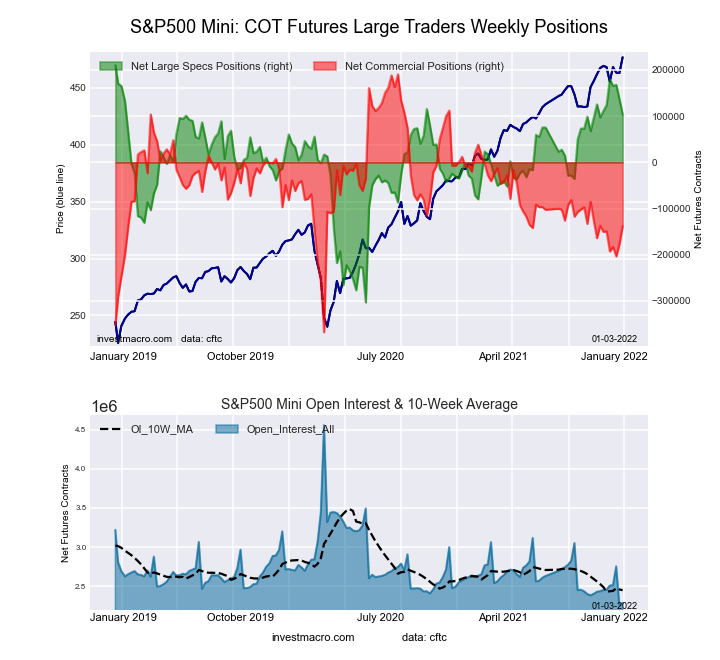
SP500 Mini Futures COT ChartThe S&P500 Mini large speculator standing this week equaled a net position of 103,294 contracts in the data reported through Tuesday. This was a weekly lowering of -33,087 contracts from the previous week which had a total of 136,381 net contracts.

This week’s current strength score (the trader positioning range over the past three years, measured from 0 to 100) shows the speculators are currently Bullish-Extreme with a score of 84.2 percent. The commercials are Bearish with a score of 41.2 percent and the small traders (not shown in chart) are Bearish with a score of 33.6 percent.

S&P500 Mini Futures StatisticsSPECULATORSCOMMERCIALSSMALL TRADERS
– Percent of Open Interest Longs:17.669.211.3
– Percent of Open Interest Shorts:13.175.29.8
– Net Position:103,294-137,77634,482
– Gross Longs:403,6141,582,654259,664
– Gross Shorts:300,3201,720,430225,182
– Long to Short Ratio:1.3 to 10.9 to 11.2 to 1
NET POSITION TREND:
– Strength Index Score (3 Year Range Pct):84.241.233.6
– Strength Index Reading (3 Year Range):Bullish-ExtremeBearishBearish
NET POSITION MOVEMENT INDEX:
– 6-Week Change in Strength Index:-1.62.2-1.0


Dow Jones Mini Futures:

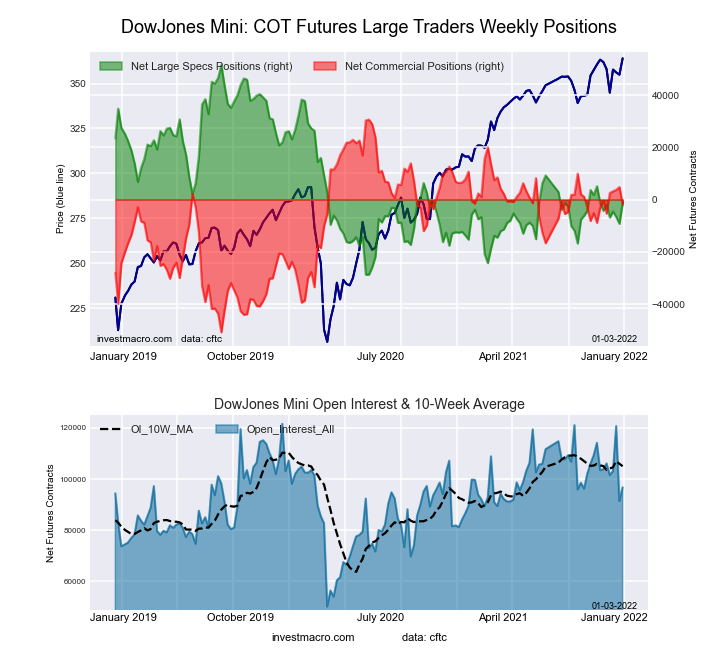
Dow Jones Mini Futures COT ChartThe Dow Jones Mini large speculator standing this week equaled a net position of -1,158 contracts in the data reported through Tuesday. This was a weekly gain of 8,107 contracts from the previous week which had a total of -9,265 net contracts.

This week’s current strength score (the trader positioning range over the past three years, measured from 0 to 100) shows the speculators are currently Bearish with a score of 34.4 percent. The commercials are Bullish with a score of 60.0 percent and the small traders (not shown in chart) are Bullish with a score of 55.0 percent.

Dow Jones Mini Futures StatisticsSPECULATORSCOMMERCIALSSMALL TRADERS
– Percent of Open Interest Longs:36.847.515.1
– Percent of Open Interest Shorts:38.049.511.9
– Net Position:-1,158-1,9293,087
– Gross Longs:35,61645,96314,621
– Gross Shorts:36,77447,89211,534
– Long to Short Ratio:1.0 to 11.0 to 11.3 to 1
NET POSITION TREND:
– Strength Index Score (3 Year Range Pct):34.460.055.0
– Strength Index Reading (3 Year Range):BearishBullishBullish
NET POSITION MOVEMENT INDEX:
– 6-Week Change in Strength Index:3.9-1.9-8.6


Nasdaq Mini Futures:

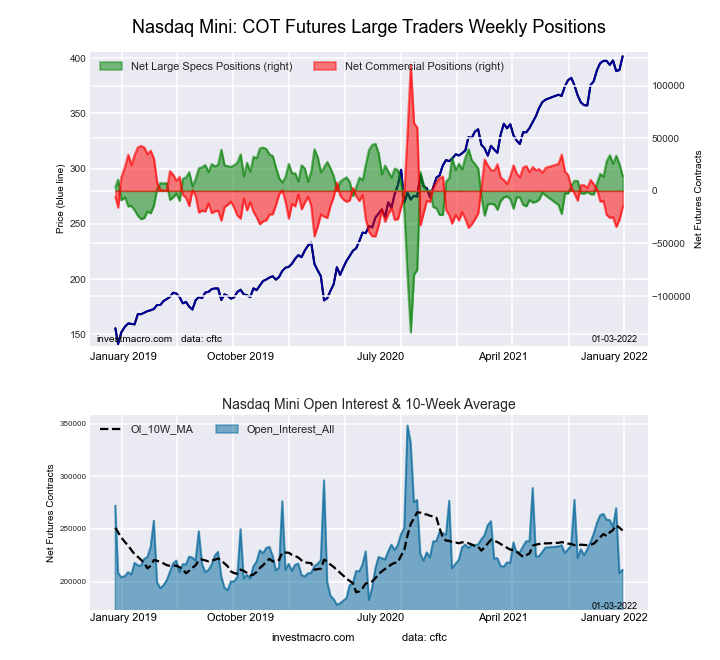
Nasdaq Mini Futures COT ChartThe Nasdaq Mini large speculator standing this week equaled a net position of 14,104 contracts in the data reported through Tuesday. This was a weekly fall of -11,256 contracts from the previous week which had a total of 25,360 net contracts.

This week’s current strength score (the trader positioning range over the past three years, measured from 0 to 100) shows the speculators are currently Bullish-Extreme with a score of 82.9 percent. The commercials are Bearish-Extreme with a score of 17.3 percent and the small traders (not shown in chart) are Bearish with a score of 46.1 percent.

Nasdaq Mini Futures StatisticsSPECULATORSCOMMERCIALSSMALL TRADERS
– Percent of Open Interest Longs:32.849.316.8
– Percent of Open Interest Shorts:26.256.416.4
– Net Position:14,104-15,035931
– Gross Longs:69,315104,12735,448
– Gross Shorts:55,211119,16234,517
– Long to Short Ratio:1.3 to 10.9 to 11.0 to 1
NET POSITION TREND:
– Strength Index Score (3 Year Range Pct):82.917.346.1
– Strength Index Reading (3 Year Range):Bullish-ExtremeBearish-ExtremeBearish
NET POSITION MOVEMENT INDEX:
– 6-Week Change in Strength Index:0.4-3.410.9


Russell 2000 Mini Futures:

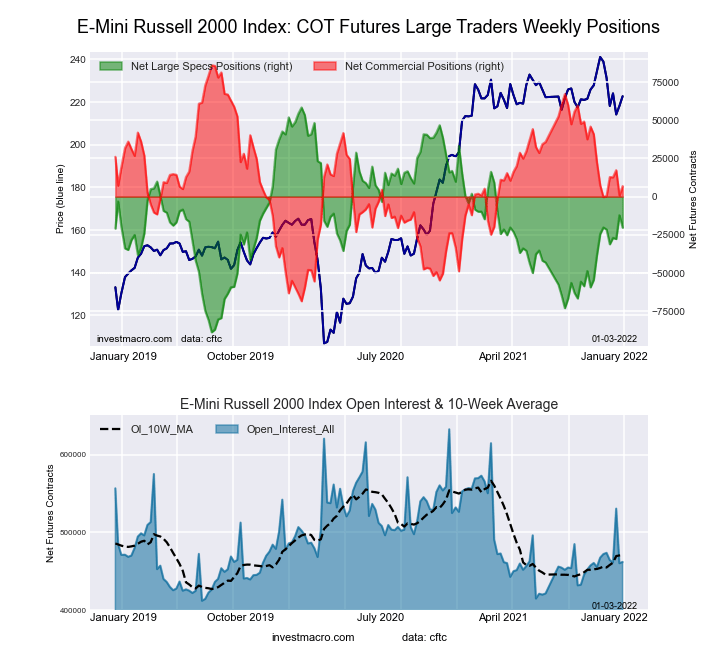
Russell 2000 Mini Futures COT ChartThe Russell 2000 Mini large speculator standing this week equaled a net position of -20,299 contracts in the data reported through Tuesday. This was a weekly reduction of -8,126 contracts from the previous week which had a total of -12,173 net contracts.

This week’s current strength score (the trader positioning range over the past three years, measured from 0 to 100) shows the speculators are currently Bearish with a score of 46.5 percent. The commercials are Bearish with a score of 48.8 percent and the small traders (not shown in chart) are Bullish with a score of 70.9 percent.

Russell 2000 Mini Futures StatisticsSPECULATORSCOMMERCIALSSMALL TRADERS
– Percent of Open Interest Longs:15.876.76.8
– Percent of Open Interest Shorts:20.275.23.9
– Net Position:-20,2996,89013,409
– Gross Longs:72,956353,98931,421
– Gross Shorts:93,255347,09918,012
– Long to Short Ratio:0.8 to 11.0 to 11.7 to 1
NET POSITION TREND:
– Strength Index Score (3 Year Range Pct):46.548.870.9
– Strength Index Reading (3 Year Range):BearishBearishBullish
NET POSITION MOVEMENT INDEX:
– 6-Week Change in Strength Index:-0.14.7-19.9


Nikkei Stock Average (USD) Futures:

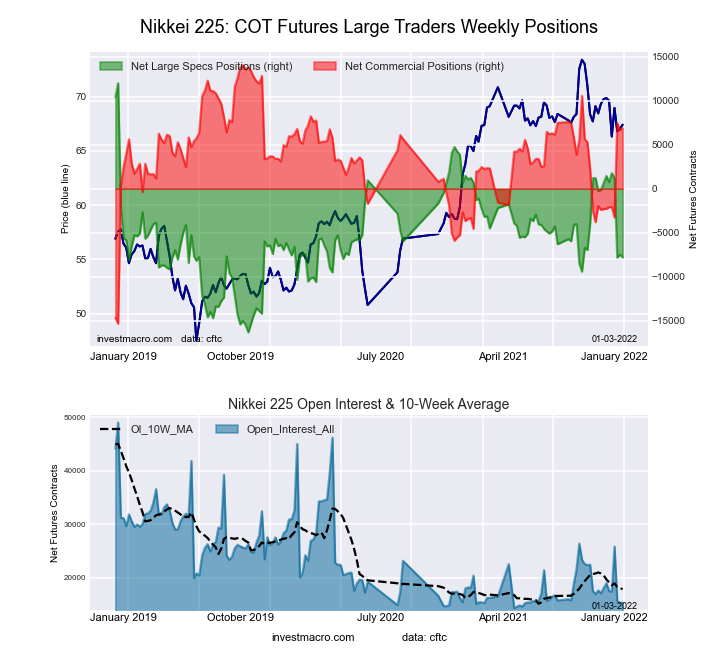
Nikkei Stock Average (USD) Futures COT ChartThe Nikkei Stock Average (USD) large speculator standing this week equaled a net position of -7,795 contracts in the data reported through Tuesday. This was a weekly fall of -333 contracts from the previous week which had a total of -7,462 net contracts.

This week’s current strength score (the trader positioning range over the past three years, measured from 0 to 100) shows the speculators are currently Bearish with a score of 40.4 percent. The commercials are Bullish with a score of 64.0 percent and the small traders (not shown in chart) are Bearish with a score of 38.8 percent.

Nikkei Stock Average Futures StatisticsSPECULATORSCOMMERCIALSSMALL TRADERS
– Percent of Open Interest Longs:10.763.225.9
– Percent of Open Interest Shorts:61.518.419.8
– Net Position:-7,7956,861934
– Gross Longs:1,6339,6843,969
– Gross Shorts:9,4282,8233,035
– Long to Short Ratio:0.2 to 13.4 to 11.3 to 1
NET POSITION TREND:
– Strength Index Score (3 Year Range Pct):40.464.038.8
– Strength Index Reading (3 Year Range):BearishBullishBearish
NET POSITION MOVEMENT INDEX:
– 6-Week Change in Strength Index:-44.045.91.4


MSCI EAFE Mini Futures:

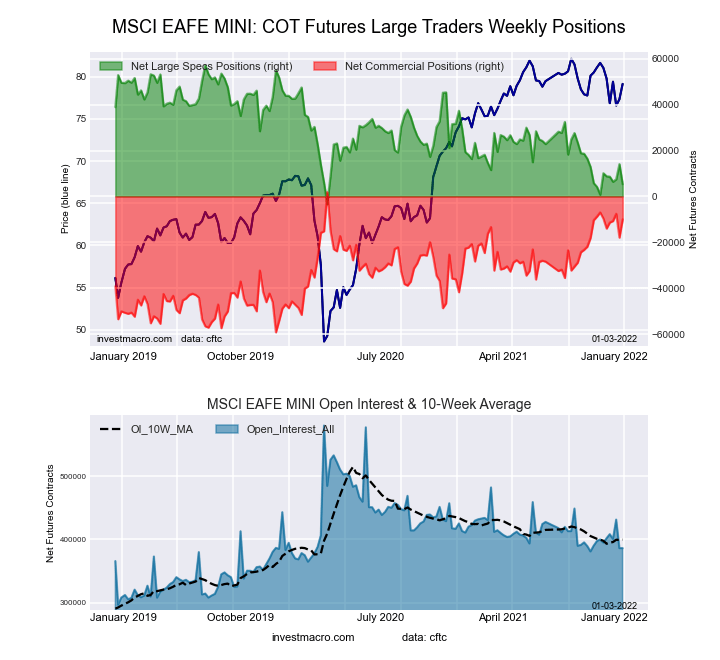
MSCI EAFE Mini Futures COT ChartThe MSCI EAFE Mini large speculator standing this week equaled a net position of 5,290 contracts in the data reported through Tuesday. This was a weekly decline of -8,779 contracts from the previous week which had a total of 14,069 net contracts.

This week’s current strength score (the trader positioning range over the past three years, measured from 0 to 100) shows the speculators are currently Bearish-Extreme with a score of 14.3 percent. The commercials are Bullish-Extreme with a score of 80.5 percent and the small traders (not shown in chart) are Bullish with a score of 58.6 percent.

MSCI EAFE Mini Futures StatisticsSPECULATORSCOMMERCIALSSMALL TRADERS
– Percent of Open Interest Longs:6.290.62.9
– Percent of Open Interest Shorts:4.893.21.7
– Net Position:5,290-10,0024,712
– Gross Longs:23,909349,66211,330
– Gross Shorts:18,619359,6646,618
– Long to Short Ratio:1.3 to 11.0 to 11.7 to 1
NET POSITION TREND:
– Strength Index Score (3 Year Range Pct):14.380.558.6
– Strength Index Reading (3 Year Range):Bearish-ExtremeBullish-ExtremeBullish
NET POSITION MOVEMENT INDEX:
– 6-Week Change in Strength Index:-8.0-0.647.2


Article By InvestMacroReceive our weekly COT Reports by Email

*COT Report: The COT data, released weekly to the public each Friday, is updated through the most recent Tuesday (data is 3 days old) and shows a quick view of how large speculators or non-commercials (for-profit traders) were positioned in the futures markets.

The CFTC categorizes trader positions according to commercial hedgers (traders who use futures contracts for hedging as part of the business), non-commercials (large traders who speculate to realize trading profits) and nonreportable traders (usually small traders/speculators) as well as their open interest (contracts open in the market at time of reporting).See CFTC criteria here.
COT Soft Commodity Speculators push Soybean bullish bets higher to 22-week high

By InvestMacro | COT | Data Tables | COT Leaders | Downloads | COT Newsletter

Here are the latest charts and statistics for the Commitment of Traders (COT) data published by the Commodities Futures Trading Commission (CFTC). The latest release was delayed by the CFTC due to the New Year’s holiday.

The latest COT data is updated through Tuesday December 28th 2021 (delayed holiday release) and shows a quick view of how large traders (for-profit speculators and commercial entities) were positioned in the futures markets.

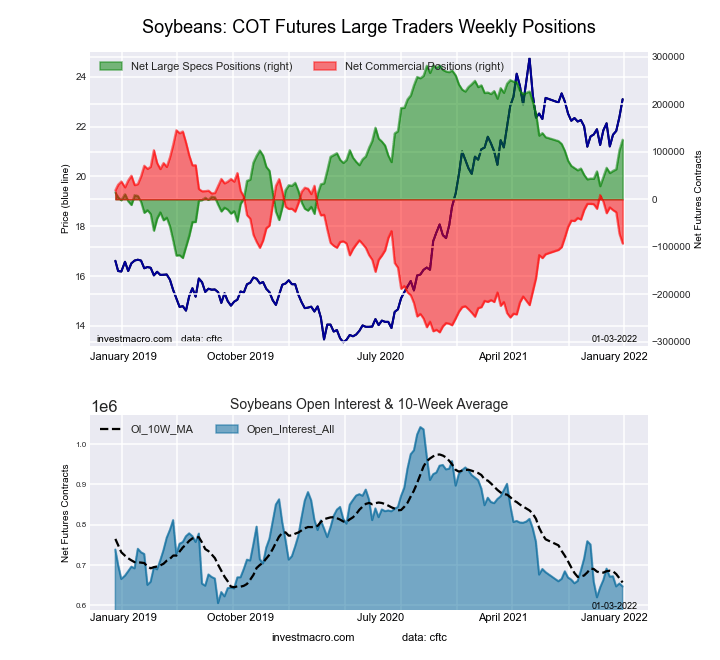
Highlighting the COT soft commodities data last week was once again the Soybeans bullish bets that keep on rising. The speculator positions increased for a fourth straight week and by a total of 69,968 contracts over that 4-week time-frame. This bullishness has boosted the Soybean speculator position to its highest level since July 27th, a span of twenty-two weeks.

The soft commodities that saw higher bets last week were Corn (12,856 contracts), Soybeans (22,408 contracts), Soybean Oil (201 contracts), Soybean Meal (11,610 contracts),  Lean Hogs (1,094 contracts), Cotton (3,152 contracts) and Cocoa (2,547 contracts). The commodities with lower bets on the week were Wheat (-2,833 contracts), Sugar (-4,512 contracts), Coffee (-869 contracts) and Live Cattle (-13,158 contracts).


Data Snapshot of Commodity Market Traders | Columns Legend
Dec-28-2021OIOI-IndexSpec-NetSpec-IndexCom-NetCOM-IndexSmalls-NetSmalls-Index
WTI Crude1,867,3390338,42920-373,0927134,66364
Gold508,91222213,15656-245,6644332,50856
Silver141,246826,45849-41,9285815,47030
Copper180,7361314,38353-19,679465,29656
Palladium9,40313-3,10943,23095-12138
Platinum60,353224,4699-10,655946,18648
Natural Gas1,110,5320-146,21735115,6106730,60756
Brent215,92152-20,7168417,594183,12252
Heating Oil302,72134,89750-21,0604916,16354
Soybeans647,2259125,28561-93,07944-32,20618
Corn1,522,69225458,17689-411,79313-46,38316
Coffee261,2633055,26589-58,015142,7507
Sugar864,2629184,68675-209,0112924,32538
Wheat357,381119,13255-1,60139-7,53166


CORN Futures:

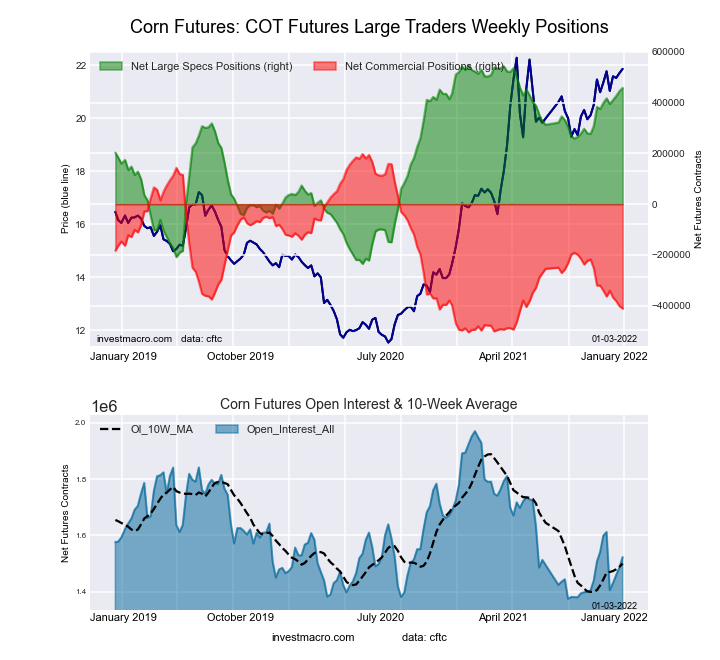
CORN Futures COT ChartThe CORN large speculator standing this week reached a net position of 458,176 contracts in the data reported through Tuesday. This was a weekly rise of 12,856 contracts from the previous week which had a total of 445,320 net contracts.

This week’s current strength score (the trader positioning range over the past three years, measured from 0 to 100) shows the speculators are currently Bullish-Extreme with a score of 88.6 percent. The commercials are Bearish-Extreme with a score of 13.3 percent and the small traders (not shown in chart) are Bearish-Extreme with a score of 16.3 percent.

CORN Futures StatisticsSPECULATORSCOMMERCIALSSMALL TRADERS
– Percent of Open Interest Longs:35.343.78.5
– Percent of Open Interest Shorts:5.270.811.5
– Net Position:458,176-411,793-46,383
– Gross Longs:536,934665,968129,328
– Gross Shorts:78,7581,077,761175,711
– Long to Short Ratio:6.8 to 10.6 to 10.7 to 1
NET POSITION TREND:
– Strength Index Score (3 Year Range Pct):88.613.316.3
– Strength Index Reading (3 Year Range):Bullish-ExtremeBearish-ExtremeBearish-Extreme
NET POSITION MOVEMENT INDEX:
– 6-Week Change in Strength Index:7.5-10.17.0


SUGAR Futures:

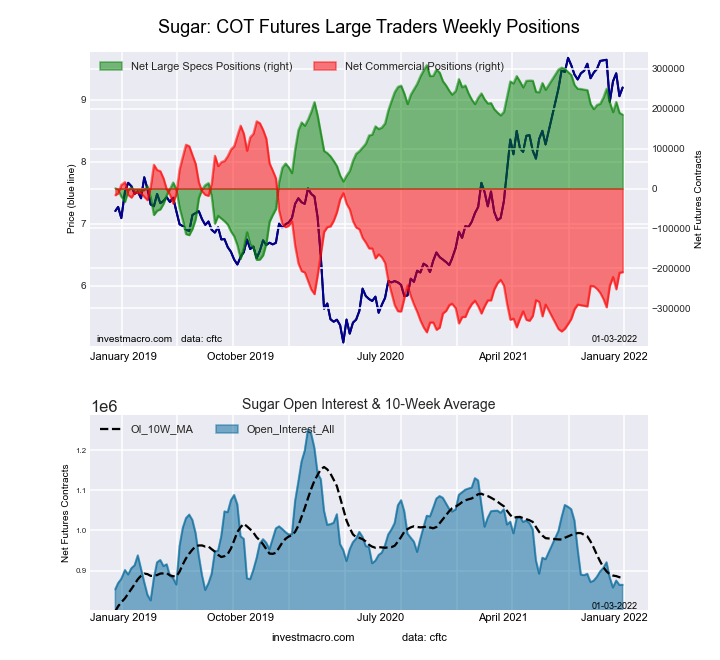
SUGAR Futures COT ChartThe SUGAR large speculator standing this week reached a net position of 184,686 contracts in the data reported through Tuesday. This was a weekly decrease of -4,512 contracts from the previous week which had a total of 189,198 net contracts.

This week’s current strength score (the trader positioning range over the past three years, measured from 0 to 100) shows the speculators are currently Bullish with a score of 74.6 percent. The commercials are Bearish with a score of 28.5 percent and the small traders (not shown in chart) are Bearish with a score of 37.9 percent.

SUGAR Futures StatisticsSPECULATORSCOMMERCIALSSMALL TRADERS
– Percent of Open Interest Longs:27.049.59.1
– Percent of Open Interest Shorts:5.673.76.3
– Net Position:184,686-209,01124,325
– Gross Longs:233,490427,84778,835
– Gross Shorts:48,804636,85854,510
– Long to Short Ratio:4.8 to 10.7 to 11.4 to 1
NET POSITION TREND:
– Strength Index Score (3 Year Range Pct):74.628.537.9
– Strength Index Reading (3 Year Range):BullishBearishBearish
NET POSITION MOVEMENT INDEX:
– 6-Week Change in Strength Index:-8.812.7-30.2


COFFEE Futures:

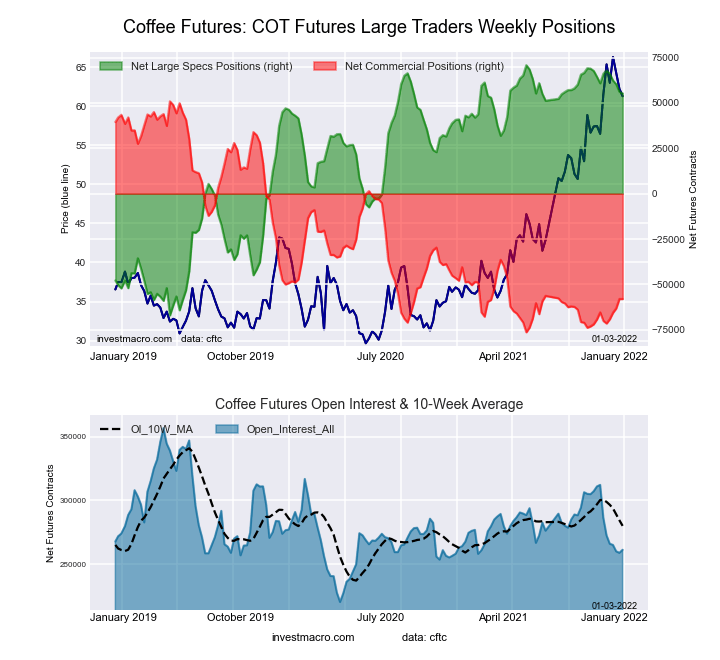
COFFEE Futures COT ChartThe COFFEE large speculator standing this week reached a net position of 55,265 contracts in the data reported through Tuesday. This was a weekly decrease of -869 contracts from the previous week which had a total of 56,134 net contracts.

This week’s current strength score (the trader positioning range over the past three years, measured from 0 to 100) shows the speculators are currently Bullish-Extreme with a score of 88.7 percent. The commercials are Bearish-Extreme with a score of 14.4 percent and the small traders (not shown in chart) are Bearish-Extreme with a score of 7.3 percent.

COFFEE Futures StatisticsSPECULATORSCOMMERCIALSSMALL TRADERS
– Percent of Open Interest Longs:26.548.63.7
– Percent of Open Interest Shorts:5.370.82.6
– Net Position:55,265-58,0152,750
– Gross Longs:69,178127,0689,647
– Gross Shorts:13,913185,0836,897
– Long to Short Ratio:5.0 to 10.7 to 11.4 to 1
NET POSITION TREND:
– Strength Index Score (3 Year Range Pct):88.714.47.3
– Strength Index Reading (3 Year Range):Bullish-ExtremeBearish-ExtremeBearish-Extreme
NET POSITION MOVEMENT INDEX:
– 6-Week Change in Strength Index:-7.99.5-8.6


SOYBEANS Futures:

SOYBEANS Futures COT ChartThe SOYBEANS large speculator standing this week reached a net position of 125,285 contracts in the data reported through Tuesday. This was a weekly lift of 22,408 contracts from the previous week which had a total of 102,877 net contracts.

This week’s current strength score (the trader positioning range over the past three years, measured from 0 to 100) shows the speculators are currently Bullish with a score of 61.3 percent. The commercials are Bearish with a score of 43.9 percent and the small traders (not shown in chart) are Bearish-Extreme with a score of 18.2 percent.

SOYBEANS Futures StatisticsSPECULATORSCOMMERCIALSSMALL TRADERS
– Percent of Open Interest Longs:26.052.57.5
– Percent of Open Interest Shorts:6.666.812.5
– Net Position:125,285-93,079-32,206
– Gross Longs:168,011339,47748,633
– Gross Shorts:42,726432,55680,839
– Long to Short Ratio:3.9 to 10.8 to 10.6 to 1
NET POSITION TREND:
– Strength Index Score (3 Year Range Pct):61.343.918.2
– Strength Index Reading (3 Year Range):BullishBearishBearish-Extreme
NET POSITION MOVEMENT INDEX:
– 6-Week Change in Strength Index:19.3-20.716.3


SOYBEAN MEAL Futures:

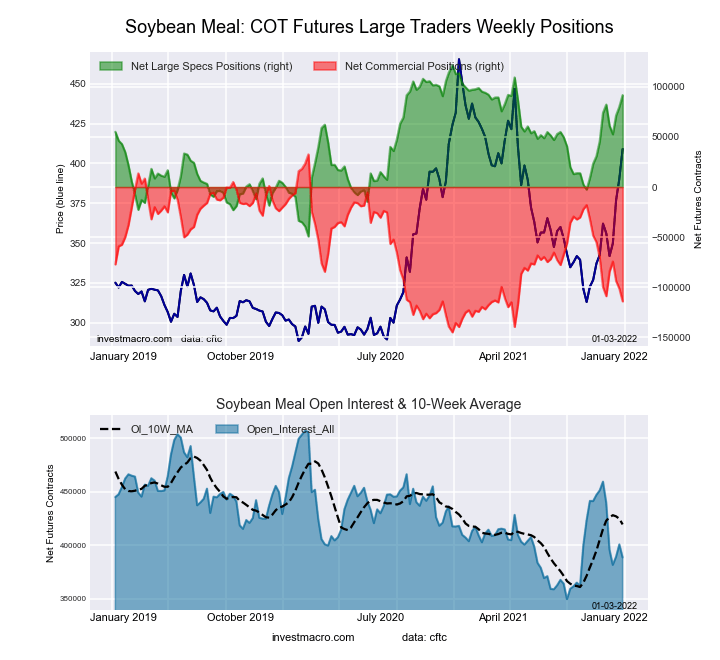
SOYBEAN MEAL Futures COT ChartThe SOYBEAN MEAL large speculator standing this week reached a net position of 91,744 contracts in the data reported through Tuesday. This was a weekly advance of 11,610 contracts from the previous week which had a total of 80,134 net contracts.

This week’s current strength score (the trader positioning range over the past three years, measured from 0 to 100) shows the speculators are currently Bullish-Extreme with a score of 82.5 percent. The commercials are Bearish-Extreme with a score of 17.4 percent and the small traders (not shown in chart) are Bullish with a score of 60.4 percent.

SOYBEAN MEAL Futures StatisticsSPECULATORSCOMMERCIALSSMALL TRADERS
– Percent of Open Interest Longs:28.347.512.2
– Percent of Open Interest Shorts:4.776.96.4
– Net Position:91,744-114,14422,400
– Gross Longs:110,165184,56047,358
– Gross Shorts:18,421298,70424,958
– Long to Short Ratio:6.0 to 10.6 to 11.9 to 1
NET POSITION TREND:
– Strength Index Score (3 Year Range Pct):82.517.460.4
– Strength Index Reading (3 Year Range):Bullish-ExtremeBearish-ExtremeBullish
NET POSITION MOVEMENT INDEX:
– 6-Week Change in Strength Index:10.4-8.0-13.9


LIVE CATTLE Futures:

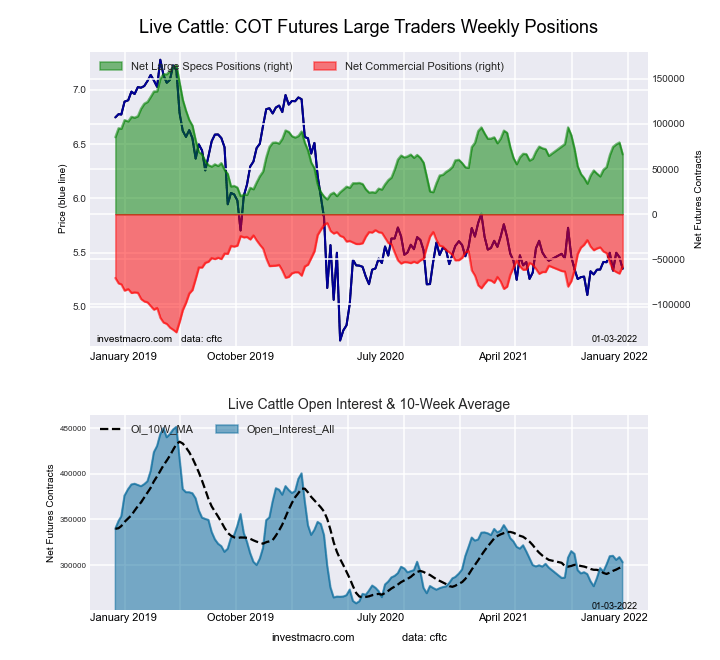
LIVE CATTLE Futures COT ChartThe LIVE CATTLE large speculator standing this week reached a net position of 66,356 contracts in the data reported through Tuesday. This was a weekly decline of -13,158 contracts from the previous week which had a total of 79,514 net contracts.

This week’s current strength score (the trader positioning range over the past three years, measured from 0 to 100) shows the speculators are currently Bearish with a score of 33.6 percent. The commercials are Bullish with a score of 60.4 percent and the small traders (not shown in chart) are Bullish with a score of 66.1 percent.

LIVE CATTLE Futures StatisticsSPECULATORSCOMMERCIALSSMALL TRADERS
– Percent of Open Interest Longs:37.437.310.3
– Percent of Open Interest Shorts:15.556.313.1
– Net Position:66,356-57,712-8,644
– Gross Longs:113,339112,96531,159
– Gross Shorts:46,983170,67739,803
– Long to Short Ratio:2.4 to 10.7 to 10.8 to 1
NET POSITION TREND:
– Strength Index Score (3 Year Range Pct):33.660.466.1
– Strength Index Reading (3 Year Range):BearishBullishBullish
NET POSITION MOVEMENT INDEX:
– 6-Week Change in Strength Index:11.5-13.6-1.7


LEAN HOGS Futures:

LEAN HOGS Futures COT ChartThe LEAN HOGS large speculator standing this week reached a net position of 55,296 contracts in the data reported through Tuesday. This was a weekly increase of 1,094 contracts from the previous week which had a total of 54,202 net contracts.

This week’s current strength score (the trader positioning range over the past three years, measured from 0 to 100) shows the speculators are currently Bullish with a score of 68.2 percent. The commercials are Bearish with a score of 42.1 percent and the small traders (not shown in chart) are Bearish-Extreme with a score of 11.0 percent.

LEAN HOGS Futures StatisticsSPECULATORSCOMMERCIALSSMALL TRADERS
– Percent of Open Interest Longs:40.536.37.4
– Percent of Open Interest Shorts:14.354.915.0
– Net Position:55,296-39,273-16,023
– Gross Longs:85,55976,68615,634
– Gross Shorts:30,263115,95931,657
– Long to Short Ratio:2.8 to 10.7 to 10.5 to 1
NET POSITION TREND:
– Strength Index Score (3 Year Range Pct):68.242.111.0
– Strength Index Reading (3 Year Range):BullishBearishBearish-Extreme
NET POSITION MOVEMENT INDEX:
– 6-Week Change in Strength Index:10.9-11.10.6


COTTON Futures:

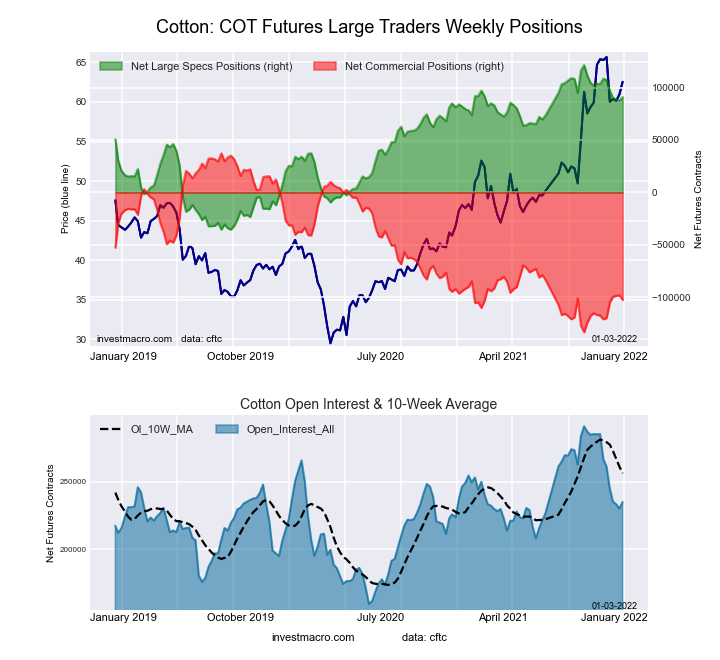
COTTON Futures COT ChartThe COTTON large speculator standing this week reached a net position of 90,889 contracts in the data reported through Tuesday. This was a weekly gain of 3,152 contracts from the previous week which had a total of 87,737 net contracts.

This week’s current strength score (the trader positioning range over the past three years, measured from 0 to 100) shows the speculators are currently Bullish-Extreme with a score of 80.6 percent. The commercials are Bearish-Extreme with a score of 18.0 percent and the small traders (not shown in chart) are Bullish-Extreme with a score of 86.1 percent.

COTTON Futures StatisticsSPECULATORSCOMMERCIALSSMALL TRADERS
– Percent of Open Interest Longs:44.135.37.9
– Percent of Open Interest Shorts:5.478.92.9
– Net Position:90,889-102,51311,624
– Gross Longs:103,56282,80418,544
– Gross Shorts:12,673185,3176,920
– Long to Short Ratio:8.2 to 10.4 to 12.7 to 1
NET POSITION TREND:
– Strength Index Score (3 Year Range Pct):80.618.086.1
– Strength Index Reading (3 Year Range):Bullish-ExtremeBearish-ExtremeBullish-Extreme
NET POSITION MOVEMENT INDEX:
– 6-Week Change in Strength Index:-11.210.8-5.5


COCOA Futures:

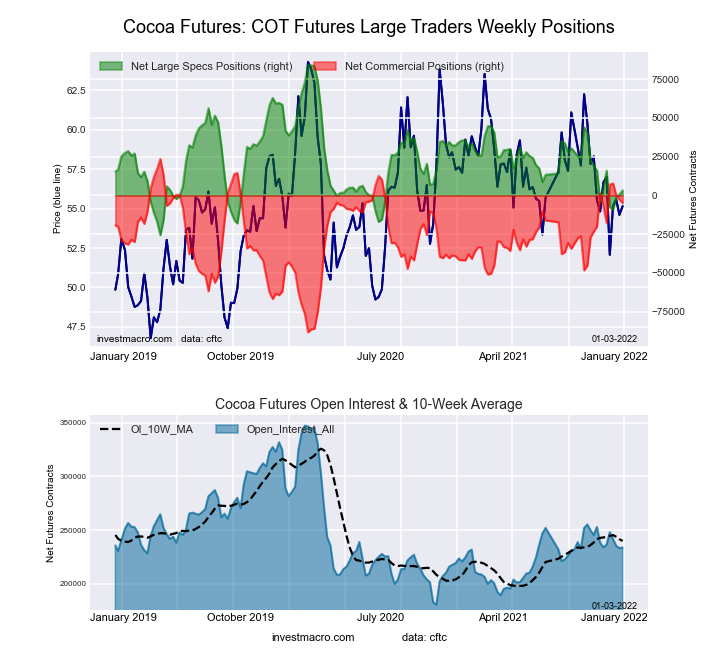
COCOA Futures COT ChartThe COCOA large speculator standing this week reached a net position of 3,250 contracts in the data reported through Tuesday. This was a weekly boost of 2,547 contracts from the previous week which had a total of 703 net contracts.

This week’s current strength score (the trader positioning range over the past three years, measured from 0 to 100) shows the speculators are currently Bearish with a score of 26.3 percent. The commercials are Bullish with a score of 74.5 percent and the small traders (not shown in chart) are Bearish with a score of 27.1 percent.

COCOA Futures StatisticsSPECULATORSCOMMERCIALSSMALL TRADERS
– Percent of Open Interest Longs:25.952.14.9
– Percent of Open Interest Shorts:24.554.24.2
– Net Position:3,250-4,8861,636
– Gross Longs:60,559121,64411,367
– Gross Shorts:57,309126,5309,731
– Long to Short Ratio:1.1 to 11.0 to 11.2 to 1
NET POSITION TREND:
– Strength Index Score (3 Year Range Pct):26.374.527.1
– Strength Index Reading (3 Year Range):BearishBullishBearish
NET POSITION MOVEMENT INDEX:
– 6-Week Change in Strength Index:-1.21.9-10.2


WHEAT Futures:

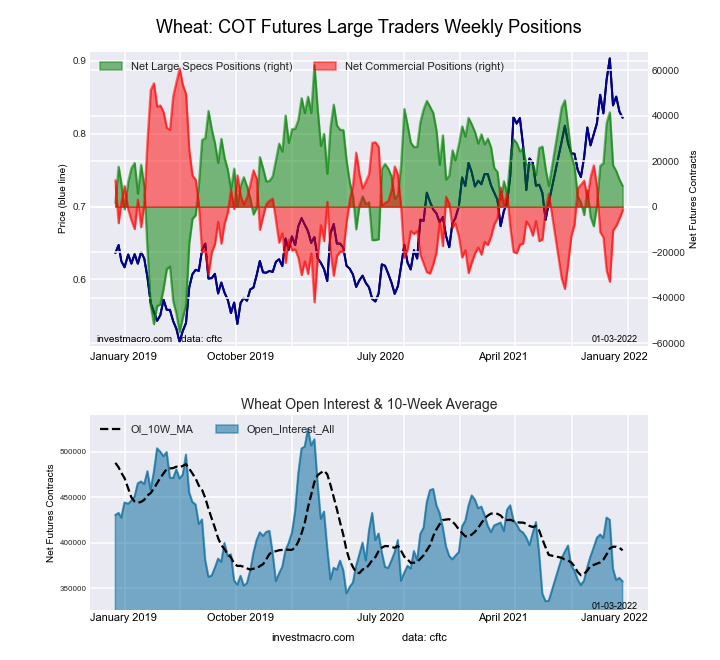
WHEAT Futures COT ChartThe WHEAT large speculator standing this week reached a net position of 9,132 contracts in the data reported through Tuesday. This was a weekly fall of -2,833 contracts from the previous week which had a total of 11,965 net contracts.

This week’s current strength score (the trader positioning range over the past three years, measured from 0 to 100) shows the speculators are currently Bullish with a score of 54.8 percent. The commercials are Bearish with a score of 39.3 percent and the small traders (not shown in chart) are Bullish with a score of 65.6 percent.

WHEAT Futures StatisticsSPECULATORSCOMMERCIALSSMALL TRADERS
– Percent of Open Interest Longs:29.037.68.3
– Percent of Open Interest Shorts:26.538.010.5
– Net Position:9,132-1,601-7,531
– Gross Longs:103,696134,20629,825
– Gross Shorts:94,564135,80737,356
– Long to Short Ratio:1.1 to 11.0 to 10.8 to 1
NET POSITION TREND:
– Strength Index Score (3 Year Range Pct):54.839.365.6
– Strength Index Reading (3 Year Range):BullishBearishBullish
NET POSITION MOVEMENT INDEX:
– 6-Week Change in Strength Index:-8.611.5-8.3


Article By InvestMacroReceive our weekly COT Reports by Email

*COT Report: The COT data, released weekly to the public each Friday, is updated through the most recent Tuesday (data is 3 days old) and shows a quick view of how large speculators or non-commercials (for-profit traders) were positioned in the futures markets.

The CFTC categorizes trader positions according to commercial hedgers (traders who use futures contracts for hedging as part of the business), non-commercials (large traders who speculate to realize trading profits) and nonreportable traders (usually small traders/speculators) as well as their open interest (contracts open in the market at time of reporting).See CFTC criteria here.
COT Currency Speculators boost US Dollar Index bullish bets after 2 down weeks

By InvestMacro | COT | Data Tables | COT Leaders | Downloads | COT Newsletter

Here are the latest charts and statistics for the Commitment of Traders (COT) data published by the Commodities Futures Trading Commission (CFTC). The latest release was delayed by the CFTC due to the Christmas holiday.

The latest COT data is updated through Tuesday December 21st 2021 and shows a quick view of how large traders (for-profit speculators and commercial entities) were positioned in the futures markets. All currency positions are in direct relation to the US dollar where, for example, a bet for the euro is a bet that the euro will rise versus the dollar while a bet against the euro will be a bet that the euro will decline versus the dollar.

Highlighting the COT currency data was the bounce back in the US Dollar Index bullish positions after two straight down weeks. The speculative bets for the dollar index rose by the largest one-week total of the past eleven weeks and brought the overall bullish position back over the +35,000 level. Overall, the dollar index positioning has now been continually bullish since July 6th, a span of twenty-five straight weeks. The last twelve weeks have seen positions above +30,000 net contracts which is the first time that has happened since early 2019.

Joining the US Dollar Index (3,874 contracts) with positive changes last week were the yen (1,237 contracts), Mexican peso (5,881 contracts), Euro (1,717 contracts) and the Canadian dollar (3,251 contracts).

The currencies with declining bets last week were the Russian ruble (-7,903 contracts), Bitcoin (-106 contracts), Brazil real (-1,930 contracts), Swiss franc (-891 contracts), British pound sterling (-6,938 contracts), New Zealand dollar (-275 contracts) and the Australian dollar (-1,451 contracts).


Data Snapshot of Forex Market Traders | Columns Legend
Dec-21-2021OIOI-IndexSpec-NetSpec-IndexCom-NetCOM-IndexSmalls-NetSmalls-Index
USD Index56,1628135,11586-40,33185,21674
EUR672,23973-10,16232-15,6267125,78817
GBP207,74744-57,6863271,12472-13,43828
JPY183,74344-52,2863571,15972-18,8739
CHF40,92015-9,2275415,94549-6,71844
CAD145,56227-9,877477,440562,43735
AUD191,30976-80,354998,03392-17,6799
NZD41,35427-6,136618,86644-2,73021
MXN94,4690-4,792256,38275-1,59036
RUB45,372468,62134-9,877631,25669
BRL30,81128-6,547607,22843-68159
Bitcoin12,85272-8788339083932


US Dollar Index Futures:

US Dollar Index Forex Futures COT ChartThe US Dollar Index large speculator standing this week totaled a net position of 35,115 contracts in the data reported through Tuesday. This was a weekly lift of 3,874 contracts from the previous week which had a total of 31,241 net contracts.

This week’s current strength score (the trader positioning range over the past three years, measured from 0 to 100) shows the speculators are currently Bullish-Extreme with a score of 86.4 percent. The commercials are Bearish-Extreme with a score of 7.6 percent and the small traders (not shown in chart) are Bullish with a score of 73.6 percent.

US DOLLAR INDEX StatisticsSPECULATORSCOMMERCIALSSMALL TRADERS
– Percent of Open Interest Longs:82.33.512.3
– Percent of Open Interest Shorts:19.875.33.0
– Net Position:35,115-40,3315,216
– Gross Longs:46,2221,9416,886
– Gross Shorts:11,10742,2721,670
– Long to Short Ratio:4.2 to 10.0 to 14.1 to 1
NET POSITION TREND:
– Strength Index Score (3 Year Range Pct):86.47.673.6
– Strength Index Reading (3 Year Range):Bullish-ExtremeBearish-ExtremeBullish
NET POSITION MOVEMENT INDEX:
– 6-Week Change in Strength Index:-0.61.3-4.7


Euro Currency Futures:

Euro Currency Futures COT ChartThe Euro Currency large speculator standing this week totaled a net position of -10,162 contracts in the data reported through Tuesday. This was a weekly rise of 1,717 contracts from the previous week which had a total of -11,879 net contracts.

This week’s current strength score (the trader positioning range over the past three years, measured from 0 to 100) shows the speculators are currently Bearish with a score of 31.9 percent. The commercials are Bullish with a score of 71.3 percent and the small traders (not shown in chart) are Bearish-Extreme with a score of 17.1 percent.

EURO Currency StatisticsSPECULATORSCOMMERCIALSSMALL TRADERS
– Percent of Open Interest Longs:29.256.811.8
– Percent of Open Interest Shorts:30.859.17.9
– Net Position:-10,162-15,62625,788
– Gross Longs:196,595381,67079,101
– Gross Shorts:206,757397,29653,313
– Long to Short Ratio:1.0 to 11.0 to 11.5 to 1
NET POSITION TREND:
– Strength Index Score (3 Year Range Pct):31.971.317.1
– Strength Index Reading (3 Year Range):BearishBullishBearish-Extreme
NET POSITION MOVEMENT INDEX:
– 6-Week Change in Strength Index:-4.34.6-4.1


British Pound Sterling Futures:

British Pound Sterling Futures COT ChartThe British Pound Sterling large speculator standing this week totaled a net position of -57,686 contracts in the data reported through Tuesday. This was a weekly reduction of -6,938 contracts from the previous week which had a total of -50,748 net contracts.

This week’s current strength score (the trader positioning range over the past three years, measured from 0 to 100) shows the speculators are currently Bearish with a score of 32.4 percent. The commercials are Bullish with a score of 71.7 percent and the small traders (not shown in chart) are Bearish with a score of 27.8 percent.

BRITISH POUND StatisticsSPECULATORSCOMMERCIALSSMALL TRADERS
– Percent of Open Interest Longs:10.078.810.2
– Percent of Open Interest Shorts:37.844.516.7
– Net Position:-57,68671,124-13,438
– Gross Longs:20,824163,61921,240
– Gross Shorts:78,51092,49534,678
– Long to Short Ratio:0.3 to 11.8 to 10.6 to 1
NET POSITION TREND:
– Strength Index Score (3 Year Range Pct):32.471.727.8
– Strength Index Reading (3 Year Range):BearishBullishBearish
NET POSITION MOVEMENT INDEX:
– 6-Week Change in Strength Index:-32.931.7-16.5


Japanese Yen Futures:

Japanese Yen Forex Futures COT ChartThe Japanese Yen large speculator standing this week totaled a net position of -52,286 contracts in the data reported through Tuesday. This was a weekly increase of 1,237 contracts from the previous week which had a total of -53,523 net contracts.

This week’s current strength score (the trader positioning range over the past three years, measured from 0 to 100) shows the speculators are currently Bearish with a score of 35.0 percent. The commercials are Bullish with a score of 71.5 percent and the small traders (not shown in chart) are Bearish-Extreme with a score of 9.0 percent.

JAPANESE YEN StatisticsSPECULATORSCOMMERCIALSSMALL TRADERS
– Percent of Open Interest Longs:12.177.49.2
– Percent of Open Interest Shorts:40.538.619.5
– Net Position:-52,28671,159-18,873
– Gross Longs:22,191142,16116,916
– Gross Shorts:74,47771,00235,789
– Long to Short Ratio:0.3 to 12.0 to 10.5 to 1
NET POSITION TREND:
– Strength Index Score (3 Year Range Pct):35.071.59.0
– Strength Index Reading (3 Year Range):BearishBullishBearish-Extreme
NET POSITION MOVEMENT INDEX:
– 6-Week Change in Strength Index:33.6-25.8-2.2


Swiss Franc Futures:

Swiss Franc Forex Futures COT ChartThe Swiss Franc large speculator standing this week totaled a net position of -9,227 contracts in the data reported through Tuesday. This was a weekly decrease of -891 contracts from the previous week which had a total of -8,336 net contracts.

This week’s current strength score (the trader positioning range over the past three years, measured from 0 to 100) shows the speculators are currently Bullish with a score of 53.8 percent. The commercials are Bearish with a score of 48.8 percent and the small traders (not shown in chart) are Bearish with a score of 43.6 percent.

SWISS FRANC StatisticsSPECULATORSCOMMERCIALSSMALL TRADERS
– Percent of Open Interest Longs:6.066.827.0
– Percent of Open Interest Shorts:28.627.943.4
– Net Position:-9,22715,945-6,718
– Gross Longs:2,46027,34411,046
– Gross Shorts:11,68711,39917,764
– Long to Short Ratio:0.2 to 12.4 to 10.6 to 1
NET POSITION TREND:
– Strength Index Score (3 Year Range Pct):53.848.843.6
– Strength Index Reading (3 Year Range):BullishBearishBearish
NET POSITION MOVEMENT INDEX:
– 6-Week Change in Strength Index:13.7-5.2-9.5


Canadian Dollar Futures:

Canadian Dollar Forex Futures COT ChartThe Canadian Dollar large speculator standing this week totaled a net position of -9,877 contracts in the data reported through Tuesday. This was a weekly advance of 3,251 contracts from the previous week which had a total of -13,128 net contracts.

This week’s current strength score (the trader positioning range over the past three years, measured from 0 to 100) shows the speculators are currently Bearish with a score of 46.8 percent. The commercials are Bullish with a score of 56.3 percent and the small traders (not shown in chart) are Bearish with a score of 34.6 percent.

CANADIAN DOLLAR StatisticsSPECULATORSCOMMERCIALSSMALL TRADERS
– Percent of Open Interest Longs:31.645.720.2
– Percent of Open Interest Shorts:38.340.618.6
– Net Position:-9,8777,4402,437
– Gross Longs:45,92566,48329,450
– Gross Shorts:55,80259,04327,013
– Long to Short Ratio:0.8 to 11.1 to 11.1 to 1
NET POSITION TREND:
– Strength Index Score (3 Year Range Pct):46.856.334.6
– Strength Index Reading (3 Year Range):BearishBullishBearish
NET POSITION MOVEMENT INDEX:
– 6-Week Change in Strength Index:-12.521.3-38.0


Australian Dollar Futures:

Australian Dollar Forex Futures COT ChartThe Australian Dollar large speculator standing this week totaled a net position of -80,354 contracts in the data reported through Tuesday. This was a weekly lowering of -1,451 contracts from the previous week which had a total of -78,903 net contracts.

This week’s current strength score (the trader positioning range over the past three years, measured from 0 to 100) shows the speculators are currently Bearish-Extreme with a score of 9.1 percent. The commercials are Bullish-Extreme with a score of 92.0 percent and the small traders (not shown in chart) are Bearish-Extreme with a score of 9.3 percent.

AUSTRALIAN DOLLAR StatisticsSPECULATORSCOMMERCIALSSMALL TRADERS
– Percent of Open Interest Longs:12.077.88.4
– Percent of Open Interest Shorts:54.026.617.6
– Net Position:-80,35498,033-17,679
– Gross Longs:22,958148,85916,070
– Gross Shorts:103,31250,82633,749
– Long to Short Ratio:0.2 to 12.9 to 10.5 to 1
NET POSITION TREND:
– Strength Index Score (3 Year Range Pct):9.192.09.3
– Strength Index Reading (3 Year Range):Bearish-ExtremeBullish-ExtremeBearish-Extreme
NET POSITION MOVEMENT INDEX:
– 6-Week Change in Strength Index:-15.923.8-36.4


New Zealand Dollar Futures:

New Zealand Dollar Forex Futures COT ChartThe New Zealand Dollar large speculator standing this week totaled a net position of -6,136 contracts in the data reported through Tuesday. This was a weekly lowering of -275 contracts from the previous week which had a total of -5,861 net contracts.

This week’s current strength score (the trader positioning range over the past three years, measured from 0 to 100) shows the speculators are currently Bullish with a score of 61.0 percent. The commercials are Bearish with a score of 44.1 percent and the small traders (not shown in chart) are Bearish with a score of 20.6 percent.

NEW ZEALAND DOLLAR StatisticsSPECULATORSCOMMERCIALSSMALL TRADERS
– Percent of Open Interest Longs:26.764.96.8
– Percent of Open Interest Shorts:41.643.413.4
– Net Position:-6,1368,866-2,730
– Gross Longs:11,05026,8192,809
– Gross Shorts:17,18617,9535,539
– Long to Short Ratio:0.6 to 11.5 to 10.5 to 1
NET POSITION TREND:
– Strength Index Score (3 Year Range Pct):61.044.120.6
– Strength Index Reading (3 Year Range):BullishBearishBearish
NET POSITION MOVEMENT INDEX:
– 6-Week Change in Strength Index:-31.937.0-57.1


Mexican Peso Futures:

Mexican Peso Futures COT ChartThe Mexican Peso large speculator standing this week totaled a net position of -4,792 contracts in the data reported through Tuesday. This was a weekly rise of 5,881 contracts from the previous week which had a total of -10,673 net contracts.

This week’s current strength score (the trader positioning range over the past three years, measured from 0 to 100) shows the speculators are currently Bearish with a score of 25.3 percent. The commercials are Bullish with a score of 75.5 percent and the small traders (not shown in chart) are Bearish with a score of 36.3 percent.

MEXICAN PESO StatisticsSPECULATORSCOMMERCIALSSMALL TRADERS
– Percent of Open Interest Longs:31.863.83.8
– Percent of Open Interest Shorts:36.957.15.5
– Net Position:-4,7926,382-1,590
– Gross Longs:30,02160,3003,563
– Gross Shorts:34,81353,9185,153
– Long to Short Ratio:0.9 to 11.1 to 10.7 to 1
NET POSITION TREND:
– Strength Index Score (3 Year Range Pct):25.375.536.3
– Strength Index Reading (3 Year Range):BearishBullishBearish
NET POSITION MOVEMENT INDEX:
– 6-Week Change in Strength Index:18.6-16.4-18.3


Brazilian Real Futures:

Brazil Real Futures COT ChartThe Brazilian Real large speculator standing this week totaled a net position of -6,547 contracts in the data reported through Tuesday. This was a weekly decrease of -1,930 contracts from the previous week which had a total of -4,617 net contracts.

This week’s current strength score (the trader positioning range over the past three years, measured from 0 to 100) shows the speculators are currently Bullish with a score of 59.9 percent. The commercials are Bearish with a score of 43.1 percent and the small traders (not shown in chart) are Bullish with a score of 58.6 percent.

BRAZIL REAL StatisticsSPECULATORSCOMMERCIALSSMALL TRADERS
– Percent of Open Interest Longs:33.259.17.3
– Percent of Open Interest Shorts:54.435.69.5
– Net Position:-6,5477,228-681
– Gross Longs:10,21718,1962,241
– Gross Shorts:16,76410,9682,922
– Long to Short Ratio:0.6 to 11.7 to 10.8 to 1
NET POSITION TREND:
– Strength Index Score (3 Year Range Pct):59.943.158.6
– Strength Index Reading (3 Year Range):BullishBearishBullish
NET POSITION MOVEMENT INDEX:
– 6-Week Change in Strength Index:11.9-11.6-2.3


Russian Ruble Futures:

Russian Ruble Futures COT ChartThe Russian Ruble large speculator standing this week totaled a net position of 8,621 contracts in the data reported through Tuesday. This was a weekly decrease of -7,903 contracts from the previous week which had a total of 16,524 net contracts.

This week’s current strength score (the trader positioning range over the past three years, measured from 0 to 100) shows the speculators are currently Bearish with a score of 33.8 percent. The commercials are Bullish with a score of 62.9 percent and the small traders (not shown in chart) are Bullish with a score of 68.7 percent.

RUSSIAN RUBLE StatisticsSPECULATORSCOMMERCIALSSMALL TRADERS
– Percent of Open Interest Longs:41.753.35.0
– Percent of Open Interest Shorts:22.775.12.2
– Net Position:8,621-9,8771,256
– Gross Longs:18,94224,1772,253
– Gross Shorts:10,32134,054997
– Long to Short Ratio:1.8 to 10.7 to 12.3 to 1
NET POSITION TREND:
– Strength Index Score (3 Year Range Pct):33.862.968.7
– Strength Index Reading (3 Year Range):BearishBullishBullish
NET POSITION MOVEMENT INDEX:
– 6-Week Change in Strength Index:-28.629.6-22.7


Bitcoin Futures:

Bitcoin Crypto Futures COT ChartThe Bitcoin large speculator standing this week totaled a net position of -878 contracts in the data reported through Tuesday. This was a weekly lowering of -106 contracts from the previous week which had a total of -772 net contracts.

This week’s current strength score (the trader positioning range over the past three years, measured from 0 to 100) shows the speculators are currently Bullish-Extreme with a score of 82.8 percent. The commercials are Bearish with a score of 34.3 percent and the small traders (not shown in chart) are Bearish with a score of 32.0 percent.

BITCOIN StatisticsSPECULATORSCOMMERCIALSSMALL TRADERS
– Percent of Open Interest Longs:66.93.213.7
– Percent of Open Interest Shorts:73.72.97.1
– Net Position:-87839839
– Gross Longs:8,5944081,755
– Gross Shorts:9,472369916
– Long to Short Ratio:0.9 to 11.1 to 11.9 to 1
NET POSITION TREND:
– Strength Index Score (3 Year Range Pct):82.834.332.0
– Strength Index Reading (3 Year Range):Bullish-ExtremeBearishBearish
NET POSITION MOVEMENT INDEX:
– 6-Week Change in Strength Index:13.8-17.5-9.2


Article By InvestMacroReceive our weekly COT Reports by Email

*COT Report: The COT data, released weekly to the public each Friday, is updated through the most recent Tuesday (data is 3 days old) and shows a quick view of how large speculators or non-commercials (for-profit traders) were positioned in the futures markets.

The CFTC categorizes trader positions according to commercial hedgers (traders who use futures contracts for hedging as part of the business), non-commercials (large traders who speculate to realize trading profits) and nonreportable traders (usually small traders/speculators) as well as their open interest (contracts open in the market at time of reporting).See CFTC criteria here.
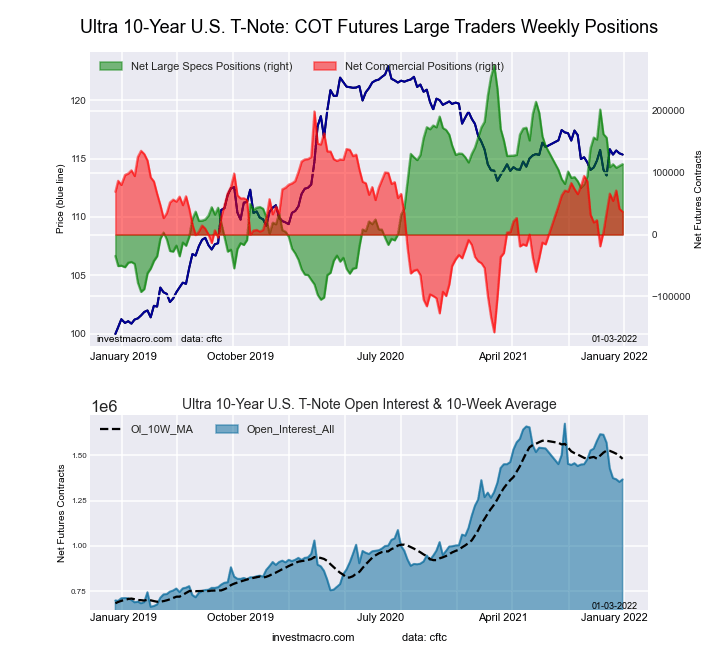
COT Bonds Speculators drop 10-Year Treasury Notes to most bearish in past 97 weeks

By InvestMacro | COT | Data Tables | COT Leaders | Downloads | COT Newsletter

Here are the latest charts and statistics for the Commitment of Traders (COT) data published by the Commodities Futures Trading Commission (CFTC). The latest release was delayed by the CFTC due to the Christmas holiday.

The latest COT data is updated through Tuesday December 21st 2021 and shows a quick view of how large traders (for-profit speculators and commercial entities) were positioned in the futures markets.

Highlighting the COT bonds data is the sharp drop in the 10-Year Bond futures. Speculator positioning in the 10-Year has fallen for two straight weeks and last week’s sharp decline marked the largest one-week fall of the past seven weeks. The weakness in speculator sentiment has pushed the current level (-339,299 contracts) to the most bearish level of the past ninety-seven weeks, dating all the way back to February 11th of 2020. The 10-Year contracts have also fallen into a bearish-extreme reading in the speculator strength index with a score of 19.8 percent (current level compared to past 3-year range, with below 20 percent equaling an extreme bearish score).

The bond markets with rising contracts last week were the 2-Year Bond (34,135 contracts), Ultra 10-Year (2,891 contracts) and the Long US Bond (1,234 contracts) while decreasing bets for the week were seen in Eurodollar (-92,289 contracts), 10-Year (-65,443 contracts), FedFunds (-117 contracts), 5-Year (-6,573 contracts) and the Ultra US Bond (-5,088 contracts).


Data Snapshot of Bond Market Traders | Columns Legend
Dec-21-2021OIOI-IndexSpec-NetSpec-IndexCom-NetCOM-IndexSmalls-NetSmalls-Index
Eurodollar11,105,89547-1,814,82032,164,52693-349,70637
FedFunds1,368,54229-89,42929106,59873-17,16919
2-Year1,970,102879,333100-10,36618-68,9671
Long T-Bond1,225,02953-36,0848012,0742424,01072
10-Year3,798,26750-339,29920572,56393-233,26424
5-Year3,604,05227-346,37619595,08194-248,70513


3-Month Eurodollars Futures:

Eurodollar Bonds Futures COT ChartThe 3-Month Eurodollars large speculator standing this week reached a net position of -1,814,820 contracts in the data reported through Tuesday. This was a weekly decrease of -92,289 contracts from the previous week which had a total of -1,722,531 net contracts.

This week’s current strength score (the trader positioning range over the past three years, measured from 0 to 100) shows the speculators are currently Bearish-Extreme with a score of 3.1 percent. The commercials are Bullish-Extreme with a score of 93.1 percent and the small traders (not shown in chart) are Bearish with a score of 37.1 percent.

3-Month Eurodollars StatisticsSPECULATORSCOMMERCIALSSMALL TRADERS
– Percent of Open Interest Longs:7.871.34.2
– Percent of Open Interest Shorts:24.151.87.4
– Net Position:-1,814,8202,164,526-349,706
– Gross Longs:861,9647,913,862466,971
– Gross Shorts:2,676,7845,749,336816,677
– Long to Short Ratio:0.3 to 11.4 to 10.6 to 1
NET POSITION TREND:
– Strength Index Score (3 Year Range Pct):3.193.137.1
– Strength Index Reading (3 Year Range):Bearish-ExtremeBullish-ExtremeBearish
NET POSITION MOVEMENT INDEX:
– 6-Week Change in Strength Index:-18.717.31.9


30-Day Federal Funds Futures:

Federal Funds 30-Day Bonds Futures COT ChartThe 30-Day Federal Funds large speculator standing this week reached a net position of -89,429 contracts in the data reported through Tuesday. This was a weekly reduction of -117 contracts from the previous week which had a total of -89,312 net contracts.

This week’s current strength score (the trader positioning range over the past three years, measured from 0 to 100) shows the speculators are currently Bearish with a score of 28.6 percent. The commercials are Bullish with a score of 72.8 percent and the small traders (not shown in chart) are Bearish-Extreme with a score of 19.2 percent.

30-Day Federal Funds StatisticsSPECULATORSCOMMERCIALSSMALL TRADERS
– Percent of Open Interest Longs:3.282.71.6
– Percent of Open Interest Shorts:9.874.92.9
– Net Position:-89,429106,598-17,169
– Gross Longs:44,1071,131,98821,886
– Gross Shorts:133,5361,025,39039,055
– Long to Short Ratio:0.3 to 11.1 to 10.6 to 1
NET POSITION TREND:
– Strength Index Score (3 Year Range Pct):28.672.819.2
– Strength Index Reading (3 Year Range):BearishBullishBearish-Extreme
NET POSITION MOVEMENT INDEX:
– 6-Week Change in Strength Index:-2.73.6-19.4


2-Year Treasury Note Futures:

2-Year Treasury Bonds Futures COT ChartThe 2-Year Treasury Note large speculator standing this week reached a net position of 79,333 contracts in the data reported through Tuesday. This was a weekly gain of 34,135 contracts from the previous week which had a total of 45,198 net contracts.

This week’s current strength score (the trader positioning range over the past three years, measured from 0 to 100) shows the speculators are currently Bullish-Extreme with a score of 100.0 percent. The commercials are Bearish-Extreme with a score of 17.6 percent and the small traders (not shown in chart) are Bearish-Extreme with a score of 1.4 percent.

2-Year Treasury Note StatisticsSPECULATORSCOMMERCIALSSMALL TRADERS
– Percent of Open Interest Longs:21.067.46.2
– Percent of Open Interest Shorts:17.067.99.7
– Net Position:79,333-10,366-68,967
– Gross Longs:413,9051,327,923122,871
– Gross Shorts:334,5721,338,289191,838
– Long to Short Ratio:1.2 to 11.0 to 10.6 to 1
NET POSITION TREND:
– Strength Index Score (3 Year Range Pct):100.017.61.4
– Strength Index Reading (3 Year Range):Bullish-ExtremeBearish-ExtremeBearish-Extreme
NET POSITION MOVEMENT INDEX:
– 6-Week Change in Strength Index:19.7-17.2-8.9


5-Year Treasury Note Futures:

5-Year Treasury Bonds Futures COT ChartThe 5-Year Treasury Note large speculator standing this week reached a net position of -346,376 contracts in the data reported through Tuesday. This was a weekly lowering of -6,573 contracts from the previous week which had a total of -339,803 net contracts.

This week’s current strength score (the trader positioning range over the past three years, measured from 0 to 100) shows the speculators are currently Bearish-Extreme with a score of 19.4 percent. The commercials are Bullish-Extreme with a score of 94.3 percent and the small traders (not shown in chart) are Bearish-Extreme with a score of 12.8 percent.

5-Year Treasury Note StatisticsSPECULATORSCOMMERCIALSSMALL TRADERS
– Percent of Open Interest Longs:7.382.57.0
– Percent of Open Interest Shorts:16.966.013.9
– Net Position:-346,376595,081-248,705
– Gross Longs:263,2682,974,180252,720
– Gross Shorts:609,6442,379,099501,425
– Long to Short Ratio:0.4 to 11.3 to 10.5 to 1
NET POSITION TREND:
– Strength Index Score (3 Year Range Pct):19.494.312.8
– Strength Index Reading (3 Year Range):Bearish-ExtremeBullish-ExtremeBearish-Extreme
NET POSITION MOVEMENT INDEX:
– 6-Week Change in Strength Index:11.1-5.7-5.1


10-Year Treasury Note Futures:

10-Year Treasury Notes Bonds Futures COT ChartThe 10-Year Treasury Note large speculator standing this week reached a net position of -339,299 contracts in the data reported through Tuesday. This was a weekly fall of -65,443 contracts from the previous week which had a total of -273,856 net contracts.

This week’s current strength score (the trader positioning range over the past three years, measured from 0 to 100) shows the speculators are currently Bearish-Extreme with a score of 19.8 percent. The commercials are Bullish-Extreme with a score of 93.4 percent and the small traders (not shown in chart) are Bearish with a score of 24.3 percent.

10-Year Treasury Note StatisticsSPECULATORSCOMMERCIALSSMALL TRADERS
– Percent of Open Interest Longs:11.678.27.9
– Percent of Open Interest Shorts:20.563.114.1
– Net Position:-339,299572,563-233,264
– Gross Longs:438,8142,968,460301,484
– Gross Shorts:778,1132,395,897534,748
– Long to Short Ratio:0.6 to 11.2 to 10.6 to 1
NET POSITION TREND:
– Strength Index Score (3 Year Range Pct):19.893.424.3
– Strength Index Reading (3 Year Range):Bearish-ExtremeBullish-ExtremeBearish
NET POSITION MOVEMENT INDEX:
– 6-Week Change in Strength Index:-11.10.016.7


Ultra 10-Year Notes Futures:

Ultra 10-Year Treasury Notes Bonds Futures COT ChartThe Ultra 10-Year Notes large speculator standing this week reached a net position of 110,912 contracts in the data reported through Tuesday. This was a weekly lift of 2,891 contracts from the previous week which had a total of 108,021 net contracts.

This week’s current strength score (the trader positioning range over the past three years, measured from 0 to 100) shows the speculators are currently Bullish with a score of 57.0 percent. The commercials are Bullish with a score of 55.9 percent and the small traders (not shown in chart) are Bearish with a score of 23.6 percent.

Ultra 10-Year Notes StatisticsSPECULATORSCOMMERCIALSSMALL TRADERS
– Percent of Open Interest Longs:19.271.28.5
– Percent of Open Interest Shorts:11.068.219.8
– Net Position:110,91241,687-152,599
– Gross Longs:259,469964,154115,340
– Gross Shorts:148,557922,467267,939
– Long to Short Ratio:1.7 to 11.0 to 10.4 to 1
NET POSITION TREND:
– Strength Index Score (3 Year Range Pct):57.055.923.6
– Strength Index Reading (3 Year Range):BullishBullishBearish
NET POSITION MOVEMENT INDEX:
– 6-Week Change in Strength Index:-24.117.018.3


US Treasury Bonds Futures:

US Year Treasury Notes Long Bonds Futures COT ChartThe US Treasury Bonds large speculator standing this week reached a net position of -36,084 contracts in the data reported through Tuesday. This was a weekly boost of 1,234 contracts from the previous week which had a total of -37,318 net contracts.

This week’s current strength score (the trader positioning range over the past three years, measured from 0 to 100) shows the speculators are currently Bullish-Extreme with a score of 80.5 percent. The commercials are Bearish with a score of 24.0 percent and the small traders (not shown in chart) are Bullish with a score of 71.6 percent.

US Treasury Bonds StatisticsSPECULATORSCOMMERCIALSSMALL TRADERS
– Percent of Open Interest Longs:12.071.515.2
– Percent of Open Interest Shorts:15.070.513.2
– Net Position:-36,08412,07424,010
– Gross Longs:147,408875,599185,627
– Gross Shorts:183,492863,525161,617
– Long to Short Ratio:0.8 to 11.0 to 11.1 to 1
NET POSITION TREND:
– Strength Index Score (3 Year Range Pct):80.524.071.6
– Strength Index Reading (3 Year Range):Bullish-ExtremeBearishBullish
NET POSITION MOVEMENT INDEX:
– 6-Week Change in Strength Index:-2.90.64.9


Ultra US Treasury Bonds Futures:

Ultra US Year Treasury Notes Long Bonds Futures COT ChartThe Ultra US Treasury Bonds large speculator standing this week reached a net position of -297,561 contracts in the data reported through Tuesday. This was a weekly fall of -5,088 contracts from the previous week which had a total of -292,473 net contracts.

This week’s current strength score (the trader positioning range over the past three years, measured from 0 to 100) shows the speculators are currently Bullish with a score of 63.8 percent. The commercials are Bearish with a score of 44.6 percent and the small traders (not shown in chart) are Bullish with a score of 51.6 percent.

Ultra US Treasury Bonds StatisticsSPECULATORSCOMMERCIALSSMALL TRADERS
– Percent of Open Interest Longs:6.680.112.8
– Percent of Open Interest Shorts:30.359.010.2
– Net Position:-297,561265,00332,558
– Gross Longs:83,0431,004,474160,841
– Gross Shorts:380,604739,471128,283
– Long to Short Ratio:0.2 to 11.4 to 11.3 to 1
NET POSITION TREND:
– Strength Index Score (3 Year Range Pct):63.844.651.6
– Strength Index Reading (3 Year Range):BullishBearishBullish
NET POSITION MOVEMENT INDEX:
– 6-Week Change in Strength Index:1.3-13.116.8


Article By InvestMacroReceive our weekly COT Reports by Email

*COT Report: The COT data, released weekly to the public each Friday, is updated through the most recent Tuesday (data is 3 days old) and shows a quick view of how large speculators or non-commercials (for-profit traders) were positioned in the futures markets.

The CFTC categorizes trader positions according to commercial hedgers (traders who use futures contracts for hedging as part of the business), non-commercials (large traders who speculate to realize trading profits) and nonreportable traders (usually small traders/speculators) as well as their open interest (contracts open in the market at time of reporting).See CFTC criteria here.
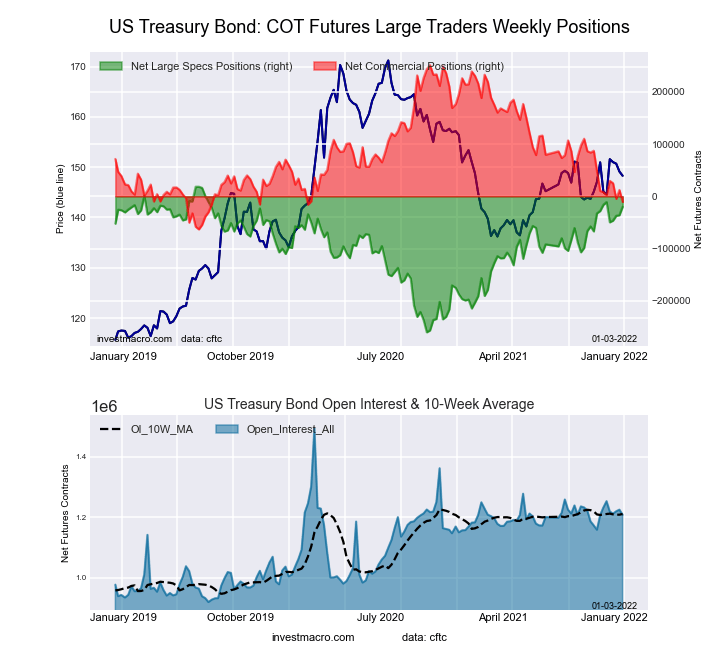
COT Metals Speculators push Copper bullish bets lower for 9th week to 81-week low

By InvestMacro | COT | Data Tables | COT Leaders | Downloads | COT Newsletter

Here are the latest charts and statistics for the Commitment of Traders (COT) data published by the Commodities Futures Trading Commission (CFTC). The latest release was delayed by the CFTC due to the Christmas holiday.

The latest COT data is updated through Tuesday December 21st 2021 and shows a quick view of how large traders (for-profit speculators and commercial entities) were positioned in the futures markets.

Highlighting the COT metals data is the continued decline in the Copper futures bets. The speculative net position in the Copper futures has now decreased for nine consecutive weeks and by a total of -36,147 contracts over that time-frame. This weakness has brought the current standing for Copper net positions to the least bullish level since June 2nd of 2020, a span of eighty-one weeks. Speculators had been raising their positions for Copper starting in June 2020 with positioning reaching a multi-year high of +80,039 contracts on December 8th of 2020. The overall position has remained in bullish territory throughout 2021 but has dropped to an overall level of just +4,437 contracts last week.

Joining Copper (-2,260 contracts) in declining on the week were Silver (-1,058 contracts), Platinum (-2,463 contracts) while Gold (3,410 contracts) and Palladium (135 contracts) had higher weekly speculative positions.


Data Snapshot of Commodity Market Traders | Columns Legend
Dec-21-2021OIOI-IndexSpec-NetSpec-IndexCom-NetCOM-IndexSmalls-NetSmalls-Index
WTI Crude1,892,7010340,25520-375,8167035,56165
Gold500,84619205,81153-236,0294630,21850
Silver141,119820,92643-36,3996315,47330
Copper170,35354,43746-9,777535,34056
Palladium9,51814-3,63913,98599-34624
Platinum64,732301,2684-7,717986,44952
Natural Gas1,142,7294-141,21236109,5516531,66159
Brent224,11058-25,0017622,225262,77647
Heating Oil302,72134,89750-21,0604916,16354
Soybeans654,46011102,87756-72,35249-30,52521
Corn1,485,41219445,32087-401,28015-44,04018
Coffee258,8712856,13489-57,984141,8501
Sugar864,0829189,19875-210,7832821,58535
Wheat357,381119,13255-1,60139-7,53166


Gold Comex Futures:

Gold Futures COT ChartThe Gold Comex Futures large speculator standing this week equaled a net position of 205,811 contracts in the data reported through Tuesday. This was a weekly boost of 3,410 contracts from the previous week which had a total of 202,401 net contracts.

This week’s current strength score (the trader positioning range over the past three years, measured from 0 to 100) shows the speculators are currently Bullish with a score of 53.3 percent. The commercials are Bearish with a score of 45.6 percent and the small traders (not shown in chart) are Bearish with a score of 49.9 percent.

Gold Futures StatisticsSPECULATORSCOMMERCIALSSMALL TRADERS
– Percent of Open Interest Longs:59.221.09.8
– Percent of Open Interest Shorts:18.168.13.8
– Net Position:205,811-236,02930,218
– Gross Longs:296,628104,99749,251
– Gross Shorts:90,817341,02619,033
– Long to Short Ratio:3.3 to 10.3 to 12.6 to 1
NET POSITION TREND:
– Strength Index Score (3 Year Range Pct):53.345.649.9
– Strength Index Reading (3 Year Range):BullishBearishBearish
NET POSITION MOVEMENT INDEX:
– 6-Week Change in Strength Index:-14.012.014.0


Silver Comex Futures:

Silver Futures COT ChartThe Silver Comex Futures large speculator standing this week equaled a net position of 20,926 contracts in the data reported through Tuesday. This was a weekly fall of -1,058 contracts from the previous week which had a total of 21,984 net contracts.

This week’s current strength score (the trader positioning range over the past three years, measured from 0 to 100) shows the speculators are currently Bearish with a score of 43.2 percent. The commercials are Bullish with a score of 63.2 percent and the small traders (not shown in chart) are Bearish with a score of 30.5 percent.

Silver Futures StatisticsSPECULATORSCOMMERCIALSSMALL TRADERS
– Percent of Open Interest Longs:44.030.319.3
– Percent of Open Interest Shorts:29.256.18.3
– Net Position:20,926-36,39915,473
– Gross Longs:62,07042,74227,251
– Gross Shorts:41,14479,14111,778
– Long to Short Ratio:1.5 to 10.5 to 12.3 to 1
NET POSITION TREND:
– Strength Index Score (3 Year Range Pct):43.263.230.5
– Strength Index Reading (3 Year Range):BearishBullishBearish
NET POSITION MOVEMENT INDEX:
– 6-Week Change in Strength Index:-15.916.9-7.7


Copper Grade #1 Futures:

Copper Futures COT ChartThe Copper Grade #1 Futures large speculator standing this week equaled a net position of 4,437 contracts in the data reported through Tuesday. This was a weekly lowering of -2,260 contracts from the previous week which had a total of 6,697 net contracts.

This week’s current strength score (the trader positioning range over the past three years, measured from 0 to 100) shows the speculators are currently Bearish with a score of 45.6 percent. The commercials are Bullish with a score of 52.7 percent and the small traders (not shown in chart) are Bullish with a score of 56.2 percent.

Copper Futures StatisticsSPECULATORSCOMMERCIALSSMALL TRADERS
– Percent of Open Interest Longs:35.845.79.7
– Percent of Open Interest Shorts:33.251.46.5
– Net Position:4,437-9,7775,340
– Gross Longs:60,98377,85116,453
– Gross Shorts:56,54687,62811,113
– Long to Short Ratio:1.1 to 10.9 to 11.5 to 1
NET POSITION TREND:
– Strength Index Score (3 Year Range Pct):45.652.756.2
– Strength Index Reading (3 Year Range):BearishBullishBullish
NET POSITION MOVEMENT INDEX:
– 6-Week Change in Strength Index:-13.216.1-29.3


Platinum Futures:

Platinum Futures COT ChartThe Platinum Futures large speculator standing this week equaled a net position of 1,268 contracts in the data reported through Tuesday. This was a weekly reduction of -2,463 contracts from the previous week which had a total of 3,731 net contracts.

This week’s current strength score (the trader positioning range over the past three years, measured from 0 to 100) shows the speculators are currently Bearish-Extreme with a score of 4.2 percent. The commercials are Bullish-Extreme with a score of 98.0 percent and the small traders (not shown in chart) are Bullish with a score of 52.0 percent.

Platinum Futures StatisticsSPECULATORSCOMMERCIALSSMALL TRADERS
– Percent of Open Interest Longs:43.737.715.3
– Percent of Open Interest Shorts:41.849.65.3
– Net Position:1,268-7,7176,449
– Gross Longs:28,30224,4179,899
– Gross Shorts:27,03432,1343,450
– Long to Short Ratio:1.0 to 10.8 to 12.9 to 1
NET POSITION TREND:
– Strength Index Score (3 Year Range Pct):4.298.052.0
– Strength Index Reading (3 Year Range):Bearish-ExtremeBullish-ExtremeBullish
NET POSITION MOVEMENT INDEX:
– 6-Week Change in Strength Index:-23.623.7-2.6


Palladium Futures:

Palladium Futures COT ChartThe Palladium Futures large speculator standing this week equaled a net position of -3,639 contracts in the data reported through Tuesday. This was a weekly boost of 135 contracts from the previous week which had a total of -3,774 net contracts.

This week’s current strength score (the trader positioning range over the past three years, measured from 0 to 100) shows the speculators are currently Bearish-Extreme with a score of 0.7 percent. The commercials are Bullish-Extreme with a score of 99.3 percent and the small traders (not shown in chart) are Bearish with a score of 24.3 percent.

Palladium Futures StatisticsSPECULATORSCOMMERCIALSSMALL TRADERS
– Percent of Open Interest Longs:26.060.312.3
– Percent of Open Interest Shorts:64.218.516.0
– Net Position:-3,6393,985-346
– Gross Longs:2,4755,7431,174
– Gross Shorts:6,1141,7581,520
– Long to Short Ratio:0.4 to 13.3 to 10.8 to 1
NET POSITION TREND:
– Strength Index Score (3 Year Range Pct):0.799.324.3
– Strength Index Reading (3 Year Range):Bearish-ExtremeBullish-ExtremeBearish
NET POSITION MOVEMENT INDEX:
– 6-Week Change in Strength Index:-3.75.1-17.5


Article By InvestMacroReceive our weekly COT Reports by Email

*COT Report: The COT data, released weekly to the public each Friday, is updated through the most recent Tuesday (data is 3 days old) and shows a quick view of how large speculators or non-commercials (for-profit traders) were positioned in the futures markets.

The CFTC categorizes trader positions according to commercial hedgers (traders who use futures contracts for hedging as part of the business), non-commercials (large traders who speculate to realize trading profits) and nonreportable traders (usually small traders/speculators) as well as their open interest (contracts open in the market at time of reporting).See CFTC criteria here.
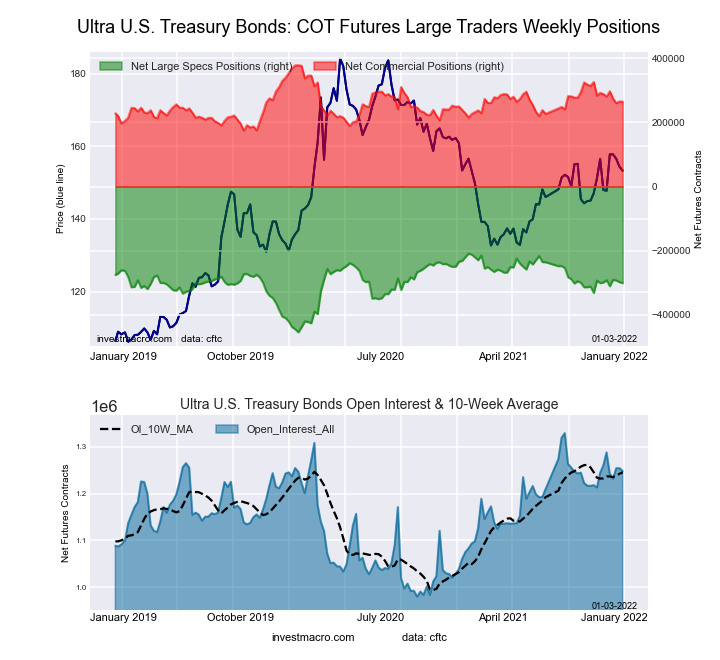
COT Energy Speculators raised their Natural Gas bearish bets last week

By InvestMacro | COT | Data Tables | COT Leaders | Downloads | COT Newsletter

Here are the latest charts and statistics for the Commitment of Traders (COT) data published by the Commodities Futures Trading Commission (CFTC). The latest release was delayed by the CFTC due to the Christmas holiday.
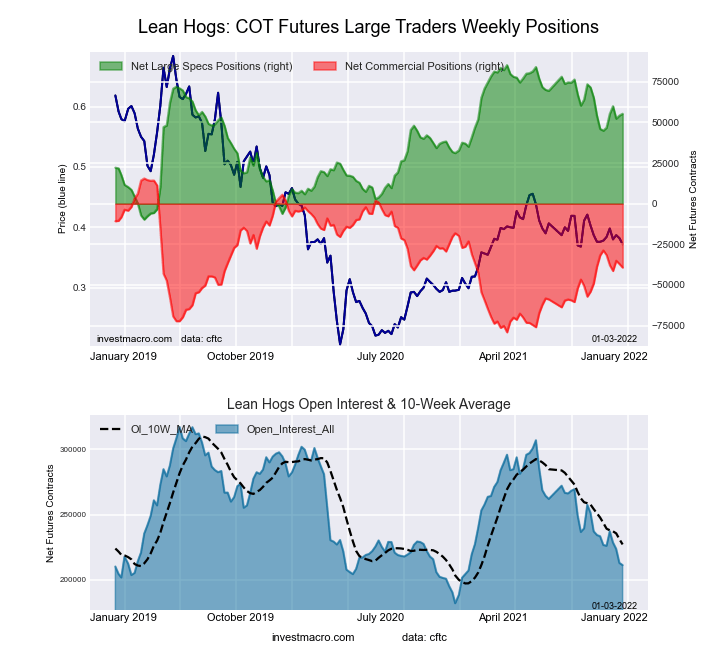
The latest COT data is updated through Tuesday December 21st 2021 and shows a quick view of how large traders (for-profit speculators and commercial entities) were positioned in the futures markets.

Highlighting the COT energy data is the decline in the Natural Gas futures bets. The speculative net position in the Natural Gas futures dropped sharply last week by over -10,000 contracts after improving in the previous four weeks. The speculator position fell by the largest one-week amount of the past fourteen weeks and brought the overall net position to its most bearish level since November 16th. Speculators have now been continually bearish on Natural Gas futures for forty-two straight weeks, dating back to the last net bullish level on March 2nd of this year.

Joining Natural Gas (-10,986 contracts) with declines for the week were Brent Crude Oil (-1,391 contracts), WTI Crude Oil (-6,882 contracts) and the Bloomberg Commodity Index (-1,401 contracts). Heating Oil (174 contracts) and Gasoline (3,719 contracts) had rising speculator bets last week.


Data Snapshot of Commodity Market Traders | Columns Legend
Dec-21-2021OIOI-IndexSpec-NetSpec-IndexCom-NetCOM-IndexSmalls-NetSmalls-Index
WTI Crude1,892,7010340,25520-375,8167035,56165
Gold500,84619205,81153-236,0294630,21850
Silver141,119820,92643-36,3996315,47330
Copper170,35354,43746-9,777535,34056
Palladium9,51814-3,63913,98599-34624
Platinum64,732301,2684-7,717986,44952
Natural Gas1,142,7294-141,21236109,5516531,66159
Brent224,11058-25,0017622,225262,77647
Heating Oil302,72134,89750-21,0604916,16354
Soybeans654,46011102,87756-72,35249-30,52521
Corn1,485,41219445,32087-401,28015-44,04018
Coffee258,8712856,13489-57,984141,8501
Sugar864,0829189,19875-210,7832821,58535
Wheat357,381119,13255-1,60139-7,53166


WTI Crude Oil Futures:

WTI Crude Oil Futures COT ChartThe WTI Crude Oil Futures large speculator standing this week recorded a net position of 340,255 contracts in the data reported through Tuesday. This was a weekly lowering of -6,882 contracts from the previous week which had a total of 347,137 net contracts.

This week’s current strength score (the trader positioning range over the past three years, measured from 0 to 100) shows the speculators are currently Bearish with a score of 20.2 percent. The commercials are Bullish with a score of 69.8 percent and the small traders (not shown in chart) are Bullish with a score of 65.1 percent.

WTI Crude Oil Futures StatisticsSPECULATORSCOMMERCIALSSMALL TRADERS
– Percent of Open Interest Longs:25.339.14.4
– Percent of Open Interest Shorts:7.359.02.5
– Net Position:340,255-375,81635,561
– Gross Longs:478,276740,19583,055
– Gross Shorts:138,0211,116,01147,494
– Long to Short Ratio:3.5 to 10.7 to 11.7 to 1
NET POSITION TREND:
– Strength Index Score (3 Year Range Pct):20.269.865.1
– Strength Index Reading (3 Year Range):BearishBullishBullish
NET POSITION MOVEMENT INDEX:
– 6-Week Change in Strength Index:-26.025.8-7.2


Brent Crude Oil Futures:

Brent Last Day Crude Oil Futures COT ChartThe Brent Crude Oil Futures large speculator standing this week recorded a net position of -25,001 contracts in the data reported through Tuesday. This was a weekly lowering of -1,391 contracts from the previous week which had a total of -23,610 net contracts.

This week’s current strength score (the trader positioning range over the past three years, measured from 0 to 100) shows the speculators are currently Bullish with a score of 75.8 percent. The commercials are Bearish with a score of 26.1 percent and the small traders (not shown in chart) are Bearish with a score of 46.9 percent.

Brent Crude Oil Futures StatisticsSPECULATORSCOMMERCIALSSMALL TRADERS
– Percent of Open Interest Longs:18.345.52.7
– Percent of Open Interest Shorts:29.435.61.5
– Net Position:-25,00122,2252,776
– Gross Longs:40,921101,9516,145
– Gross Shorts:65,92279,7263,369
– Long to Short Ratio:0.6 to 11.3 to 11.8 to 1
NET POSITION TREND:
– Strength Index Score (3 Year Range Pct):75.826.146.9
– Strength Index Reading (3 Year Range):BullishBearishBearish
NET POSITION MOVEMENT INDEX:
– 6-Week Change in Strength Index:-24.225.8-20.3


Natural Gas Futures:

Natural Gas Futures COT ChartThe Natural Gas Futures large speculator standing this week recorded a net position of -141,212 contracts in the data reported through Tuesday. This was a weekly decrease of -10,986 contracts from the previous week which had a total of -130,226 net contracts.

This week’s current strength score (the trader positioning range over the past three years, measured from 0 to 100) shows the speculators are currently Bearish with a score of 36.2 percent. The commercials are Bullish with a score of 65.4 percent and the small traders (not shown in chart) are Bullish with a score of 59.2 percent.

Natural Gas Futures StatisticsSPECULATORSCOMMERCIALSSMALL TRADERS
– Percent of Open Interest Longs:19.344.34.9
– Percent of Open Interest Shorts:31.634.72.1
– Net Position:-141,212109,55131,661
– Gross Longs:220,442506,06555,722
– Gross Shorts:361,654396,51424,061
– Long to Short Ratio:0.6 to 11.3 to 12.3 to 1
NET POSITION TREND:
– Strength Index Score (3 Year Range Pct):36.265.459.2
– Strength Index Reading (3 Year Range):BearishBullishBullish
NET POSITION MOVEMENT INDEX:
– 6-Week Change in Strength Index:0.33.5-30.6


Gasoline Blendstock Futures:

RBOB Gasoline Energy Futures COT ChartThe Gasoline Blendstock Futures large speculator standing this week recorded a net position of 60,153 contracts in the data reported through Tuesday. This was a weekly advance of 3,719 contracts from the previous week which had a total of 56,434 net contracts.

This week’s current strength score (the trader positioning range over the past three years, measured from 0 to 100) shows the speculators are currently Bearish with a score of 31.3 percent. The commercials are Bullish with a score of 73.1 percent and the small traders (not shown in chart) are Bearish with a score of 34.0 percent.

Nasdaq Mini Futures StatisticsSPECULATORSCOMMERCIALSSMALL TRADERS
– Percent of Open Interest Longs:32.844.06.1
– Percent of Open Interest Shorts:13.065.14.8
– Net Position:60,153-63,9133,760
– Gross Longs:99,381133,07818,347
– Gross Shorts:39,228196,99114,587
– Long to Short Ratio:2.5 to 10.7 to 11.3 to 1
NET POSITION TREND:
– Strength Index Score (3 Year Range Pct):31.373.134.0
– Strength Index Reading (3 Year Range):BearishBullishBearish
NET POSITION MOVEMENT INDEX:
– 6-Week Change in Strength Index:15.3-10.0-30.3


#2 Heating Oil NY-Harbor Futures:

NY Harbor Heating Oil Energy Futures COT ChartThe #2 Heating Oil NY-Harbor Futures large speculator standing this week recorded a net position of 4,897 contracts in the data reported through Tuesday. This was a weekly lift of 174 contracts from the previous week which had a total of 4,723 net contracts.

This week’s current strength score (the trader positioning range over the past three years, measured from 0 to 100) shows the speculators are currently Bearish with a score of 49.6 percent. The commercials are Bearish with a score of 48.9 percent and the small traders (not shown in chart) are Bullish with a score of 54.3 percent.

Heating Oil Futures StatisticsSPECULATORSCOMMERCIALSSMALL TRADERS
– Percent of Open Interest Longs:13.051.613.7
– Percent of Open Interest Shorts:11.358.58.3
– Net Position:4,897-21,06016,163
– Gross Longs:39,255156,08841,332
– Gross Shorts:34,358177,14825,169
– Long to Short Ratio:1.1 to 10.9 to 11.6 to 1
NET POSITION TREND:
– Strength Index Score (3 Year Range Pct):49.648.954.3
– Strength Index Reading (3 Year Range):BearishBearishBullish
NET POSITION MOVEMENT INDEX:
– 6-Week Change in Strength Index:-22.323.3-23.3


Bloomberg Commodity Index Futures:

Bloomberg Commodity Index Futures COT ChartThe Bloomberg Commodity Index Futures large speculator standing this week recorded a net position of -9,984 contracts in the data reported through Tuesday. This was a weekly lowering of -1,401 contracts from the previous week which had a total of -8,583 net contracts.

This week’s current strength score (the trader positioning range over the past three years, measured from 0 to 100) shows the speculators are currently Bullish with a score of 69.3 percent. The commercials are Bearish with a score of 30.0 percent and the small traders (not shown in chart) are Bearish with a score of 43.9 percent.

Bloomberg Index Futures StatisticsSPECULATORSCOMMERCIALSSMALL TRADERS
– Percent of Open Interest Longs:71.025.41.2
– Percent of Open Interest Shorts:96.01.50.1
– Net Position:-9,9849,537447
– Gross Longs:28,35210,137491
– Gross Shorts:38,33660044
– Long to Short Ratio:0.7 to 116.9 to 111.2 to 1
NET POSITION TREND:
– Strength Index Score (3 Year Range Pct):69.330.043.9
– Strength Index Reading (3 Year Range):BullishBearishBearish
NET POSITION MOVEMENT INDEX:
– 6-Week Change in Strength Index:16.1-15.2-11.2


Article By InvestMacroReceive our weekly COT Reports by Email

*COT Report: The COT data, released weekly to the public each Friday, is updated through the most recent Tuesday (data is 3 days old) and shows a quick view of how large speculators or non-commercials (for-profit traders) were positioned in the futures markets.

The CFTC categorizes trader positions according to commercial hedgers (traders who use futures contracts for hedging as part of the business), non-commercials (large traders who speculate to realize trading profits) and nonreportable traders (usually small traders/speculators) as well as their open interest (contracts open in the market at time of reporting).See CFTC criteria here.