
By InvestMacro | COT | Data Tables | COT Leaders | Downloads | COT Newsletter
Here are the latest charts and statistics for the Commitment of Traders (COT) data published by the Commodities Futures Trading Commission (CFTC). The latest release was delayed by the CFTC due to the Christmas holiday.
The latest COT data is updated through Tuesday December 21st 2021 and shows a quick view of how large traders (for-profit speculators and commercial entities) were positioned in the futures markets.
Highlighting the COT energy data is the decline in the Natural Gas futures bets. The speculative net position in the Natural Gas futures dropped sharply last week by over -10,000 contracts after improving in the previous four weeks. The speculator position fell by the largest one-week amount of the past fourteen weeks and brought the overall net position to its most bearish level since November 16th. Speculators have now been continually bearish on Natural Gas futures for forty-two straight weeks, dating back to the last net bullish level on March 2nd of this year.
Joining Natural Gas (-10,986 contracts) with declines for the week were Brent Crude Oil (-1,391 contracts), WTI Crude Oil (-6,882 contracts) and the Bloomberg Commodity Index (-1,401 contracts). Heating Oil (174 contracts) and Gasoline (3,719 contracts) had rising speculator bets last week.
| Dec-21-2021 | OI | OI-Index | Spec-Net | Spec-Index | Com-Net | COM-Index | Smalls-Net | Smalls-Index |
|---|---|---|---|---|---|---|---|---|
| WTI Crude | 1,892,701 | 0 | 340,255 | 20 | -375,816 | 70 | 35,561 | 65 |
| Gold | 500,846 | 19 | 205,811 | 53 | -236,029 | 46 | 30,218 | 50 |
| Silver | 141,119 | 8 | 20,926 | 43 | -36,399 | 63 | 15,473 | 30 |
| Copper | 170,353 | 5 | 4,437 | 46 | -9,777 | 53 | 5,340 | 56 |
| Palladium | 9,518 | 14 | -3,639 | 1 | 3,985 | 99 | -346 | 24 |
| Platinum | 64,732 | 30 | 1,268 | 4 | -7,717 | 98 | 6,449 | 52 |
| Natural Gas | 1,142,729 | 4 | -141,212 | 36 | 109,551 | 65 | 31,661 | 59 |
| Brent | 224,110 | 58 | -25,001 | 76 | 22,225 | 26 | 2,776 | 47 |
| Heating Oil | 302,721 | 3 | 4,897 | 50 | -21,060 | 49 | 16,163 | 54 |
| Soybeans | 654,460 | 11 | 102,877 | 56 | -72,352 | 49 | -30,525 | 21 |
| Corn | 1,485,412 | 19 | 445,320 | 87 | -401,280 | 15 | -44,040 | 18 |
| Coffee | 258,871 | 28 | 56,134 | 89 | -57,984 | 14 | 1,850 | 1 |
| Sugar | 864,082 | 9 | 189,198 | 75 | -210,783 | 28 | 21,585 | 35 |
| Wheat | 357,381 | 11 | 9,132 | 55 | -1,601 | 39 | -7,531 | 66 |
Free Reports:
 Download Our Metatrader 4 Indicators – Put Our Free MetaTrader 4 Custom Indicators on your charts when you join our Weekly Newsletter
 Get our Weekly Commitment of Traders Reports - See where the biggest traders (Hedge Funds and Commercial Hedgers) are positioned in the futures markets on a weekly basis.
WTI Crude Oil Futures:
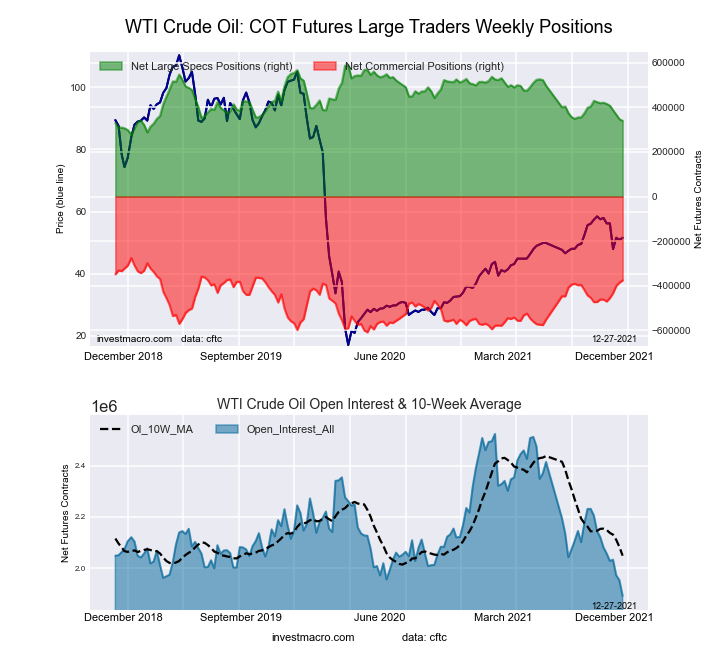 The WTI Crude Oil Futures large speculator standing this week recorded a net position of 340,255 contracts in the data reported through Tuesday. This was a weekly lowering of -6,882 contracts from the previous week which had a total of 347,137 net contracts.
This week’s current strength score (the trader positioning range over the past three years, measured from 0 to 100) shows the speculators are currently Bearish with a score of 20.2 percent. The commercials are Bullish with a score of 69.8 percent and the small traders (not shown in chart) are Bullish with a score of 65.1 percent.
| WTI Crude Oil Futures Statistics | SPECULATORS | COMMERCIALS | SMALL TRADERS |
| – Percent of Open Interest Longs: | 25.3 | 39.1 | 4.4 |
| – Percent of Open Interest Shorts: | 7.3 | 59.0 | 2.5 |
| – Net Position: | 340,255 | -375,816 | 35,561 |
| – Gross Longs: | 478,276 | 740,195 | 83,055 |
| – Gross Shorts: | 138,021 | 1,116,011 | 47,494 |
| – Long to Short Ratio: | 3.5 to 1 | 0.7 to 1 | 1.7 to 1 |
| NET POSITION TREND: | |||
| – Strength Index Score (3 Year Range Pct): | 20.2 | 69.8 | 65.1 |
| – Strength Index Reading (3 Year Range): | Bearish | Bullish | Bullish |
| NET POSITION MOVEMENT INDEX: | |||
| – 6-Week Change in Strength Index: | -26.0 | 25.8 | -7.2 |
Brent Crude Oil Futures:
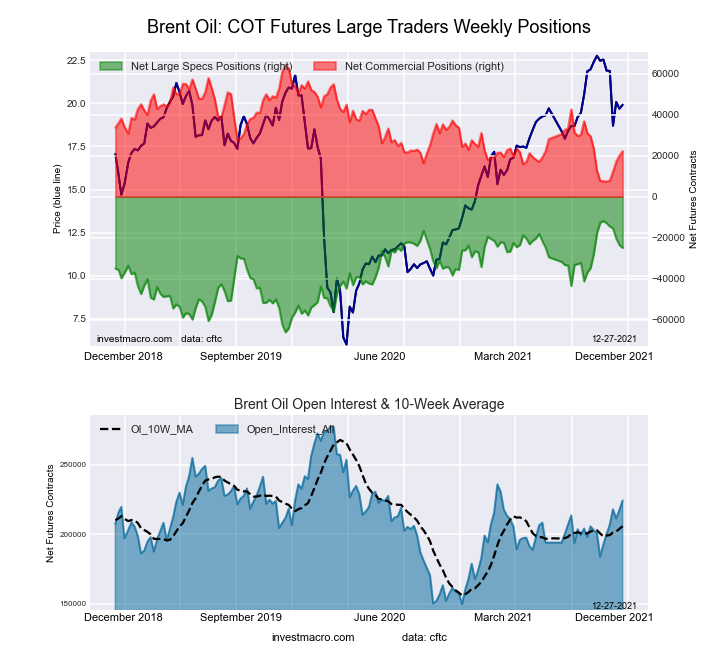 The Brent Crude Oil Futures large speculator standing this week recorded a net position of -25,001 contracts in the data reported through Tuesday. This was a weekly lowering of -1,391 contracts from the previous week which had a total of -23,610 net contracts.
This week’s current strength score (the trader positioning range over the past three years, measured from 0 to 100) shows the speculators are currently Bullish with a score of 75.8 percent. The commercials are Bearish with a score of 26.1 percent and the small traders (not shown in chart) are Bearish with a score of 46.9 percent.
| Brent Crude Oil Futures Statistics | SPECULATORS | COMMERCIALS | SMALL TRADERS |
| – Percent of Open Interest Longs: | 18.3 | 45.5 | 2.7 |
| – Percent of Open Interest Shorts: | 29.4 | 35.6 | 1.5 |
| – Net Position: | -25,001 | 22,225 | 2,776 |
| – Gross Longs: | 40,921 | 101,951 | 6,145 |
| – Gross Shorts: | 65,922 | 79,726 | 3,369 |
| – Long to Short Ratio: | 0.6 to 1 | 1.3 to 1 | 1.8 to 1 |
| NET POSITION TREND: | |||
| – Strength Index Score (3 Year Range Pct): | 75.8 | 26.1 | 46.9 |
| – Strength Index Reading (3 Year Range): | Bullish | Bearish | Bearish |
| NET POSITION MOVEMENT INDEX: | |||
| – 6-Week Change in Strength Index: | -24.2 | 25.8 | -20.3 |
Natural Gas Futures:
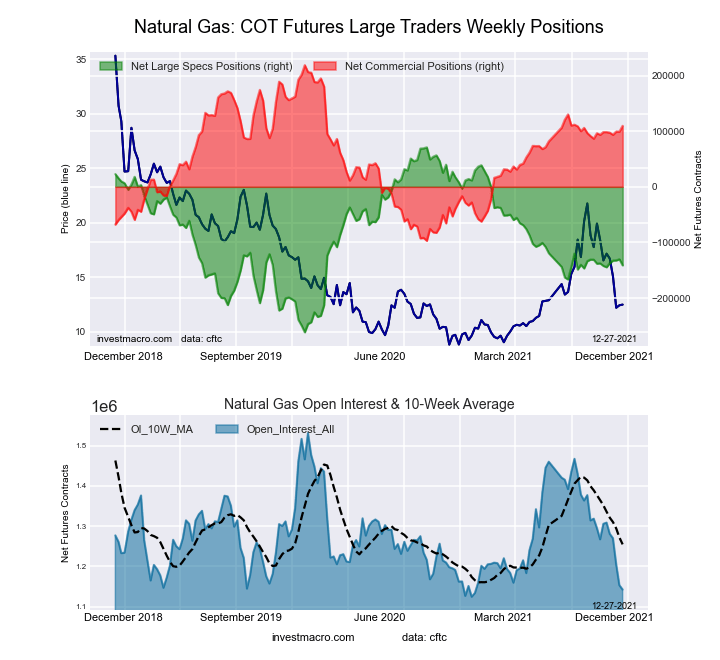 The Natural Gas Futures large speculator standing this week recorded a net position of -141,212 contracts in the data reported through Tuesday. This was a weekly decrease of -10,986 contracts from the previous week which had a total of -130,226 net contracts.
This week’s current strength score (the trader positioning range over the past three years, measured from 0 to 100) shows the speculators are currently Bearish with a score of 36.2 percent. The commercials are Bullish with a score of 65.4 percent and the small traders (not shown in chart) are Bullish with a score of 59.2 percent.
| Natural Gas Futures Statistics | SPECULATORS | COMMERCIALS | SMALL TRADERS |
| – Percent of Open Interest Longs: | 19.3 | 44.3 | 4.9 |
| – Percent of Open Interest Shorts: | 31.6 | 34.7 | 2.1 |
| – Net Position: | -141,212 | 109,551 | 31,661 |
| – Gross Longs: | 220,442 | 506,065 | 55,722 |
| – Gross Shorts: | 361,654 | 396,514 | 24,061 |
| – Long to Short Ratio: | 0.6 to 1 | 1.3 to 1 | 2.3 to 1 |
| NET POSITION TREND: | |||
| – Strength Index Score (3 Year Range Pct): | 36.2 | 65.4 | 59.2 |
| – Strength Index Reading (3 Year Range): | Bearish | Bullish | Bullish |
| NET POSITION MOVEMENT INDEX: | |||
| – 6-Week Change in Strength Index: | 0.3 | 3.5 | -30.6 |
Gasoline Blendstock Futures:
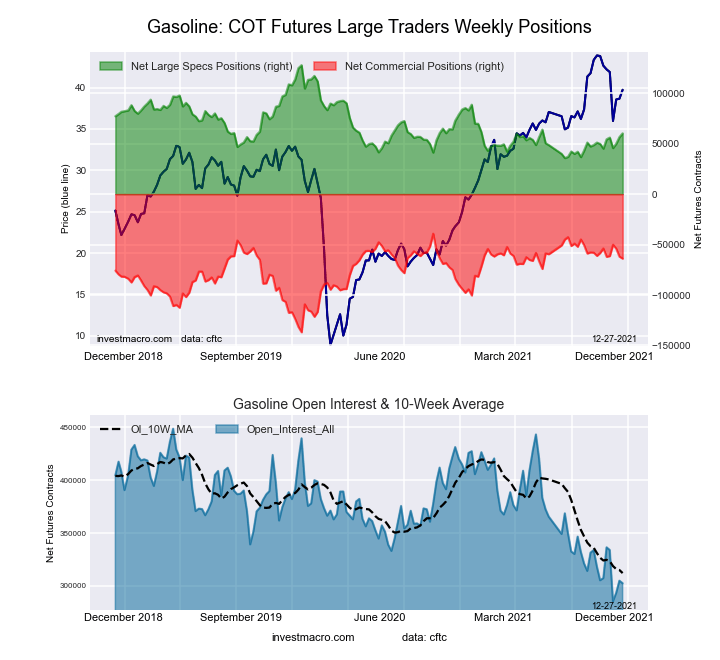 The Gasoline Blendstock Futures large speculator standing this week recorded a net position of 60,153 contracts in the data reported through Tuesday. This was a weekly advance of 3,719 contracts from the previous week which had a total of 56,434 net contracts.
This week’s current strength score (the trader positioning range over the past three years, measured from 0 to 100) shows the speculators are currently Bearish with a score of 31.3 percent. The commercials are Bullish with a score of 73.1 percent and the small traders (not shown in chart) are Bearish with a score of 34.0 percent.
| Nasdaq Mini Futures Statistics | SPECULATORS | COMMERCIALS | SMALL TRADERS |
| – Percent of Open Interest Longs: | 32.8 | 44.0 | 6.1 |
| – Percent of Open Interest Shorts: | 13.0 | 65.1 | 4.8 |
| – Net Position: | 60,153 | -63,913 | 3,760 |
| – Gross Longs: | 99,381 | 133,078 | 18,347 |
| – Gross Shorts: | 39,228 | 196,991 | 14,587 |
| – Long to Short Ratio: | 2.5 to 1 | 0.7 to 1 | 1.3 to 1 |
| NET POSITION TREND: | |||
| – Strength Index Score (3 Year Range Pct): | 31.3 | 73.1 | 34.0 |
| – Strength Index Reading (3 Year Range): | Bearish | Bullish | Bearish |
| NET POSITION MOVEMENT INDEX: | |||
| – 6-Week Change in Strength Index: | 15.3 | -10.0 | -30.3 |
#2 Heating Oil NY-Harbor Futures:
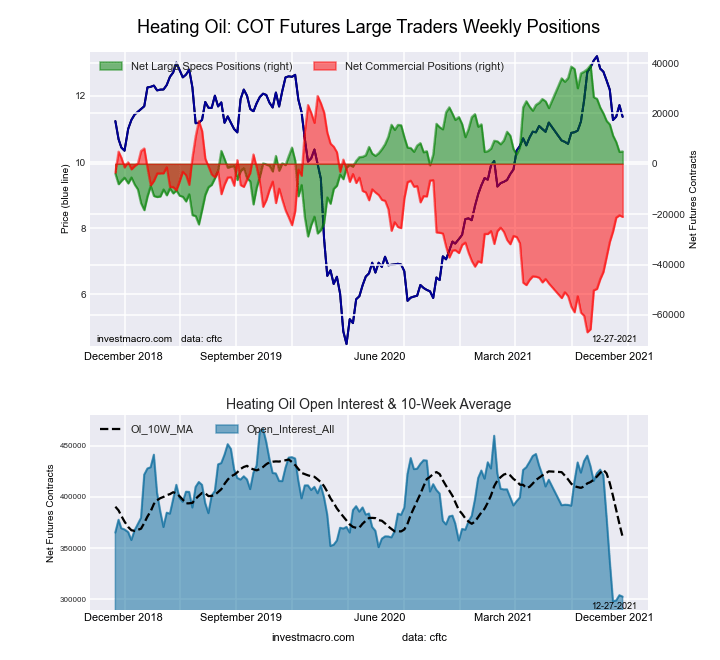 The #2 Heating Oil NY-Harbor Futures large speculator standing this week recorded a net position of 4,897 contracts in the data reported through Tuesday. This was a weekly lift of 174 contracts from the previous week which had a total of 4,723 net contracts.
This week’s current strength score (the trader positioning range over the past three years, measured from 0 to 100) shows the speculators are currently Bearish with a score of 49.6 percent. The commercials are Bearish with a score of 48.9 percent and the small traders (not shown in chart) are Bullish with a score of 54.3 percent.
| Heating Oil Futures Statistics | SPECULATORS | COMMERCIALS | SMALL TRADERS |
| – Percent of Open Interest Longs: | 13.0 | 51.6 | 13.7 |
| – Percent of Open Interest Shorts: | 11.3 | 58.5 | 8.3 |
| – Net Position: | 4,897 | -21,060 | 16,163 |
| – Gross Longs: | 39,255 | 156,088 | 41,332 |
| – Gross Shorts: | 34,358 | 177,148 | 25,169 |
| – Long to Short Ratio: | 1.1 to 1 | 0.9 to 1 | 1.6 to 1 |
| NET POSITION TREND: | |||
| – Strength Index Score (3 Year Range Pct): | 49.6 | 48.9 | 54.3 |
| – Strength Index Reading (3 Year Range): | Bearish | Bearish | Bullish |
| NET POSITION MOVEMENT INDEX: | |||
| – 6-Week Change in Strength Index: | -22.3 | 23.3 | -23.3 |
Bloomberg Commodity Index Futures:
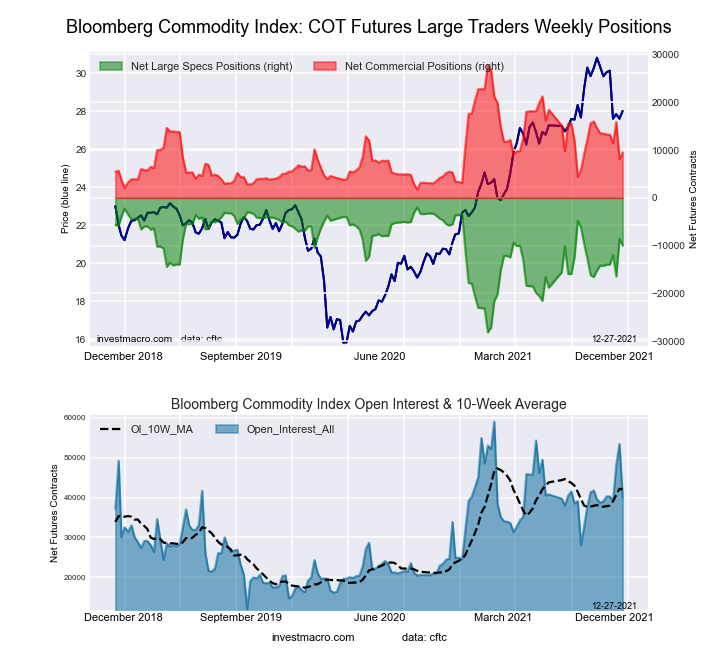 The Bloomberg Commodity Index Futures large speculator standing this week recorded a net position of -9,984 contracts in the data reported through Tuesday. This was a weekly lowering of -1,401 contracts from the previous week which had a total of -8,583 net contracts.
This week’s current strength score (the trader positioning range over the past three years, measured from 0 to 100) shows the speculators are currently Bullish with a score of 69.3 percent. The commercials are Bearish with a score of 30.0 percent and the small traders (not shown in chart) are Bearish with a score of 43.9 percent.
| Bloomberg Index Futures Statistics | SPECULATORS | COMMERCIALS | SMALL TRADERS |
| – Percent of Open Interest Longs: | 71.0 | 25.4 | 1.2 |
| – Percent of Open Interest Shorts: | 96.0 | 1.5 | 0.1 |
| – Net Position: | -9,984 | 9,537 | 447 |
| – Gross Longs: | 28,352 | 10,137 | 491 |
| – Gross Shorts: | 38,336 | 600 | 44 |
| – Long to Short Ratio: | 0.7 to 1 | 16.9 to 1 | 11.2 to 1 |
| NET POSITION TREND: | |||
| – Strength Index Score (3 Year Range Pct): | 69.3 | 30.0 | 43.9 |
| – Strength Index Reading (3 Year Range): | Bullish | Bearish | Bearish |
| NET POSITION MOVEMENT INDEX: | |||
| – 6-Week Change in Strength Index: | 16.1 | -15.2 | -11.2 |
Article By InvestMacro – Receive our weekly COT Reports by Email
*COT Report: The COT data, released weekly to the public each Friday, is updated through the most recent Tuesday (data is 3 days old) and shows a quick view of how large speculators or non-commercials (for-profit traders) were positioned in the futures markets.
The CFTC categorizes trader positions according to commercial hedgers (traders who use futures contracts for hedging as part of the business), non-commercials (large traders who speculate to realize trading profits) and nonreportable traders (usually small traders/speculators) as well as their open interest (contracts open in the market at time of reporting).See CFTC criteria here.

- The US introduces new import tariffs for 60 countries. Brent crude surpasses $100 per barrel Jul 24, 2026
- USD/JPY Breaks Records: Nothing Slows the Yen’s Decline Jul 24, 2026
- Oil prices reached a 6‑week high. The AUD strengthened on the back of a strong labor‑market report Jul 23, 2026
- EUR/USD Recovers as Dollar Weakens Jul 23, 2026
- Bitcoin rose to $66,000. The New Zealand dollar continues to strengthen Jul 22, 2026
- Inflationary pressure is easing in Canada. In New Zealand, on the contrary, inflation is rising Jul 21, 2026
- GBP/USD Falls After Cabinet Changes Jul 21, 2026
- Geopolitical and macroeconomic conditions continue to pressure market sentiment Jul 20, 2026
- USD/JPY Poised to Continue Gains as Expensive Oil and Lack of Support Weigh on Yen Jul 20, 2026
- COT Metals Charts: Weekly Speculator Bets led by Copper & Steel Jul 18, 2026