
By InvestMacro | COT | Data Tables | COT Leaders | Downloads | COT Newsletter
Here are the latest charts and statistics for the Commitment of Traders (COT) data published by the Commodities Futures Trading Commission (CFTC). The latest release was delayed by the CFTC due to the New Year’s holiday.
The latest COT data is updated through Tuesday December 28th 2021 (delayed holiday release) and shows a quick view of how large traders (for-profit speculators and commercial entities) were positioned in the futures markets.
Highlighting the COT soft commodities data last week was once again the Soybeans bullish bets that keep on rising. The speculator positions increased for a fourth straight week and by a total of 69,968 contracts over that 4-week time-frame. This bullishness has boosted the Soybean speculator position to its highest level since July 27th, a span of twenty-two weeks.
The soft commodities that saw higher bets last week were Corn (12,856 contracts), Soybeans (22,408 contracts), Soybean Oil (201 contracts), Soybean Meal (11,610 contracts), Lean Hogs (1,094 contracts), Cotton (3,152 contracts) and Cocoa (2,547 contracts). The commodities with lower bets on the week were Wheat (-2,833 contracts), Sugar (-4,512 contracts), Coffee (-869 contracts) and Live Cattle (-13,158 contracts).
| Dec-28-2021 | OI | OI-Index | Spec-Net | Spec-Index | Com-Net | COM-Index | Smalls-Net | Smalls-Index |
|---|---|---|---|---|---|---|---|---|
| WTI Crude | 1,867,339 | 0 | 338,429 | 20 | -373,092 | 71 | 34,663 | 64 |
| Gold | 508,912 | 22 | 213,156 | 56 | -245,664 | 43 | 32,508 | 56 |
| Silver | 141,246 | 8 | 26,458 | 49 | -41,928 | 58 | 15,470 | 30 |
| Copper | 180,736 | 13 | 14,383 | 53 | -19,679 | 46 | 5,296 | 56 |
| Palladium | 9,403 | 13 | -3,109 | 4 | 3,230 | 95 | -121 | 38 |
| Platinum | 60,353 | 22 | 4,469 | 9 | -10,655 | 94 | 6,186 | 48 |
| Natural Gas | 1,110,532 | 0 | -146,217 | 35 | 115,610 | 67 | 30,607 | 56 |
| Brent | 215,921 | 52 | -20,716 | 84 | 17,594 | 18 | 3,122 | 52 |
| Heating Oil | 302,721 | 3 | 4,897 | 50 | -21,060 | 49 | 16,163 | 54 |
| Soybeans | 647,225 | 9 | 125,285 | 61 | -93,079 | 44 | -32,206 | 18 |
| Corn | 1,522,692 | 25 | 458,176 | 89 | -411,793 | 13 | -46,383 | 16 |
| Coffee | 261,263 | 30 | 55,265 | 89 | -58,015 | 14 | 2,750 | 7 |
| Sugar | 864,262 | 9 | 184,686 | 75 | -209,011 | 29 | 24,325 | 38 |
| Wheat | 357,381 | 11 | 9,132 | 55 | -1,601 | 39 | -7,531 | 66 |
Free Reports:
 Download Our Metatrader 4 Indicators – Put Our Free MetaTrader 4 Custom Indicators on your charts when you join our Weekly Newsletter
 Get our Weekly Commitment of Traders Reports - See where the biggest traders (Hedge Funds and Commercial Hedgers) are positioned in the futures markets on a weekly basis.
CORN Futures:
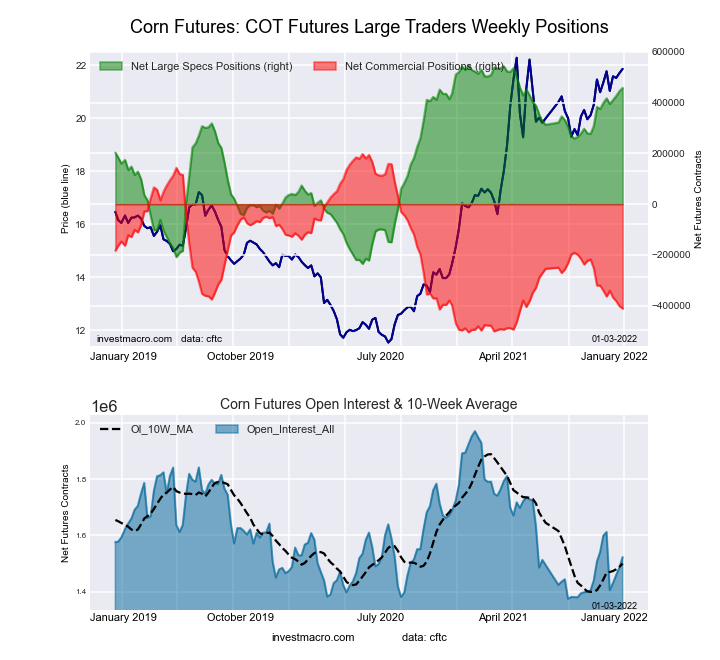 The CORN large speculator standing this week reached a net position of 458,176 contracts in the data reported through Tuesday. This was a weekly rise of 12,856 contracts from the previous week which had a total of 445,320 net contracts.
This week’s current strength score (the trader positioning range over the past three years, measured from 0 to 100) shows the speculators are currently Bullish-Extreme with a score of 88.6 percent. The commercials are Bearish-Extreme with a score of 13.3 percent and the small traders (not shown in chart) are Bearish-Extreme with a score of 16.3 percent.
| CORN Futures Statistics | SPECULATORS | COMMERCIALS | SMALL TRADERS |
| – Percent of Open Interest Longs: | 35.3 | 43.7 | 8.5 |
| – Percent of Open Interest Shorts: | 5.2 | 70.8 | 11.5 |
| – Net Position: | 458,176 | -411,793 | -46,383 |
| – Gross Longs: | 536,934 | 665,968 | 129,328 |
| – Gross Shorts: | 78,758 | 1,077,761 | 175,711 |
| – Long to Short Ratio: | 6.8 to 1 | 0.6 to 1 | 0.7 to 1 |
| NET POSITION TREND: | |||
| – Strength Index Score (3 Year Range Pct): | 88.6 | 13.3 | 16.3 |
| – Strength Index Reading (3 Year Range): | Bullish-Extreme | Bearish-Extreme | Bearish-Extreme |
| NET POSITION MOVEMENT INDEX: | |||
| – 6-Week Change in Strength Index: | 7.5 | -10.1 | 7.0 |
SUGAR Futures:
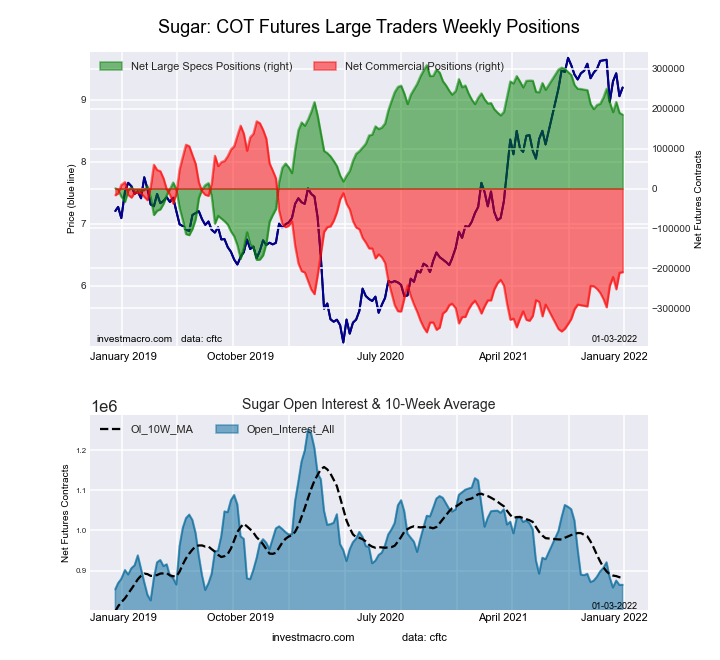 The SUGAR large speculator standing this week reached a net position of 184,686 contracts in the data reported through Tuesday. This was a weekly decrease of -4,512 contracts from the previous week which had a total of 189,198 net contracts.
This week’s current strength score (the trader positioning range over the past three years, measured from 0 to 100) shows the speculators are currently Bullish with a score of 74.6 percent. The commercials are Bearish with a score of 28.5 percent and the small traders (not shown in chart) are Bearish with a score of 37.9 percent.
| SUGAR Futures Statistics | SPECULATORS | COMMERCIALS | SMALL TRADERS |
| – Percent of Open Interest Longs: | 27.0 | 49.5 | 9.1 |
| – Percent of Open Interest Shorts: | 5.6 | 73.7 | 6.3 |
| – Net Position: | 184,686 | -209,011 | 24,325 |
| – Gross Longs: | 233,490 | 427,847 | 78,835 |
| – Gross Shorts: | 48,804 | 636,858 | 54,510 |
| – Long to Short Ratio: | 4.8 to 1 | 0.7 to 1 | 1.4 to 1 |
| NET POSITION TREND: | |||
| – Strength Index Score (3 Year Range Pct): | 74.6 | 28.5 | 37.9 |
| – Strength Index Reading (3 Year Range): | Bullish | Bearish | Bearish |
| NET POSITION MOVEMENT INDEX: | |||
| – 6-Week Change in Strength Index: | -8.8 | 12.7 | -30.2 |
COFFEE Futures:
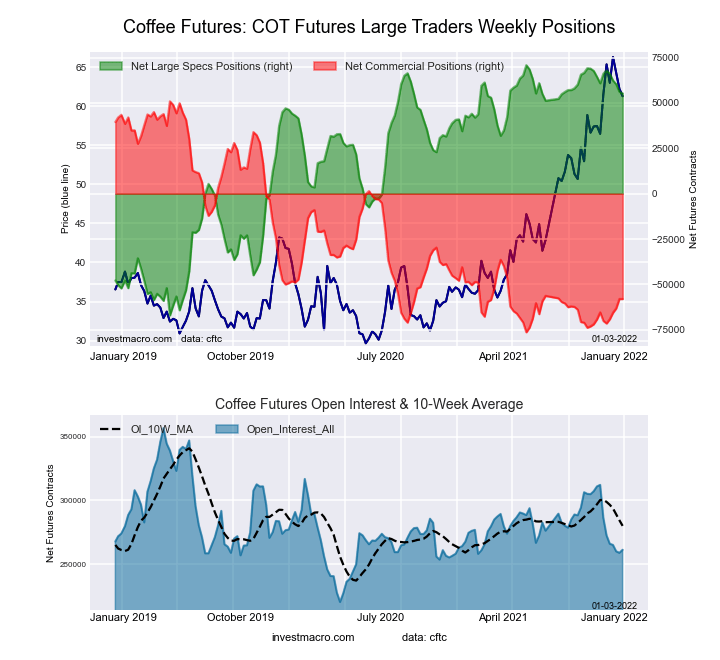 The COFFEE large speculator standing this week reached a net position of 55,265 contracts in the data reported through Tuesday. This was a weekly decrease of -869 contracts from the previous week which had a total of 56,134 net contracts.
This week’s current strength score (the trader positioning range over the past three years, measured from 0 to 100) shows the speculators are currently Bullish-Extreme with a score of 88.7 percent. The commercials are Bearish-Extreme with a score of 14.4 percent and the small traders (not shown in chart) are Bearish-Extreme with a score of 7.3 percent.
| COFFEE Futures Statistics | SPECULATORS | COMMERCIALS | SMALL TRADERS |
| – Percent of Open Interest Longs: | 26.5 | 48.6 | 3.7 |
| – Percent of Open Interest Shorts: | 5.3 | 70.8 | 2.6 |
| – Net Position: | 55,265 | -58,015 | 2,750 |
| – Gross Longs: | 69,178 | 127,068 | 9,647 |
| – Gross Shorts: | 13,913 | 185,083 | 6,897 |
| – Long to Short Ratio: | 5.0 to 1 | 0.7 to 1 | 1.4 to 1 |
| NET POSITION TREND: | |||
| – Strength Index Score (3 Year Range Pct): | 88.7 | 14.4 | 7.3 |
| – Strength Index Reading (3 Year Range): | Bullish-Extreme | Bearish-Extreme | Bearish-Extreme |
| NET POSITION MOVEMENT INDEX: | |||
| – 6-Week Change in Strength Index: | -7.9 | 9.5 | -8.6 |
SOYBEANS Futures:
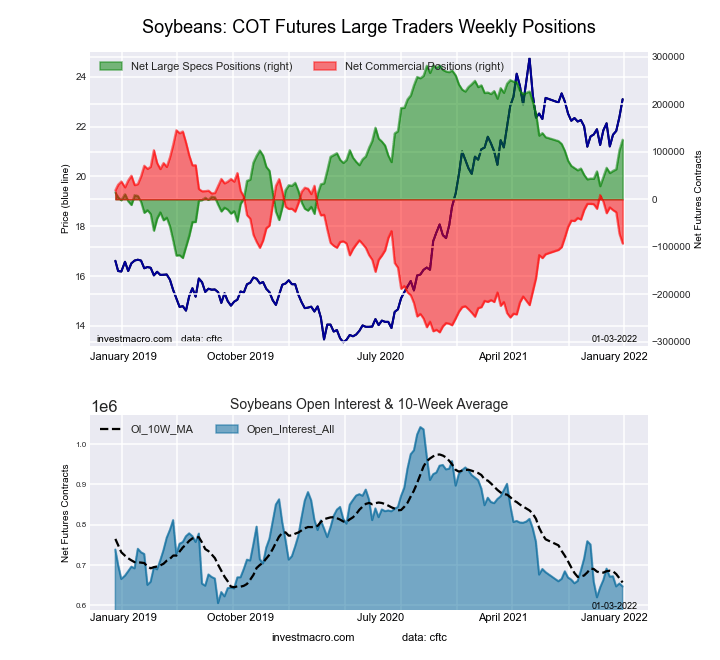 The SOYBEANS large speculator standing this week reached a net position of 125,285 contracts in the data reported through Tuesday. This was a weekly lift of 22,408 contracts from the previous week which had a total of 102,877 net contracts.
This week’s current strength score (the trader positioning range over the past three years, measured from 0 to 100) shows the speculators are currently Bullish with a score of 61.3 percent. The commercials are Bearish with a score of 43.9 percent and the small traders (not shown in chart) are Bearish-Extreme with a score of 18.2 percent.
| SOYBEANS Futures Statistics | SPECULATORS | COMMERCIALS | SMALL TRADERS |
| – Percent of Open Interest Longs: | 26.0 | 52.5 | 7.5 |
| – Percent of Open Interest Shorts: | 6.6 | 66.8 | 12.5 |
| – Net Position: | 125,285 | -93,079 | -32,206 |
| – Gross Longs: | 168,011 | 339,477 | 48,633 |
| – Gross Shorts: | 42,726 | 432,556 | 80,839 |
| – Long to Short Ratio: | 3.9 to 1 | 0.8 to 1 | 0.6 to 1 |
| NET POSITION TREND: | |||
| – Strength Index Score (3 Year Range Pct): | 61.3 | 43.9 | 18.2 |
| – Strength Index Reading (3 Year Range): | Bullish | Bearish | Bearish-Extreme |
| NET POSITION MOVEMENT INDEX: | |||
| – 6-Week Change in Strength Index: | 19.3 | -20.7 | 16.3 |
SOYBEAN MEAL Futures:
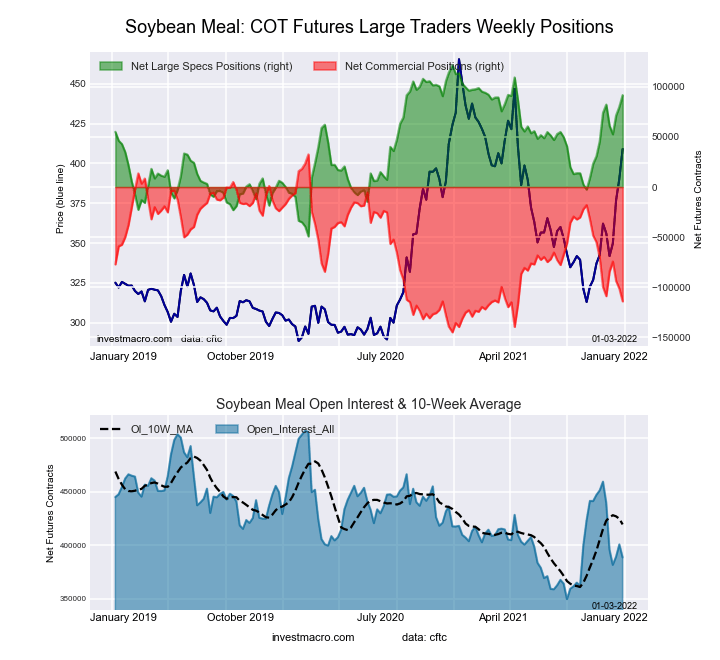 The SOYBEAN MEAL large speculator standing this week reached a net position of 91,744 contracts in the data reported through Tuesday. This was a weekly advance of 11,610 contracts from the previous week which had a total of 80,134 net contracts.
This week’s current strength score (the trader positioning range over the past three years, measured from 0 to 100) shows the speculators are currently Bullish-Extreme with a score of 82.5 percent. The commercials are Bearish-Extreme with a score of 17.4 percent and the small traders (not shown in chart) are Bullish with a score of 60.4 percent.
| SOYBEAN MEAL Futures Statistics | SPECULATORS | COMMERCIALS | SMALL TRADERS |
| – Percent of Open Interest Longs: | 28.3 | 47.5 | 12.2 |
| – Percent of Open Interest Shorts: | 4.7 | 76.9 | 6.4 |
| – Net Position: | 91,744 | -114,144 | 22,400 |
| – Gross Longs: | 110,165 | 184,560 | 47,358 |
| – Gross Shorts: | 18,421 | 298,704 | 24,958 |
| – Long to Short Ratio: | 6.0 to 1 | 0.6 to 1 | 1.9 to 1 |
| NET POSITION TREND: | |||
| – Strength Index Score (3 Year Range Pct): | 82.5 | 17.4 | 60.4 |
| – Strength Index Reading (3 Year Range): | Bullish-Extreme | Bearish-Extreme | Bullish |
| NET POSITION MOVEMENT INDEX: | |||
| – 6-Week Change in Strength Index: | 10.4 | -8.0 | -13.9 |
LIVE CATTLE Futures:
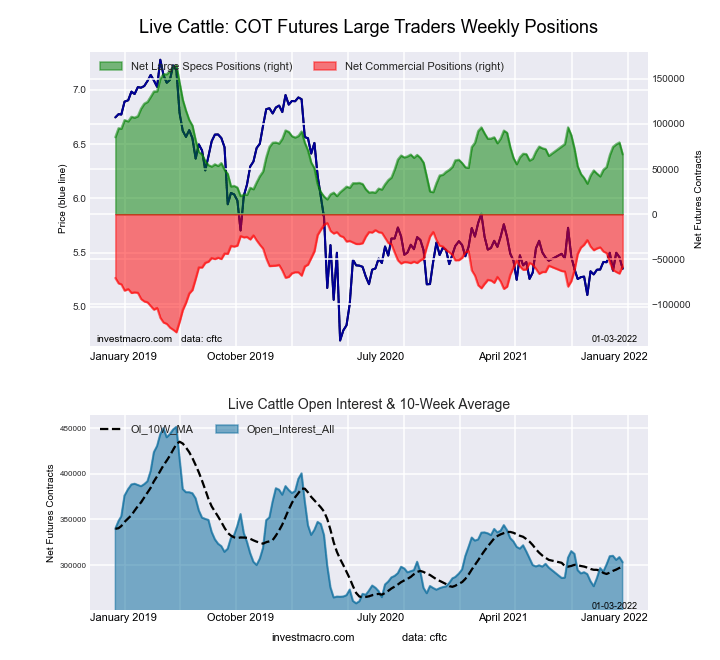 The LIVE CATTLE large speculator standing this week reached a net position of 66,356 contracts in the data reported through Tuesday. This was a weekly decline of -13,158 contracts from the previous week which had a total of 79,514 net contracts.
This week’s current strength score (the trader positioning range over the past three years, measured from 0 to 100) shows the speculators are currently Bearish with a score of 33.6 percent. The commercials are Bullish with a score of 60.4 percent and the small traders (not shown in chart) are Bullish with a score of 66.1 percent.
| LIVE CATTLE Futures Statistics | SPECULATORS | COMMERCIALS | SMALL TRADERS |
| – Percent of Open Interest Longs: | 37.4 | 37.3 | 10.3 |
| – Percent of Open Interest Shorts: | 15.5 | 56.3 | 13.1 |
| – Net Position: | 66,356 | -57,712 | -8,644 |
| – Gross Longs: | 113,339 | 112,965 | 31,159 |
| – Gross Shorts: | 46,983 | 170,677 | 39,803 |
| – Long to Short Ratio: | 2.4 to 1 | 0.7 to 1 | 0.8 to 1 |
| NET POSITION TREND: | |||
| – Strength Index Score (3 Year Range Pct): | 33.6 | 60.4 | 66.1 |
| – Strength Index Reading (3 Year Range): | Bearish | Bullish | Bullish |
| NET POSITION MOVEMENT INDEX: | |||
| – 6-Week Change in Strength Index: | 11.5 | -13.6 | -1.7 |
LEAN HOGS Futures:
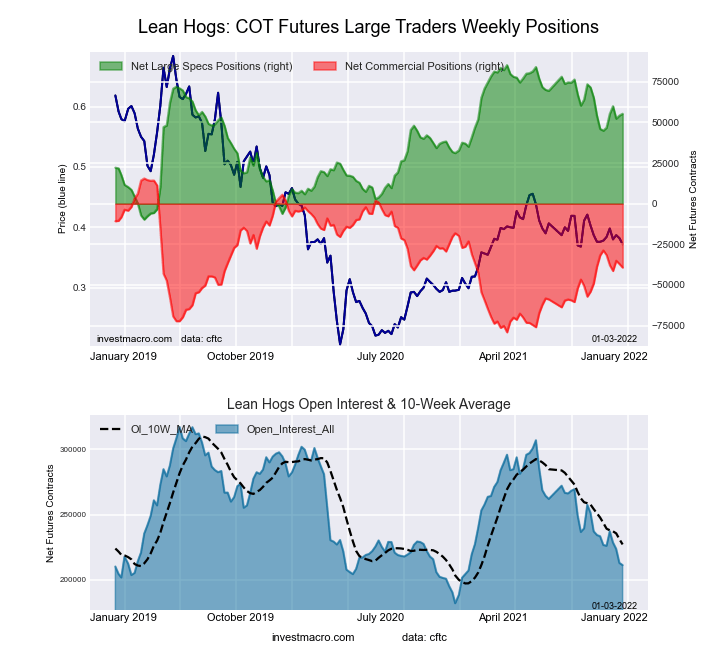 The LEAN HOGS large speculator standing this week reached a net position of 55,296 contracts in the data reported through Tuesday. This was a weekly increase of 1,094 contracts from the previous week which had a total of 54,202 net contracts.
This week’s current strength score (the trader positioning range over the past three years, measured from 0 to 100) shows the speculators are currently Bullish with a score of 68.2 percent. The commercials are Bearish with a score of 42.1 percent and the small traders (not shown in chart) are Bearish-Extreme with a score of 11.0 percent.
| LEAN HOGS Futures Statistics | SPECULATORS | COMMERCIALS | SMALL TRADERS |
| – Percent of Open Interest Longs: | 40.5 | 36.3 | 7.4 |
| – Percent of Open Interest Shorts: | 14.3 | 54.9 | 15.0 |
| – Net Position: | 55,296 | -39,273 | -16,023 |
| – Gross Longs: | 85,559 | 76,686 | 15,634 |
| – Gross Shorts: | 30,263 | 115,959 | 31,657 |
| – Long to Short Ratio: | 2.8 to 1 | 0.7 to 1 | 0.5 to 1 |
| NET POSITION TREND: | |||
| – Strength Index Score (3 Year Range Pct): | 68.2 | 42.1 | 11.0 |
| – Strength Index Reading (3 Year Range): | Bullish | Bearish | Bearish-Extreme |
| NET POSITION MOVEMENT INDEX: | |||
| – 6-Week Change in Strength Index: | 10.9 | -11.1 | 0.6 |
COTTON Futures:
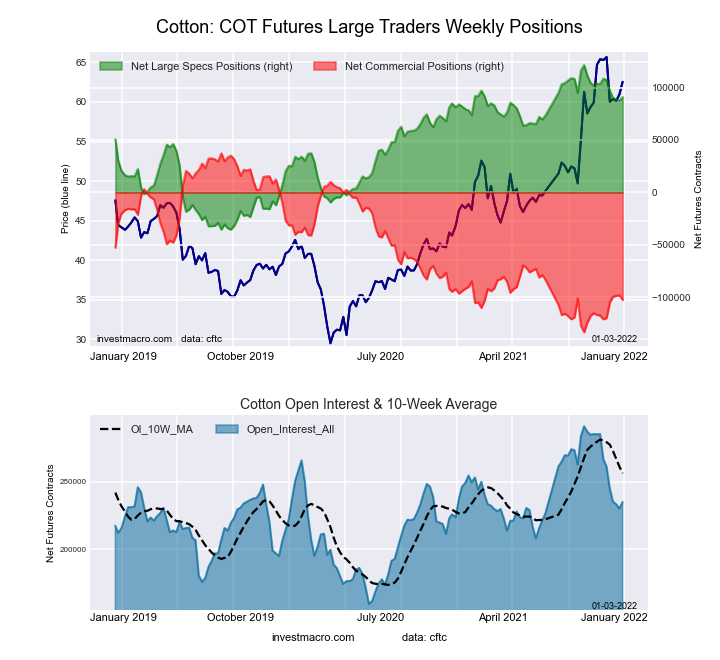 The COTTON large speculator standing this week reached a net position of 90,889 contracts in the data reported through Tuesday. This was a weekly gain of 3,152 contracts from the previous week which had a total of 87,737 net contracts.
This week’s current strength score (the trader positioning range over the past three years, measured from 0 to 100) shows the speculators are currently Bullish-Extreme with a score of 80.6 percent. The commercials are Bearish-Extreme with a score of 18.0 percent and the small traders (not shown in chart) are Bullish-Extreme with a score of 86.1 percent.
| COTTON Futures Statistics | SPECULATORS | COMMERCIALS | SMALL TRADERS |
| – Percent of Open Interest Longs: | 44.1 | 35.3 | 7.9 |
| – Percent of Open Interest Shorts: | 5.4 | 78.9 | 2.9 |
| – Net Position: | 90,889 | -102,513 | 11,624 |
| – Gross Longs: | 103,562 | 82,804 | 18,544 |
| – Gross Shorts: | 12,673 | 185,317 | 6,920 |
| – Long to Short Ratio: | 8.2 to 1 | 0.4 to 1 | 2.7 to 1 |
| NET POSITION TREND: | |||
| – Strength Index Score (3 Year Range Pct): | 80.6 | 18.0 | 86.1 |
| – Strength Index Reading (3 Year Range): | Bullish-Extreme | Bearish-Extreme | Bullish-Extreme |
| NET POSITION MOVEMENT INDEX: | |||
| – 6-Week Change in Strength Index: | -11.2 | 10.8 | -5.5 |
COCOA Futures:
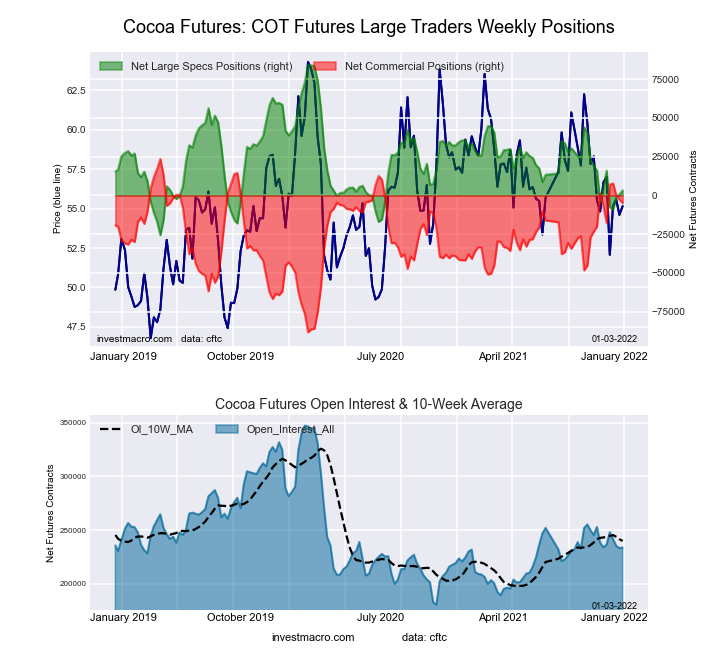 The COCOA large speculator standing this week reached a net position of 3,250 contracts in the data reported through Tuesday. This was a weekly boost of 2,547 contracts from the previous week which had a total of 703 net contracts.
This week’s current strength score (the trader positioning range over the past three years, measured from 0 to 100) shows the speculators are currently Bearish with a score of 26.3 percent. The commercials are Bullish with a score of 74.5 percent and the small traders (not shown in chart) are Bearish with a score of 27.1 percent.
| COCOA Futures Statistics | SPECULATORS | COMMERCIALS | SMALL TRADERS |
| – Percent of Open Interest Longs: | 25.9 | 52.1 | 4.9 |
| – Percent of Open Interest Shorts: | 24.5 | 54.2 | 4.2 |
| – Net Position: | 3,250 | -4,886 | 1,636 |
| – Gross Longs: | 60,559 | 121,644 | 11,367 |
| – Gross Shorts: | 57,309 | 126,530 | 9,731 |
| – Long to Short Ratio: | 1.1 to 1 | 1.0 to 1 | 1.2 to 1 |
| NET POSITION TREND: | |||
| – Strength Index Score (3 Year Range Pct): | 26.3 | 74.5 | 27.1 |
| – Strength Index Reading (3 Year Range): | Bearish | Bullish | Bearish |
| NET POSITION MOVEMENT INDEX: | |||
| – 6-Week Change in Strength Index: | -1.2 | 1.9 | -10.2 |
WHEAT Futures:
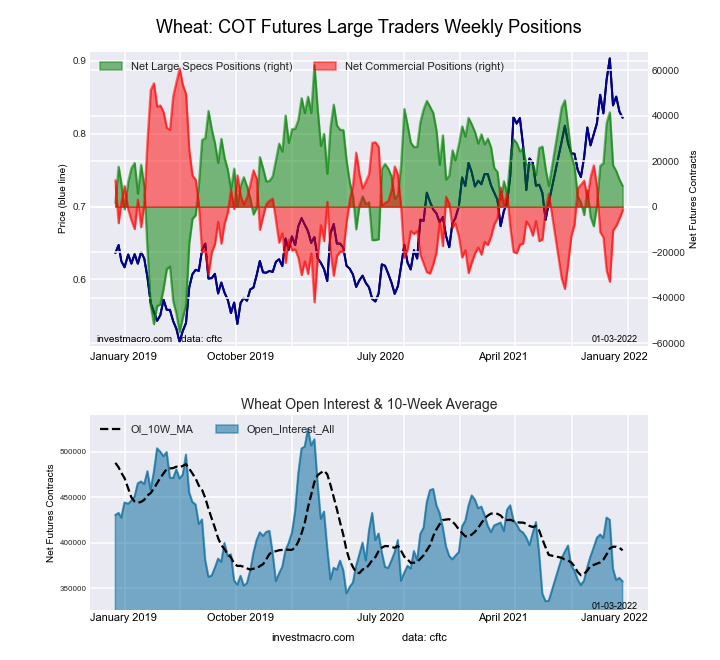 The WHEAT large speculator standing this week reached a net position of 9,132 contracts in the data reported through Tuesday. This was a weekly fall of -2,833 contracts from the previous week which had a total of 11,965 net contracts.
This week’s current strength score (the trader positioning range over the past three years, measured from 0 to 100) shows the speculators are currently Bullish with a score of 54.8 percent. The commercials are Bearish with a score of 39.3 percent and the small traders (not shown in chart) are Bullish with a score of 65.6 percent.
| WHEAT Futures Statistics | SPECULATORS | COMMERCIALS | SMALL TRADERS |
| – Percent of Open Interest Longs: | 29.0 | 37.6 | 8.3 |
| – Percent of Open Interest Shorts: | 26.5 | 38.0 | 10.5 |
| – Net Position: | 9,132 | -1,601 | -7,531 |
| – Gross Longs: | 103,696 | 134,206 | 29,825 |
| – Gross Shorts: | 94,564 | 135,807 | 37,356 |
| – Long to Short Ratio: | 1.1 to 1 | 1.0 to 1 | 0.8 to 1 |
| NET POSITION TREND: | |||
| – Strength Index Score (3 Year Range Pct): | 54.8 | 39.3 | 65.6 |
| – Strength Index Reading (3 Year Range): | Bullish | Bearish | Bullish |
| NET POSITION MOVEMENT INDEX: | |||
| – 6-Week Change in Strength Index: | -8.6 | 11.5 | -8.3 |
Article By InvestMacro – Receive our weekly COT Reports by Email
*COT Report: The COT data, released weekly to the public each Friday, is updated through the most recent Tuesday (data is 3 days old) and shows a quick view of how large speculators or non-commercials (for-profit traders) were positioned in the futures markets.
The CFTC categorizes trader positions according to commercial hedgers (traders who use futures contracts for hedging as part of the business), non-commercials (large traders who speculate to realize trading profits) and nonreportable traders (usually small traders/speculators) as well as their open interest (contracts open in the market at time of reporting).See CFTC criteria here.

- The US introduces new import tariffs for 60 countries. Brent crude surpasses $100 per barrel Jul 24, 2026
- USD/JPY Breaks Records: Nothing Slows the Yen’s Decline Jul 24, 2026
- Oil prices reached a 6‑week high. The AUD strengthened on the back of a strong labor‑market report Jul 23, 2026
- EUR/USD Recovers as Dollar Weakens Jul 23, 2026
- Bitcoin rose to $66,000. The New Zealand dollar continues to strengthen Jul 22, 2026
- Inflationary pressure is easing in Canada. In New Zealand, on the contrary, inflation is rising Jul 21, 2026
- GBP/USD Falls After Cabinet Changes Jul 21, 2026
- Geopolitical and macroeconomic conditions continue to pressure market sentiment Jul 20, 2026
- USD/JPY Poised to Continue Gains as Expensive Oil and Lack of Support Weigh on Yen Jul 20, 2026
- COT Metals Charts: Weekly Speculator Bets led by Copper & Steel Jul 18, 2026