
By InvestMacro | COT | Data Tables | COT Leaders | Downloads | COT Newsletter
Here are the latest charts and statistics for the Commitment of Traders (COT) data published by the Commodities Futures Trading Commission (CFTC). The latest release was delayed by the CFTC due to the New Year’s holiday.
The latest COT data is updated through Tuesday December 28th 2021 and shows a quick view of how large traders (for-profit speculators and commercial entities) were positioned in the futures markets.
Highlighting the COT energy data is the continued decline in the WTI Crude Oil futures bets. The speculative net position in the WTI Crude Oil futures has decreased for seven consecutive weeks and in nine out of the previous ten weeks. The speculator’s crude position has fallen by a total of -91,165 contracts over the past ten weeks and speculators have now pushed their current net positioning to the lowest level since March 5th of 2019, a span of one hundred and forty-eight weeks.
Joining WTI Crude Oil (-1,826 contracts) with lower bets last week were Natural Gas (-5,005 contracts), Gasoline (-2,908 contracts) and the Bloomberg Commodity Index (-11 contracts).
Energy markets with higher positions were Brent Crude Oil (4,285 contracts) and Heating Oil (174 contracts).
Free Reports:
 Get our Weekly Commitment of Traders Reports - See where the biggest traders (Hedge Funds and Commercial Hedgers) are positioned in the futures markets on a weekly basis.
 Sign Up for Our Stock Market Newsletter – Get updated on News, Charts & Rankings of Public Companies when you join our Stocks Newsletter
| Dec-28-2021 | OI | OI-Index | Spec-Net | Spec-Index | Com-Net | COM-Index | Smalls-Net | Smalls-Index |
|---|---|---|---|---|---|---|---|---|
| WTI Crude | 1,867,339 | 0 | 338,429 | 20 | -373,092 | 71 | 34,663 | 64 |
| Gold | 508,912 | 22 | 213,156 | 56 | -245,664 | 43 | 32,508 | 56 |
| Silver | 141,246 | 8 | 26,458 | 49 | -41,928 | 58 | 15,470 | 30 |
| Copper | 180,736 | 13 | 14,383 | 53 | -19,679 | 46 | 5,296 | 56 |
| Palladium | 9,403 | 13 | -3,109 | 4 | 3,230 | 95 | -121 | 38 |
| Platinum | 60,353 | 22 | 4,469 | 9 | -10,655 | 94 | 6,186 | 48 |
| Natural Gas | 1,110,532 | 0 | -146,217 | 35 | 115,610 | 67 | 30,607 | 56 |
| Brent | 215,921 | 52 | -20,716 | 84 | 17,594 | 18 | 3,122 | 52 |
| Heating Oil | 302,721 | 3 | 4,897 | 50 | -21,060 | 49 | 16,163 | 54 |
| Soybeans | 647,225 | 9 | 125,285 | 61 | -93,079 | 44 | -32,206 | 18 |
| Corn | 1,522,692 | 25 | 458,176 | 89 | -411,793 | 13 | -46,383 | 16 |
| Coffee | 261,263 | 30 | 55,265 | 89 | -58,015 | 14 | 2,750 | 7 |
| Sugar | 864,262 | 9 | 184,686 | 75 | -209,011 | 29 | 24,325 | 38 |
| Wheat | 357,381 | 11 | 9,132 | 55 | -1,601 | 39 | -7,531 | 66 |
WTI Crude Oil Futures:
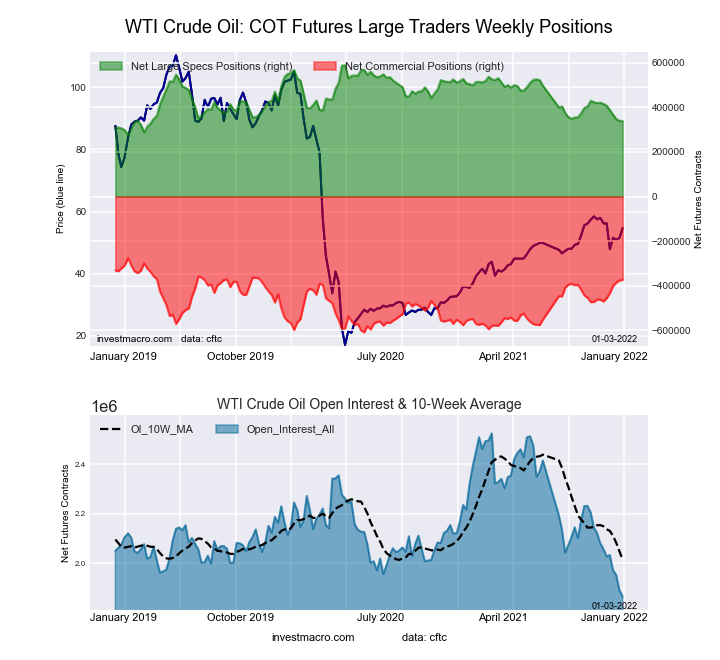 The WTI Crude Oil Futures large speculator standing this week totaled a net position of 338,429 contracts in the data reported through Tuesday. This was a weekly fall of -1,826 contracts from the previous week which had a total of 340,255 net contracts.
This week’s current strength score (the trader positioning range over the past three years, measured from 0 to 100) shows the speculators are currently Bearish-Extreme with a score of 19.6 percent. The commercials are Bullish with a score of 70.7 percent and the small traders (not shown in chart) are Bullish with a score of 63.9 percent.
| WTI Crude Oil Futures Statistics | SPECULATORS | COMMERCIALS | SMALL TRADERS |
| – Percent of Open Interest Longs: | 25.2 | 38.1 | 4.6 |
| – Percent of Open Interest Shorts: | 7.0 | 58.1 | 2.7 |
| – Net Position: | 338,429 | -373,092 | 34,663 |
| – Gross Longs: | 469,946 | 711,711 | 85,391 |
| – Gross Shorts: | 131,517 | 1,084,803 | 50,728 |
| – Long to Short Ratio: | 3.6 to 1 | 0.7 to 1 | 1.7 to 1 |
| NET POSITION TREND: | |||
| – Strength Index Score (3 Year Range Pct): | 19.6 | 70.7 | 63.9 |
| – Strength Index Reading (3 Year Range): | Bearish-Extreme | Bullish | Bullish |
| NET POSITION MOVEMENT INDEX: | |||
| – 6-Week Change in Strength Index: | -24.8 | 29.2 | -28.0 |
Brent Crude Oil Futures:
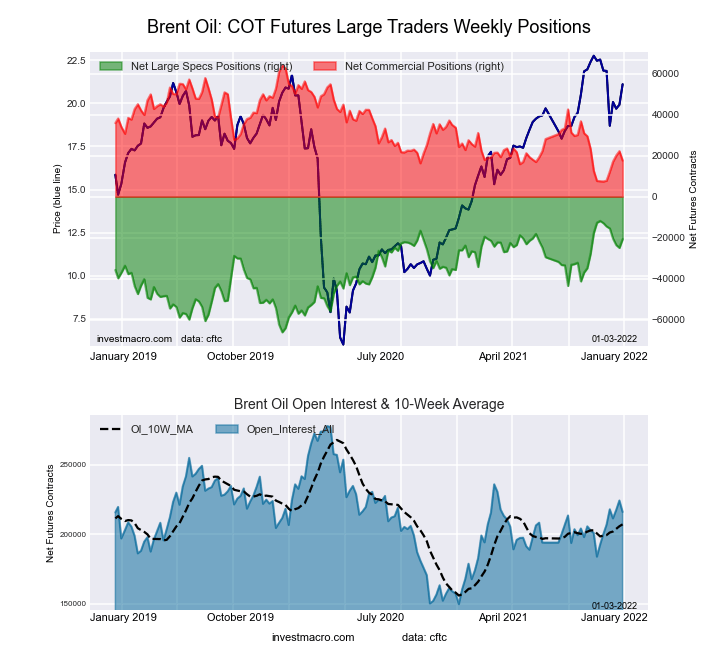 The Brent Crude Oil Futures large speculator standing this week totaled a net position of -20,716 contracts in the data reported through Tuesday. This was a weekly lift of 4,285 contracts from the previous week which had a total of -25,001 net contracts.
This week’s current strength score (the trader positioning range over the past three years, measured from 0 to 100) shows the speculators are currently Bullish-Extreme with a score of 83.7 percent. The commercials are Bearish-Extreme with a score of 17.9 percent and the small traders (not shown in chart) are Bullish with a score of 51.6 percent.
| Brent Crude Oil Futures Statistics | SPECULATORS | COMMERCIALS | SMALL TRADERS |
| – Percent of Open Interest Longs: | 18.9 | 44.6 | 3.4 |
| – Percent of Open Interest Shorts: | 28.5 | 36.4 | 1.9 |
| – Net Position: | -20,716 | 17,594 | 3,122 |
| – Gross Longs: | 40,797 | 96,203 | 7,263 |
| – Gross Shorts: | 61,513 | 78,609 | 4,141 |
| – Long to Short Ratio: | 0.7 to 1 | 1.2 to 1 | 1.8 to 1 |
| NET POSITION TREND: | |||
| – Strength Index Score (3 Year Range Pct): | 83.7 | 17.9 | 51.6 |
| – Strength Index Reading (3 Year Range): | Bullish-Extreme | Bearish-Extreme | Bullish |
| NET POSITION MOVEMENT INDEX: | |||
| – 6-Week Change in Strength Index: | -14.4 | 17.9 | -31.9 |
Natural Gas Futures:
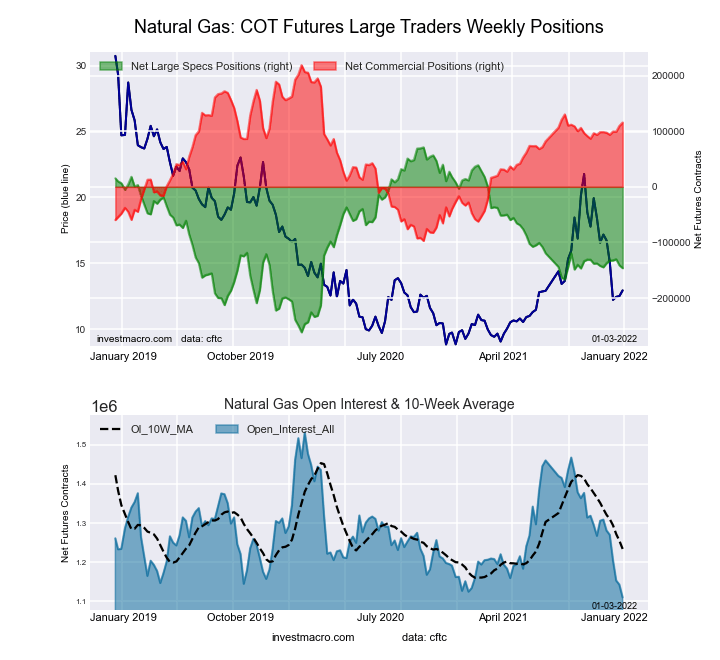 The Natural Gas Futures large speculator standing this week totaled a net position of -146,217 contracts in the data reported through Tuesday. This was a weekly decrease of -5,005 contracts from the previous week which had a total of -141,212 net contracts.
This week’s current strength score (the trader positioning range over the past three years, measured from 0 to 100) shows the speculators are currently Bearish with a score of 34.7 percent. The commercials are Bullish with a score of 67.3 percent and the small traders (not shown in chart) are Bullish with a score of 56.5 percent.
| Natural Gas Futures Statistics | SPECULATORS | COMMERCIALS | SMALL TRADERS |
| – Percent of Open Interest Longs: | 19.0 | 45.5 | 5.0 |
| – Percent of Open Interest Shorts: | 32.2 | 35.1 | 2.2 |
| – Net Position: | -146,217 | 115,610 | 30,607 |
| – Gross Longs: | 211,299 | 505,086 | 55,322 |
| – Gross Shorts: | 357,516 | 389,476 | 24,715 |
| – Long to Short Ratio: | 0.6 to 1 | 1.3 to 1 | 2.2 to 1 |
| NET POSITION TREND: | |||
| – Strength Index Score (3 Year Range Pct): | 34.7 | 67.3 | 56.5 |
| – Strength Index Reading (3 Year Range): | Bearish | Bullish | Bullish |
| NET POSITION MOVEMENT INDEX: | |||
| – 6-Week Change in Strength Index: | -0.5 | 5.4 | -39.4 |
Gasoline Blendstock Futures:
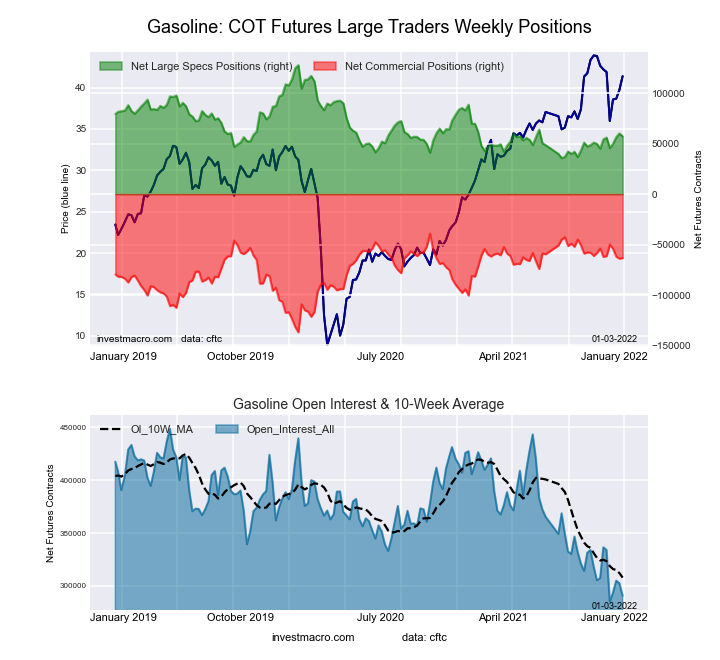 The Gasoline Blendstock Futures large speculator standing this week totaled a net position of 57,245 contracts in the data reported through Tuesday. This was a weekly lowering of -2,908 contracts from the previous week which had a total of 60,153 net contracts.
This week’s current strength score (the trader positioning range over the past three years, measured from 0 to 100) shows the speculators are currently Bearish with a score of 28.4 percent. The commercials are Bullish with a score of 73.7 percent and the small traders (not shown in chart) are Bearish with a score of 48.0 percent.
| Nasdaq Mini Futures Statistics | SPECULATORS | COMMERCIALS | SMALL TRADERS |
| – Percent of Open Interest Longs: | 33.0 | 44.3 | 6.9 |
| – Percent of Open Interest Shorts: | 13.4 | 66.1 | 4.8 |
| – Net Position: | 57,245 | -63,345 | 6,100 |
| – Gross Longs: | 96,105 | 128,840 | 19,965 |
| – Gross Shorts: | 38,860 | 192,185 | 13,865 |
| – Long to Short Ratio: | 2.5 to 1 | 0.7 to 1 | 1.4 to 1 |
| NET POSITION TREND: | |||
| – Strength Index Score (3 Year Range Pct): | 28.4 | 73.7 | 48.0 |
| – Strength Index Reading (3 Year Range): | Bearish | Bullish | Bearish |
| NET POSITION MOVEMENT INDEX: | |||
| – 6-Week Change in Strength Index: | 3.1 | -1.2 | -10.8 |
#2 Heating Oil NY-Harbor Futures:
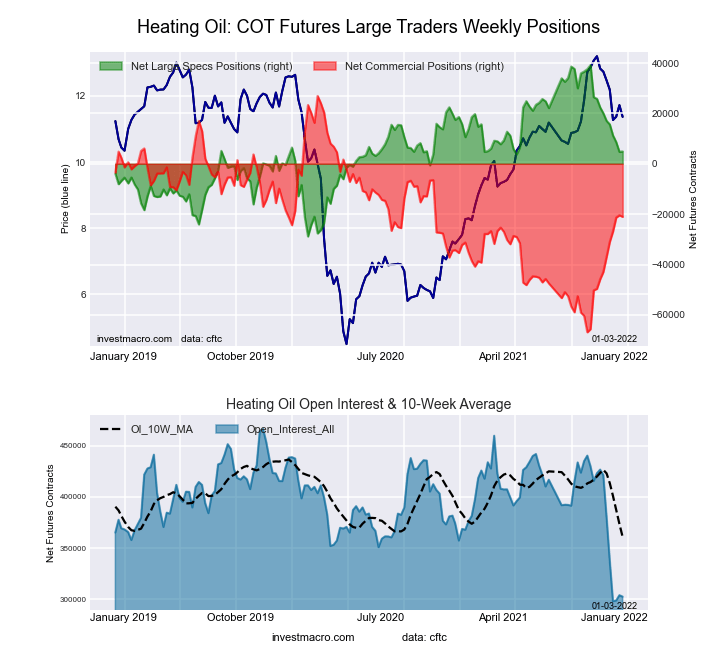 The #2 Heating Oil NY-Harbor Futures large speculator standing this week totaled a net position of 4,897 contracts in the data reported through Tuesday. This was a weekly lift of 174 contracts from the previous week which had a total of 4,723 net contracts.
This week’s current strength score (the trader positioning range over the past three years, measured from 0 to 100) shows the speculators are currently Bearish with a score of 49.6 percent. The commercials are Bearish with a score of 48.9 percent and the small traders (not shown in chart) are Bullish with a score of 54.3 percent.
| Heating Oil Futures Statistics | SPECULATORS | COMMERCIALS | SMALL TRADERS |
| – Percent of Open Interest Longs: | 13.0 | 51.6 | 13.7 |
| – Percent of Open Interest Shorts: | 11.3 | 58.5 | 8.3 |
| – Net Position: | 4,897 | -21,060 | 16,163 |
| – Gross Longs: | 39,255 | 156,088 | 41,332 |
| – Gross Shorts: | 34,358 | 177,148 | 25,169 |
| – Long to Short Ratio: | 1.1 to 1 | 0.9 to 1 | 1.6 to 1 |
| NET POSITION TREND: | |||
| – Strength Index Score (3 Year Range Pct): | 49.6 | 48.9 | 54.3 |
| – Strength Index Reading (3 Year Range): | Bearish | Bearish | Bullish |
| NET POSITION MOVEMENT INDEX: | |||
| – 6-Week Change in Strength Index: | -22.3 | 23.3 | -23.3 |
Bloomberg Commodity Index Futures:
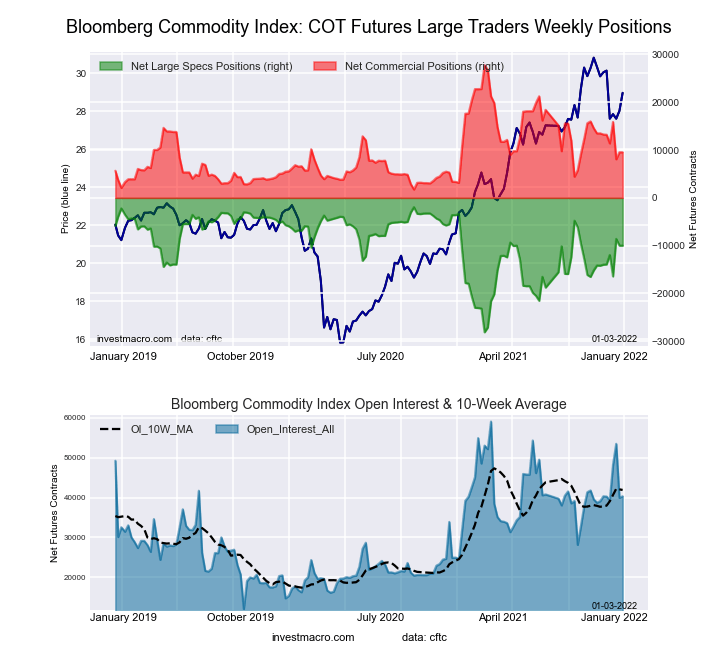 The Bloomberg Commodity Index Futures large speculator standing this week totaled a net position of -9,995 contracts in the data reported through Tuesday. This was a weekly reduction of -11 contracts from the previous week which had a total of -9,984 net contracts.
This week’s current strength score (the trader positioning range over the past three years, measured from 0 to 100) shows the speculators are currently Bullish with a score of 69.2 percent. The commercials are Bearish with a score of 30.0 percent and the small traders (not shown in chart) are Bearish with a score of 44.4 percent.
| Bloomberg Index Futures Statistics | SPECULATORS | COMMERCIALS | SMALL TRADERS |
| – Percent of Open Interest Longs: | 71.3 | 25.1 | 1.2 |
| – Percent of Open Interest Shorts: | 96.1 | 1.5 | 0.1 |
| – Net Position: | -9,995 | 9,537 | 458 |
| – Gross Longs: | 28,751 | 10,137 | 500 |
| – Gross Shorts: | 38,746 | 600 | 42 |
| – Long to Short Ratio: | 0.7 to 1 | 16.9 to 1 | 11.9 to 1 |
| NET POSITION TREND: | |||
| – Strength Index Score (3 Year Range Pct): | 69.2 | 30.0 | 44.4 |
| – Strength Index Reading (3 Year Range): | Bullish | Bearish | Bearish |
| NET POSITION MOVEMENT INDEX: | |||
| – 6-Week Change in Strength Index: | 15.2 | -14.3 | -11.6 |
Article By InvestMacro – Receive our weekly COT Reports by Email
*COT Report: The COT data, released weekly to the public each Friday, is updated through the most recent Tuesday (data is 3 days old) and shows a quick view of how large speculators or non-commercials (for-profit traders) were positioned in the futures markets.
The CFTC categorizes trader positions according to commercial hedgers (traders who use futures contracts for hedging as part of the business), non-commercials (large traders who speculate to realize trading profits) and nonreportable traders (usually small traders/speculators) as well as their open interest (contracts open in the market at time of reporting).See CFTC criteria here.

- The US introduces new import tariffs for 60 countries. Brent crude surpasses $100 per barrel Jul 24, 2026
- USD/JPY Breaks Records: Nothing Slows the Yen’s Decline Jul 24, 2026
- Oil prices reached a 6‑week high. The AUD strengthened on the back of a strong labor‑market report Jul 23, 2026
- EUR/USD Recovers as Dollar Weakens Jul 23, 2026
- Bitcoin rose to $66,000. The New Zealand dollar continues to strengthen Jul 22, 2026
- Inflationary pressure is easing in Canada. In New Zealand, on the contrary, inflation is rising Jul 21, 2026
- GBP/USD Falls After Cabinet Changes Jul 21, 2026
- Geopolitical and macroeconomic conditions continue to pressure market sentiment Jul 20, 2026
- USD/JPY Poised to Continue Gains as Expensive Oil and Lack of Support Weigh on Yen Jul 20, 2026
- COT Metals Charts: Weekly Speculator Bets led by Copper & Steel Jul 18, 2026